Zip Codes with the Highest Percentage of Population Employed in Food Preparation & Serving in Columbus, OH

RELATED REPORTS & OPTIONS

Food Preparation & Serving
Population
Families and Households
Female Fertility
Female Fertility (Unmarried)
Race (Community Size)
Race (Percentage)
Ancestry (Community Size)
AfghanAfricanAlbanianAlsatianAmericanApacheArabArgentineanArmenianAustralianAustrianBahamianBangladeshiBarbadianBasqueBelgianBelizeanBhutaneseBlackfeetBolivianBrazilianBritishBritish West IndianBulgarianBurmeseCambodianCanadianCape VerdeanCarpatho RusynCelticCentral AmericanCentral American IndianCherokeeChileanChippewaChoctawColombianCosta RicanCreeCreekCroatianCrowCubanCzechCzechoslovakianDanishDelawareDominicanDutchDutch West IndianEastern EuropeanEcuadorianEgyptianEnglishEstonianEthiopianEuropeanFilipinoFinnishFrenchFrench American IndianFrench CanadianGermanGerman RussianGhanaianGreekGuamanian / ChamorroGuatemalanGuyaneseHaitianHonduranHungarianIcelanderIndian (Asian)IndonesianInupiatIranianIraqiIrishIroquoisIsraeliItalianJamaicanJapaneseJordanianKenyanKoreanLaotianLatvianLebaneseLiberianLithuanianLumbeeLuxembourgerMacedonianMalaysianMalteseMexicanMexican American IndianMongolianMoroccanNative HawaiianNavajoNew ZealanderNicaraguanNigerianNorthern EuropeanNorwegianPakistaniPalestinianPanamanianParaguayanPennsylvania GermanPeruvianPolishPortuguesePuerto RicanRomanianRussianSalvadoranSamoanScandinavianScotch-IrishScottishSeminoleSenegaleseSerbianSierra LeoneanSiouxSlavicSlovakSloveneSomaliSouth AfricanSouth AmericanSouth American IndianSpaniardSpanishSri LankanSubsaharan AfricanSudaneseSwedishSwissSyrianThaiTrinidadian and TobagonianTurkishUgandanUkrainianUruguayanVenezuelanVietnameseWelshWest IndianYaquiYugoslavianZimbabwean
Ancestry (Percentage)
AfghanAfricanAlbanianAlsatianAmericanApacheArabArgentineanArmenianAustralianAustrianBahamianBangladeshiBarbadianBasqueBelgianBelizeanBhutaneseBlackfeetBolivianBrazilianBritishBritish West IndianBulgarianBurmeseCambodianCanadianCape VerdeanCarpatho RusynCelticCentral AmericanCentral American IndianCherokeeChileanChippewaChoctawColombianCosta RicanCreeCreekCroatianCrowCubanCzechCzechoslovakianDanishDelawareDominicanDutchDutch West IndianEastern EuropeanEcuadorianEgyptianEnglishEstonianEthiopianEuropeanFilipinoFinnishFrenchFrench American IndianFrench CanadianGermanGerman RussianGhanaianGreekGuamanian / ChamorroGuatemalanGuyaneseHaitianHonduranHungarianIcelanderIndian (Asian)IndonesianInupiatIranianIraqiIrishIroquoisIsraeliItalianJamaicanJapaneseJordanianKenyanKoreanLaotianLatvianLebaneseLiberianLithuanianLumbeeLuxembourgerMacedonianMalaysianMalteseMexicanMexican American IndianMongolianMoroccanNative HawaiianNavajoNew ZealanderNicaraguanNigerianNorthern EuropeanNorwegianPakistaniPalestinianPanamanianParaguayanPennsylvania GermanPeruvianPolishPortuguesePuerto RicanRomanianRussianSalvadoranSamoanScandinavianScotch-IrishScottishSeminoleSenegaleseSerbianSierra LeoneanSiouxSlavicSlovakSloveneSomaliSouth AfricanSouth AmericanSouth American IndianSpaniardSpanishSri LankanSubsaharan AfricanSudaneseSwedishSwissSyrianThaiTrinidadian and TobagonianTurkishUgandanUkrainianUruguayanVenezuelanVietnameseWelshWest IndianYaquiYugoslavianZimbabwean
Immigrant Origin (Total)
AfghanistanAfricaAlbaniaArgentinaArmeniaAsiaAustraliaBahamasBangladeshBarbadosBelarusBelgiumBelizeBosnia and HerzegovinaBrazilBulgariaBurma / MyanmarCambodiaCameroonCanadaCaribbeanCentral AmericaChileChinaColombiaCongoCosta RicaCubaCzechoslovakiaDominican RepublicEastern AfricaEastern AsiaEastern EuropeEcuadorEgyptEl SalvadorEnglandEritreaEthiopiaEuropeFranceGermanyGhanaGreeceGuatemalaGuyanaHaitiHondurasHong KongHungaryIndiaIndonesiaIranIraqIrelandIsraelItalyJamaicaJapanJordanKazakhstanKenyaKoreaKuwaitLaosLatin AmericaLatviaLebanonLiberiaLithuaniaMalaysiaMexicoMiddle AfricaMoroccoNepalNetherlandsNigeriaNorth MacedoniaNorthern AfricaNorthern EuropeOceaniaPakistanPanamaPeruPhilippinesPolandRomaniaRussiaSaudi ArabiaScotlandSenegalSerbiaSierra LeoneSingaporeSomaliaSouth AfricaSouth AmericaSouth Central AsiaSouth Eastern AsiaSouthern EuropeSpainSri LankaSudanSwitzerlandSyriaTaiwanThailandTrinidad and TobagoTurkeyUgandaUkraineUruguayUzbekistanVenezuelaVietnamWestern AfricaWestern AsiaWestern EuropeZaireZimbabwe
Immigrant Origin (Percentage)
AfghanistanAfricaAlbaniaArgentinaArmeniaAsiaAustraliaBahamasBangladeshBarbadosBelarusBelgiumBelizeBosnia and HerzegovinaBrazilBulgariaBurma / MyanmarCambodiaCameroonCanadaCaribbeanCentral AmericaChileChinaColombiaCongoCosta RicaCubaCzechoslovakiaDominican RepublicEastern AfricaEastern AsiaEastern EuropeEcuadorEgyptEl SalvadorEnglandEritreaEthiopiaEuropeFranceGermanyGhanaGreeceGuatemalaGuyanaHaitiHondurasHong KongHungaryIndiaIndonesiaIranIraqIrelandIsraelItalyJamaicaJapanJordanKazakhstanKenyaKoreaKuwaitLaosLatin AmericaLatviaLebanonLiberiaLithuaniaMalaysiaMexicoMiddle AfricaMoroccoNepalNetherlandsNigeriaNorth MacedoniaNorthern AfricaNorthern EuropeOceaniaPakistanPanamaPeruPhilippinesPolandRomaniaRussiaSaudi ArabiaScotlandSenegalSerbiaSierra LeoneSingaporeSomaliaSouth AfricaSouth AmericaSouth Central AsiaSouth Eastern AsiaSouthern EuropeSpainSri LankaSudanSwitzerlandSyriaTaiwanThailandTrinidad and TobagoTurkeyUgandaUkraineUruguayUzbekistanVenezuelaVietnamWestern AfricaWestern AsiaWestern EuropeZaireZimbabwe
Income
Income (Families)
Income (Households)
Poverty
Poverty (Families)
Unemployment
Employment Occupations
Employment Industries
Employer Class
Commute Time
Commute Means
School Enrollment
Education by Degree Field
Occupancy
Finances
Physical Characteristics
Columbus
Compare Zip Codes
Comparison Subject

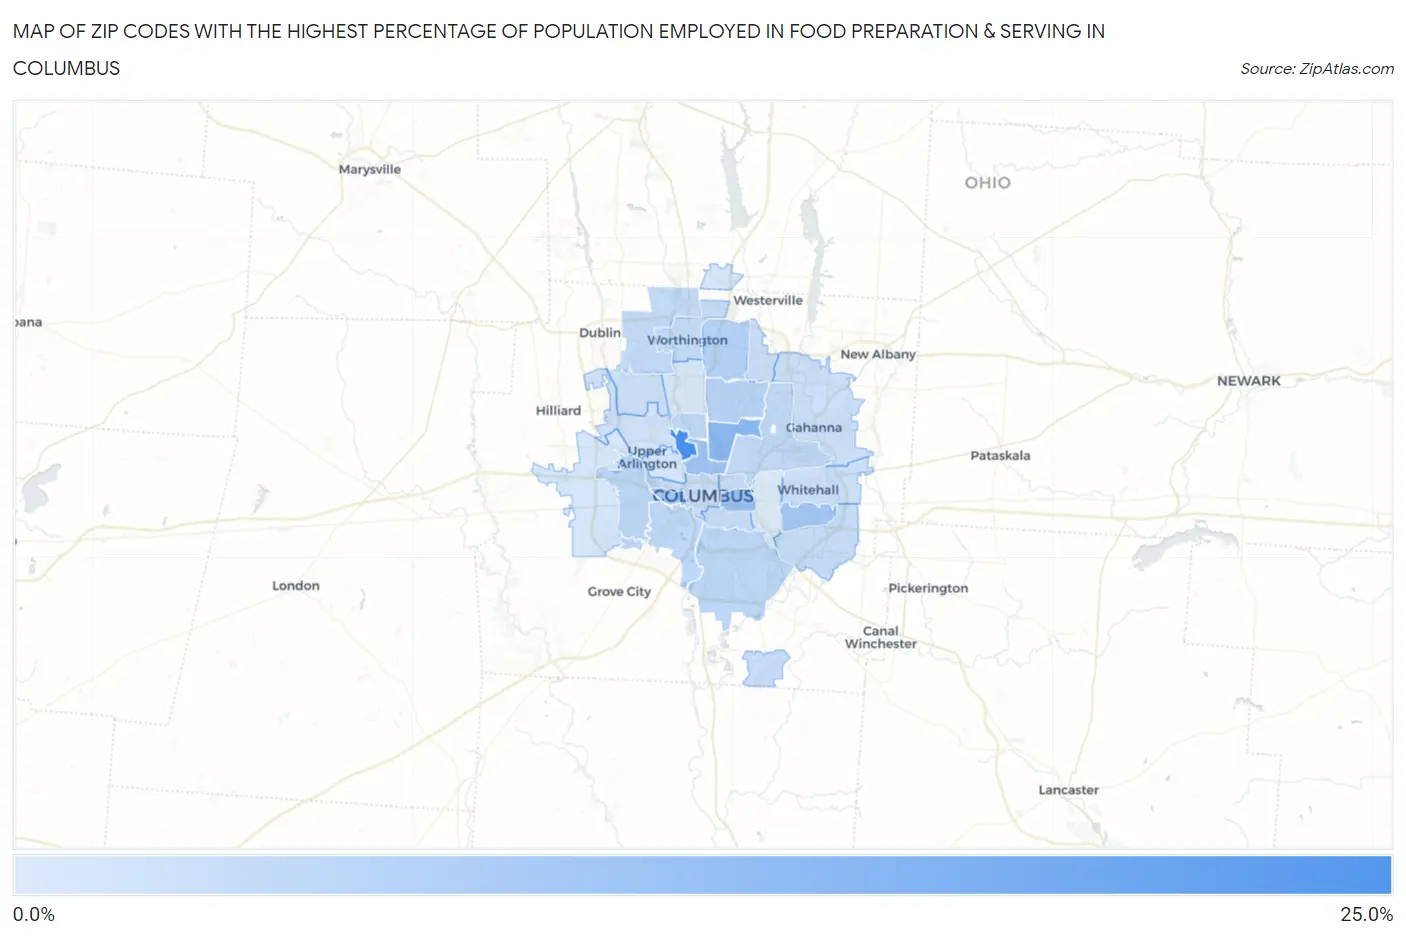
Map of Zip Codes with the Highest Percentage of Population Employed in Food Preparation & Serving in Columbus

0.0%
25.0%
Zip Codes with the Highest Percentage of Population Employed in Food Preparation & Serving in Columbus Map

Zip Codes with the Highest Percentage of Population Employed in Food Preparation & Serving in Columbus, OH

Zip Code % Employed vs State vs National
1.4321020.0%5.6%(+14.4)#235.3%(+14.8)#499
2.4321112.0%5.6%(+6.42)#755.3%(+6.74)#1,655
3.4320510.5%5.6%(+4.87)#1065.3%(+5.19)#2,332
4.432019.6%5.6%(+4.00)#1325.3%(+4.32)#2,968
5.432229.5%5.6%(+3.94)#1365.3%(+4.26)#3,021
6.432279.3%5.6%(+3.66)#1485.3%(+3.98)#3,262
7.432297.3%5.6%(+1.73)#2725.3%(+2.05)#5,864
8.432247.2%5.6%(+1.62)#2815.3%(+1.94)#6,088
9.432046.6%5.6%(+0.981)#3415.3%(+1.30)#7,638
10.432076.5%5.6%(+0.902)#3465.3%(+1.22)#7,853
11.432236.3%5.6%(+0.645)#3805.3%(+0.965)#8,574
12.432026.2%5.6%(+0.599)#3915.3%(+0.918)#8,713
13.432196.1%5.6%(+0.498)#3985.3%(+0.818)#9,004
14.432356.0%5.6%(+0.346)#4195.3%(+0.666)#9,499
15.430855.6%5.6%(+0.015)#4625.3%(+0.335)#10,638
16.432035.6%5.6%(-0.033)#4705.3%(+0.287)#10,793
17.432325.5%5.6%(-0.061)#4755.3%(+0.259)#10,912
18.432065.5%5.6%(-0.128)#4815.3%(+0.192)#11,133
19.432175.3%5.6%(-0.313)#5115.3%(+0.007)#11,793
20.432315.2%5.6%(-0.395)#5225.3%(-0.075)#12,093
21.432155.0%5.6%(-0.570)#5585.3%(-0.251)#12,806
22.432134.9%5.6%(-0.670)#5775.3%(-0.350)#13,200
23.432304.9%5.6%(-0.739)#5935.3%(-0.419)#13,490
24.432204.8%5.6%(-0.757)#5955.3%(-0.437)#13,566
25.432214.4%5.6%(-1.18)#6645.3%(-0.862)#15,320
26.432124.2%5.6%(-1.45)#7095.3%(-1.13)#16,486
27.432283.9%5.6%(-1.69)#7505.3%(-1.37)#17,470
28.432403.9%5.6%(-1.72)#7565.3%(-1.40)#17,599
29.432143.8%5.6%(-1.83)#7725.3%(-1.51)#18,013
30.432093.2%5.6%(-2.40)#8685.3%(-2.08)#20,465

Common Questions

What are the Top 10 Zip Codes with the Highest Percentage of Population Employed in Food Preparation & Serving in Columbus, OH?
Top 10 Zip Codes with the Highest Percentage of Population Employed in Food Preparation & Serving in Columbus, OH are:
#1
20.0%
#2
12.0%
#3
10.5%
#4
9.6%
#5
9.5%
#6
9.3%
#7
7.3%
#8
7.2%
#9
6.6%
#10
6.5%
What zip code has the Highest Percentage of Population Employed in Food Preparation & Serving in Columbus, OH?
43210 has the Highest Percentage of Population Employed in Food Preparation & Serving in Columbus, OH with 20.0%.
What is the Percentage of Population Employed in Food Preparation & Serving in Columbus, OH?
Percentage of Population Employed in Food Preparation & Serving in Columbus is 5.8%.
What is the Percentage of Population Employed in Food Preparation & Serving in Ohio?
Percentage of Population Employed in Food Preparation & Serving in Ohio is 5.6%.
What is the Percentage of Population Employed in Food Preparation & Serving in the United States?
Percentage of Population Employed in Food Preparation & Serving in the United States is 5.3%.