Harbor Hills, OH
Harbor Hills Map
Harbor Hills Overview
1,635
TOTAL POPULATION
797
MALE POPULATION
838
FEMALE POPULATION
95.11
MALES / 100 FEMALES
105.14
FEMALES / 100 MALES
42.8
MEDIAN AGE
2.9
AVG FAMILY SIZE
2.5
AVG HOUSEHOLD SIZE
$46,682
PER CAPITA INCOME
$115,781
AVG FAMILY INCOME
$79,423
AVG HOUSEHOLD INCOME
3.1%
WAGE / INCOME GAP [ % ]
96.9¢/ $1
WAGE / INCOME GAP [ $ ]
0.35
INEQUALITY / GINI INDEX
799
LABOR FORCE [ PEOPLE ]
61.1%
PERCENT IN LABOR FORCE
3.0%
UNEMPLOYMENT RATE
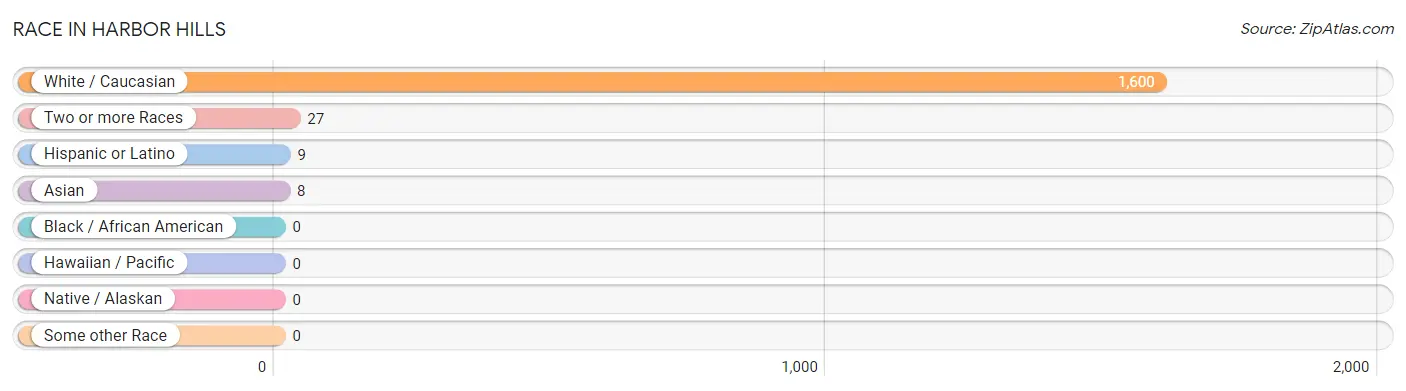
Race in Harbor Hills
The most populous races in Harbor Hills are White / Caucasian (1,600 | 97.9%), Two or more Races (27 | 1.7%), and Hispanic or Latino (9 | 0.5%).
| Race | # Population | % Population |
| Asian | 8 | 0.5% |
| Black / African American | 0 | 0.0% |
| Hawaiian / Pacific | 0 | 0.0% |
| Hispanic or Latino | 9 | 0.5% |
| Native / Alaskan | 0 | 0.0% |
| White / Caucasian | 1,600 | 97.9% |
| Two or more Races | 27 | 1.7% |
| Some other Race | 0 | 0.0% |
| Total | 1,635 | 100.0% |
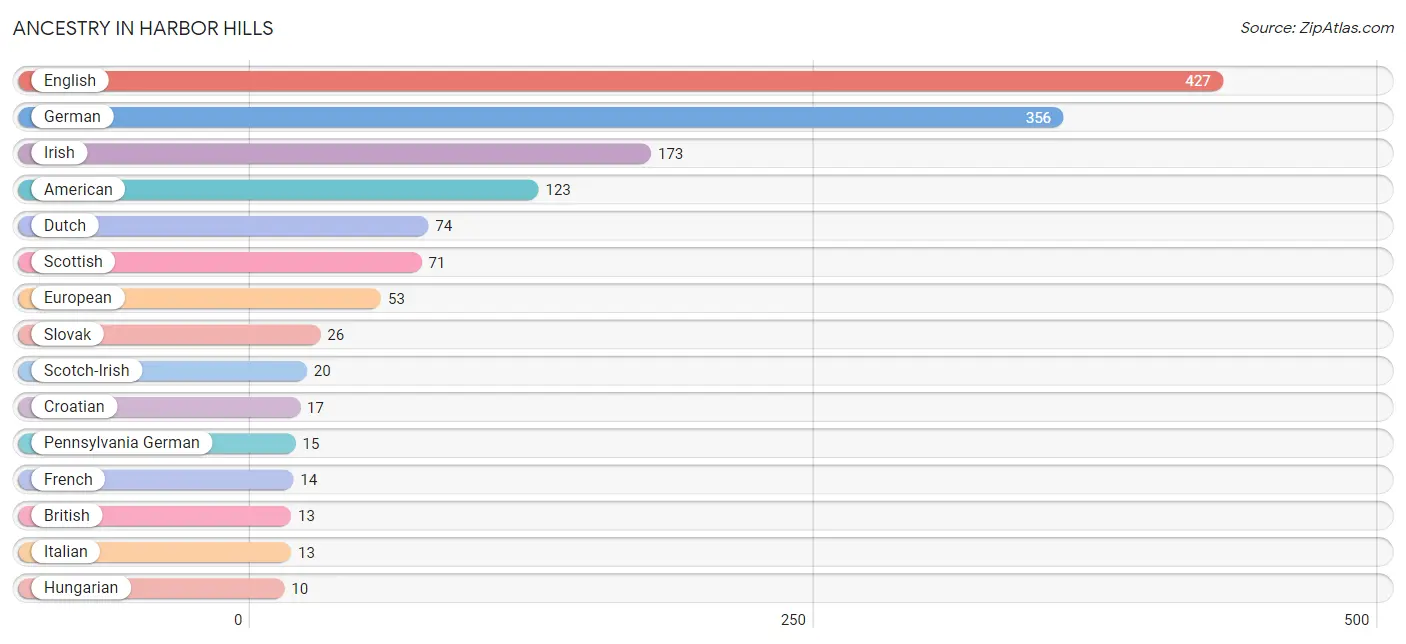
Ancestry in Harbor Hills
The most populous ancestries reported in Harbor Hills are English (427 | 26.1%), German (356 | 21.8%), Irish (173 | 10.6%), American (123 | 7.5%), and Dutch (74 | 4.5%), together accounting for 70.5% of all Harbor Hills residents.
| Ancestry | # Population | % Population |
| American | 123 | 7.5% |
| British | 13 | 0.8% |
| Croatian | 17 | 1.0% |
| Dutch | 74 | 4.5% |
| English | 427 | 26.1% |
| European | 53 | 3.2% |
| French | 14 | 0.9% |
| German | 356 | 21.8% |
| Hungarian | 10 | 0.6% |
| Indian (Asian) | 8 | 0.5% |
| Irish | 173 | 10.6% |
| Italian | 13 | 0.8% |
| Pennsylvania German | 15 | 0.9% |
| Romanian | 9 | 0.5% |
| Scandinavian | 5 | 0.3% |
| Scotch-Irish | 20 | 1.2% |
| Scottish | 71 | 4.3% |
| Slovak | 26 | 1.6% |
| Spaniard | 9 | 0.5% | View All 19 Rows |
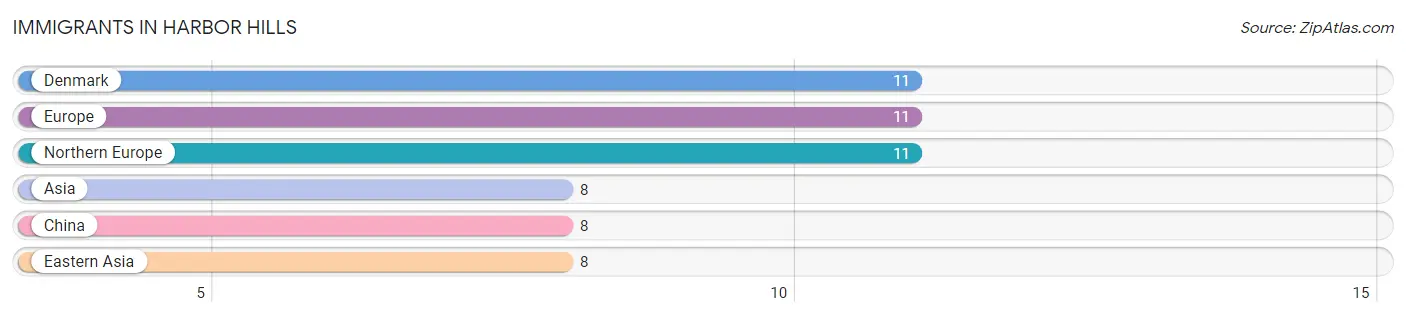
Immigrants in Harbor Hills
The most numerous immigrant groups reported in Harbor Hills came from Denmark (11 | 0.7%), Europe (11 | 0.7%), Northern Europe (11 | 0.7%), Asia (8 | 0.5%), and China (8 | 0.5%), together accounting for 3.0% of all Harbor Hills residents.
| Immigration Origin | # Population | % Population |
| Asia | 8 | 0.5% |
| China | 8 | 0.5% |
| Denmark | 11 | 0.7% |
| Eastern Asia | 8 | 0.5% |
| Europe | 11 | 0.7% |
| Northern Europe | 11 | 0.7% | View All 6 Rows |
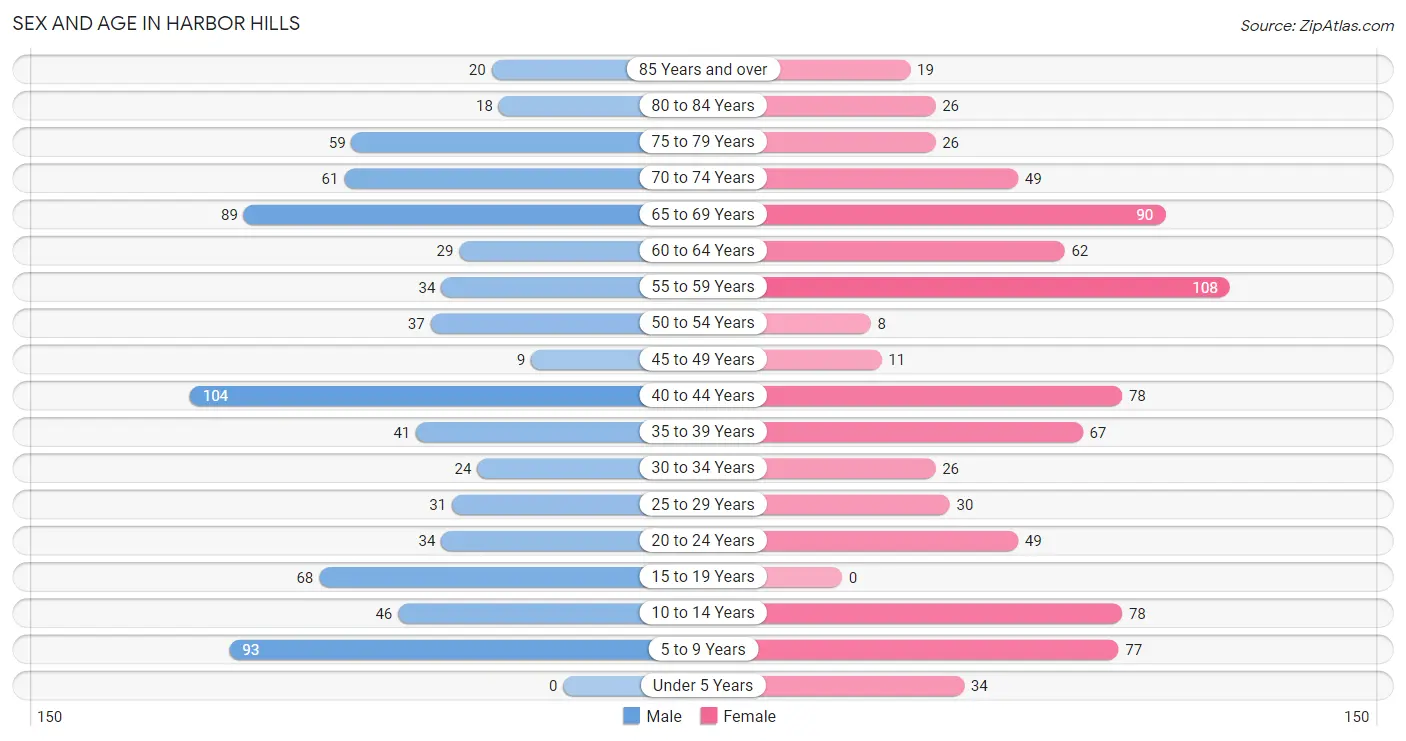
Sex and Age in Harbor Hills
Sex and Age in Harbor Hills
The most populous age groups in Harbor Hills are 40 to 44 Years (104 | 13.1%) for men and 55 to 59 Years (108 | 12.9%) for women.
| Age Bracket | Male | Female |
| Under 5 Years | 0 (0.0%) | 34 (4.1%) |
| 5 to 9 Years | 93 (11.7%) | 77 (9.2%) |
| 10 to 14 Years | 46 (5.8%) | 78 (9.3%) |
| 15 to 19 Years | 68 (8.5%) | 0 (0.0%) |
| 20 to 24 Years | 34 (4.3%) | 49 (5.9%) |
| 25 to 29 Years | 31 (3.9%) | 30 (3.6%) |
| 30 to 34 Years | 24 (3.0%) | 26 (3.1%) |
| 35 to 39 Years | 41 (5.1%) | 67 (8.0%) |
| 40 to 44 Years | 104 (13.1%) | 78 (9.3%) |
| 45 to 49 Years | 9 (1.1%) | 11 (1.3%) |
| 50 to 54 Years | 37 (4.6%) | 8 (0.9%) |
| 55 to 59 Years | 34 (4.3%) | 108 (12.9%) |
| 60 to 64 Years | 29 (3.6%) | 62 (7.4%) |
| 65 to 69 Years | 89 (11.2%) | 90 (10.7%) |
| 70 to 74 Years | 61 (7.6%) | 49 (5.9%) |
| 75 to 79 Years | 59 (7.4%) | 26 (3.1%) |
| 80 to 84 Years | 18 (2.3%) | 26 (3.1%) |
| 85 Years and over | 20 (2.5%) | 19 (2.3%) |
| Total | 797 (100.0%) | 838 (100.0%) |
Families and Households in Harbor Hills
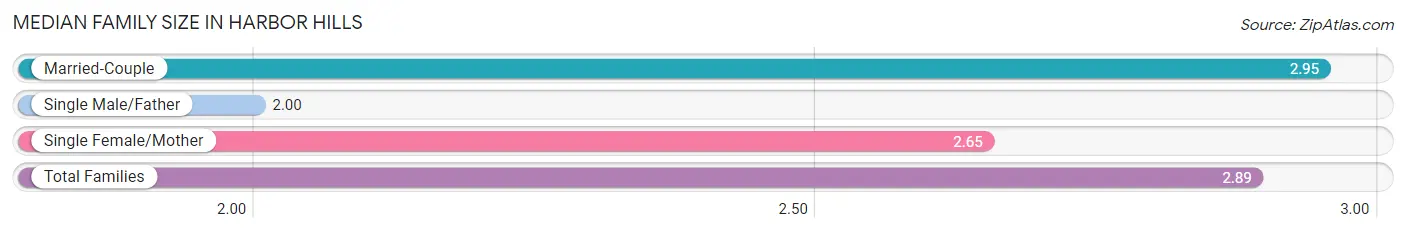
Median Family Size in Harbor Hills
The median family size in Harbor Hills is 2.89 persons per family, with married-couple families (427 | 87.0%) accounting for the largest median family size of 2.95 persons per family. On the other hand, single male/father families (16 | 3.3%) represent the smallest median family size with 2.00 persons per family.
| Family Type | # Families | Family Size |
| Married-Couple | 427 (87.0%) | 2.95 |
| Single Male/Father | 16 (3.3%) | 2.00 |
| Single Female/Mother | 48 (9.8%) | 2.65 |
| Total Families | 491 (100.0%) | 2.89 |
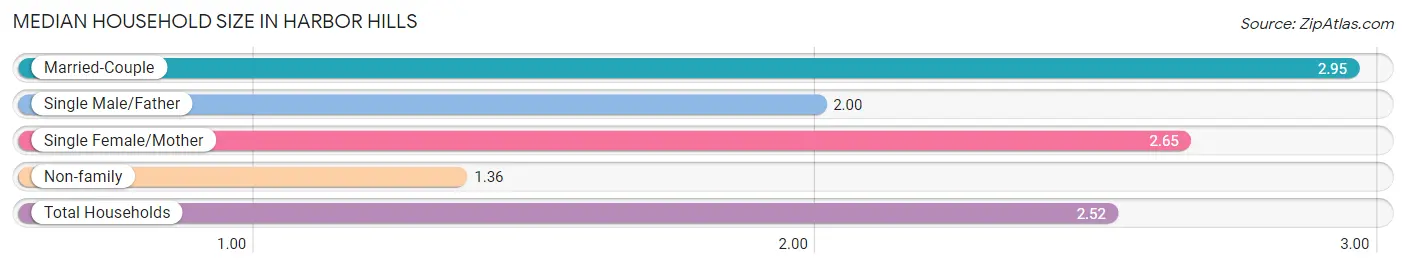
Median Household Size in Harbor Hills
The median household size in Harbor Hills is 2.52 persons per household, with married-couple households (427 | 65.7%) accounting for the largest median household size of 2.95 persons per household. non-family households (159 | 24.5%) represent the smallest median household size with 1.36 persons per household.
| Household Type | # Households | Household Size |
| Married-Couple | 427 (65.7%) | 2.95 |
| Single Male/Father | 16 (2.5%) | 2.00 |
| Single Female/Mother | 48 (7.4%) | 2.65 |
| Non-family | 159 (24.5%) | 1.36 |
| Total Households | 650 (100.0%) | 2.52 |
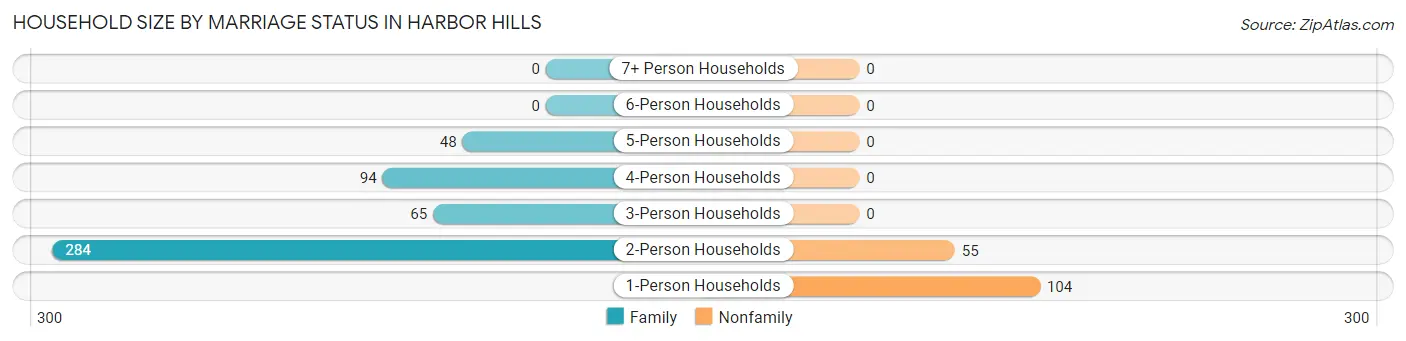
Household Size by Marriage Status in Harbor Hills
Out of a total of 650 households in Harbor Hills, 491 (75.5%) are family households, while 159 (24.5%) are nonfamily households. The most numerous type of family households are 2-person households, comprising 284, and the most common type of nonfamily households are 1-person households, comprising 104.
| Household Size | Family Households | Nonfamily Households |
| 1-Person Households | - | 104 (16.0%) |
| 2-Person Households | 284 (43.7%) | 55 (8.5%) |
| 3-Person Households | 65 (10.0%) | 0 (0.0%) |
| 4-Person Households | 94 (14.5%) | 0 (0.0%) |
| 5-Person Households | 48 (7.4%) | 0 (0.0%) |
| 6-Person Households | 0 (0.0%) | 0 (0.0%) |
| 7+ Person Households | 0 (0.0%) | 0 (0.0%) |
| Total | 491 (75.5%) | 159 (24.5%) |
Female Fertility in Harbor Hills
Fertility by Age in Harbor Hills
| Age Bracket | Women with Births | Births / 1,000 Women |
| 15 to 19 years | 0 (0.0%) | 0.0 |
| 20 to 34 years | 0 (0.0%) | 0.0 |
| 35 to 50 years | 0 (0.0%) | 0.0 |
| Total | 0 (0.0%) | 0.0 |
Fertility by Age by Marriage Status in Harbor Hills
| Age Bracket | Married | Unmarried |
| 15 to 19 years | 0 (0.0%) | 0 (0.0%) |
| 20 to 34 years | 0 (0.0%) | 0 (0.0%) |
| 35 to 50 years | 0 (0.0%) | 0 (0.0%) |
| Total | 0 (0.0%) | 0 (0.0%) |
Fertility by Education in Harbor Hills
| Educational Attainment | Women with Births | Births / 1,000 Women |
| Less than High School | 0 (0.0%) | 0.0 |
| High School Diploma | 0 (0.0%) | 0.0 |
| College or Associate's Degree | 0 (0.0%) | 0.0 |
| Bachelor's Degree | 0 (0.0%) | 0.0 |
| Graduate Degree | 0 (0.0%) | 0.0 |
| Total | 0 (0.0%) | 0.0 |
Fertility by Education by Marriage Status in Harbor Hills
| Educational Attainment | Married | Unmarried |
| Less than High School | 0 (0.0%) | 0 (0.0%) |
| High School Diploma | 0 (0.0%) | 0 (0.0%) |
| College or Associate's Degree | 0 (0.0%) | 0 (0.0%) |
| Bachelor's Degree | 0 (0.0%) | 0 (0.0%) |
| Graduate Degree | 0 (0.0%) | 0 (0.0%) |
| Total | 0 (0.0%) | 0 (0.0%) |
Income in Harbor Hills
Income Overview in Harbor Hills
Per Capita Income in Harbor Hills is $46,682, while median incomes of families and households are $115,781 and $79,423 respectively.
| Characteristic | Number | Measure |
| Per Capita Income | 1,635 | $46,682 |
| Median Family Income | 491 | $115,781 |
| Mean Family Income | 491 | $131,786 |
| Median Household Income | 650 | $79,423 |
| Mean Household Income | 650 | $115,362 |
| Income Deficit | 491 | $0 |
| Wage / Income Gap (%) | 1,635 | 3.13% |
| Wage / Income Gap ($) | 1,635 | 96.87¢ per $1 |
| Gini / Inequality Index | 1,635 | 0.35 |
Earnings by Sex in Harbor Hills
Average Earnings in Harbor Hills are $49,670, $49,646 for men and $51,250 for women, a difference of 3.1%.
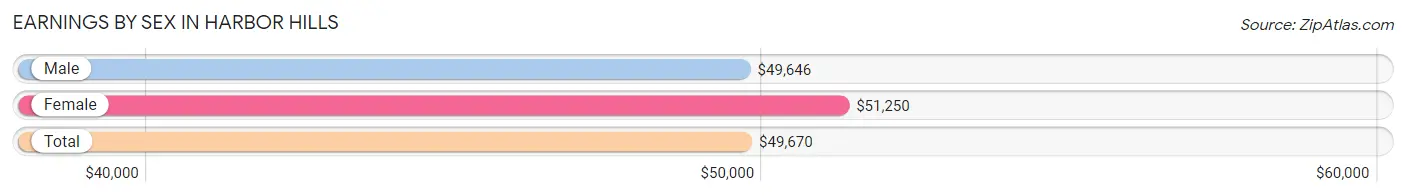
| Sex | Number | Average Earnings |
| Male | 485 (57.9%) | $49,646 |
| Female | 353 (42.1%) | $51,250 |
| Total | 838 (100.0%) | $49,670 |
Earnings by Sex by Income Bracket in Harbor Hills
The most common earnings brackets in Harbor Hills are $45,000 to $49,999 for men (64 | 13.2%) and $100,000+ for women (64 | 18.1%).
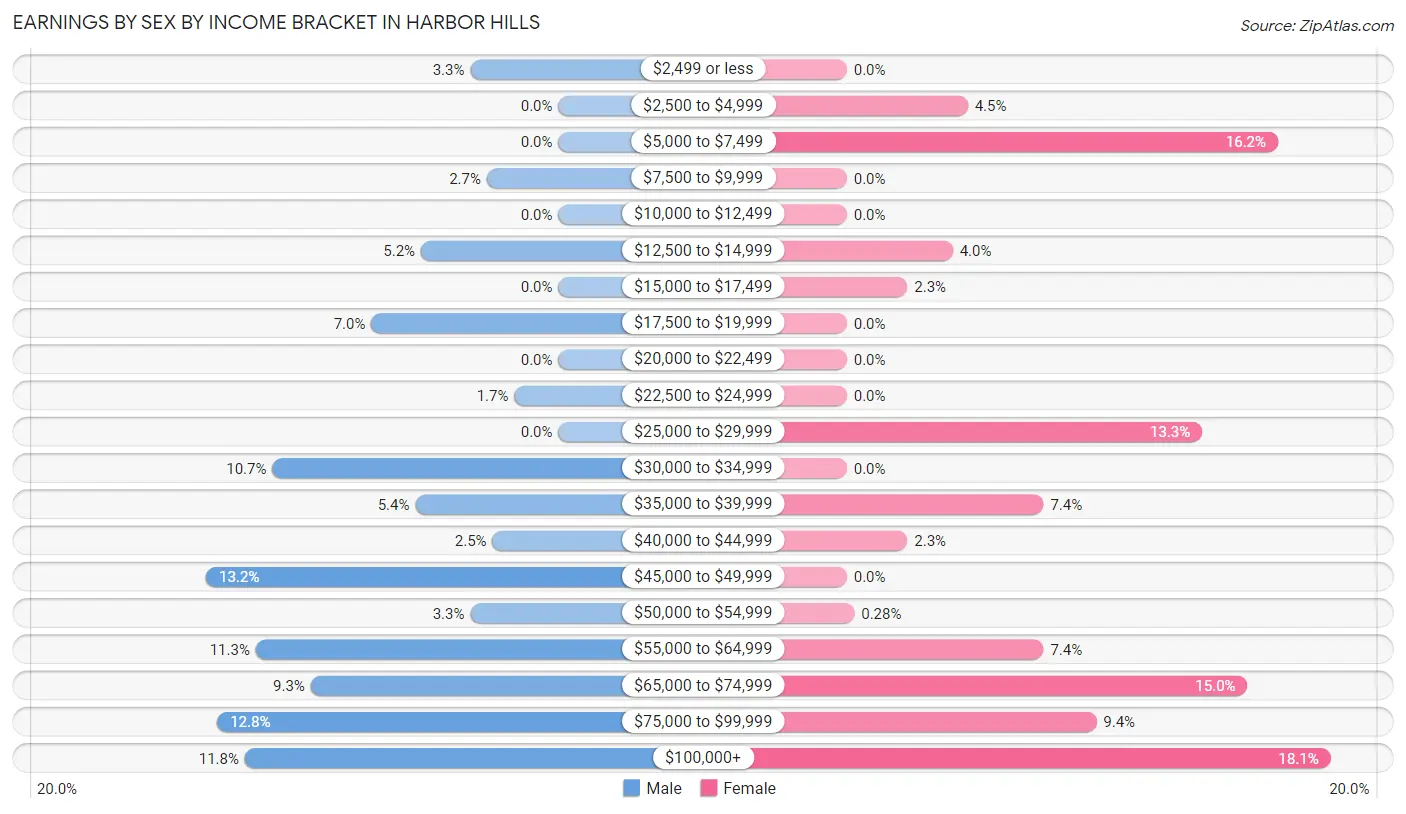
| Income | Male | Female |
| $2,499 or less | 16 (3.3%) | 0 (0.0%) |
| $2,500 to $4,999 | 0 (0.0%) | 16 (4.5%) |
| $5,000 to $7,499 | 0 (0.0%) | 57 (16.2%) |
| $7,500 to $9,999 | 13 (2.7%) | 0 (0.0%) |
| $10,000 to $12,499 | 0 (0.0%) | 0 (0.0%) |
| $12,500 to $14,999 | 25 (5.1%) | 14 (4.0%) |
| $15,000 to $17,499 | 0 (0.0%) | 8 (2.3%) |
| $17,500 to $19,999 | 34 (7.0%) | 0 (0.0%) |
| $20,000 to $22,499 | 0 (0.0%) | 0 (0.0%) |
| $22,500 to $24,999 | 8 (1.7%) | 0 (0.0%) |
| $25,000 to $29,999 | 0 (0.0%) | 47 (13.3%) |
| $30,000 to $34,999 | 52 (10.7%) | 0 (0.0%) |
| $35,000 to $39,999 | 26 (5.4%) | 26 (7.4%) |
| $40,000 to $44,999 | 12 (2.5%) | 8 (2.3%) |
| $45,000 to $49,999 | 64 (13.2%) | 0 (0.0%) |
| $50,000 to $54,999 | 16 (3.3%) | 1 (0.3%) |
| $55,000 to $64,999 | 55 (11.3%) | 26 (7.4%) |
| $65,000 to $74,999 | 45 (9.3%) | 53 (15.0%) |
| $75,000 to $99,999 | 62 (12.8%) | 33 (9.3%) |
| $100,000+ | 57 (11.7%) | 64 (18.1%) |
| Total | 485 (100.0%) | 353 (100.0%) |
Earnings by Sex by Educational Attainment in Harbor Hills
Average earnings in Harbor Hills are $60,281 for men and $59,808 for women, a difference of 0.8%. Men with an educational attainment of graduate degree enjoy the highest average annual earnings of $93,393, while those with college or associate's degree education earn the least with $49,387. Women with an educational attainment of high school diploma earn the most with the average annual earnings of $72,807, while those with college or associate's degree education have the smallest earnings of $58,029.
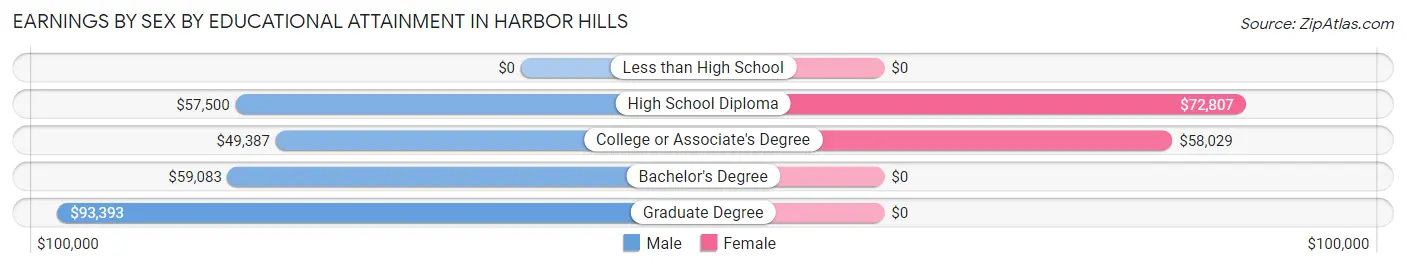
| Educational Attainment | Male Income | Female Income |
| Less than High School | - | - |
| High School Diploma | $57,500 | $72,807 |
| College or Associate's Degree | $49,387 | $58,029 |
| Bachelor's Degree | $59,083 | $0 |
| Graduate Degree | $93,393 | $0 |
| Total | $60,281 | $59,808 |
Family Income in Harbor Hills
Family Income Brackets in Harbor Hills
According to the Harbor Hills family income data, there are 168 families falling into the $150,000 to $199,999 income range, which is the most common income bracket and makes up 34.2% of all families.
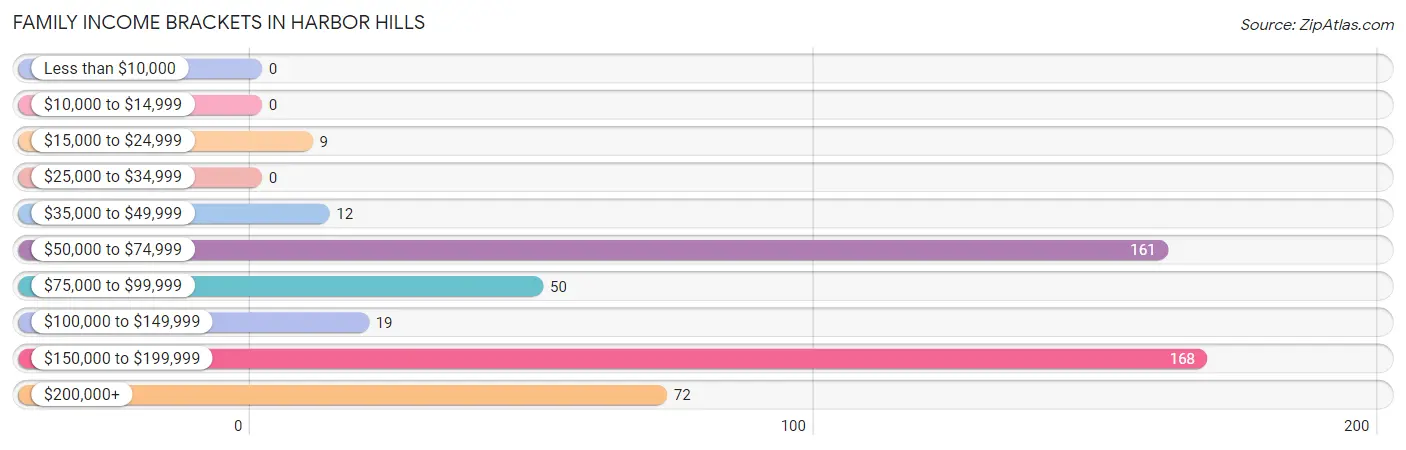
| Income Bracket | # Families | % Families |
| Less than $10,000 | 0 | 0.0% |
| $10,000 to $14,999 | 0 | 0.0% |
| $15,000 to $24,999 | 9 | 1.8% |
| $25,000 to $34,999 | 0 | 0.0% |
| $35,000 to $49,999 | 12 | 2.4% |
| $50,000 to $74,999 | 161 | 32.8% |
| $75,000 to $99,999 | 50 | 10.2% |
| $100,000 to $149,999 | 19 | 3.9% |
| $150,000 to $199,999 | 168 | 34.2% |
| $200,000+ | 72 | 14.7% |
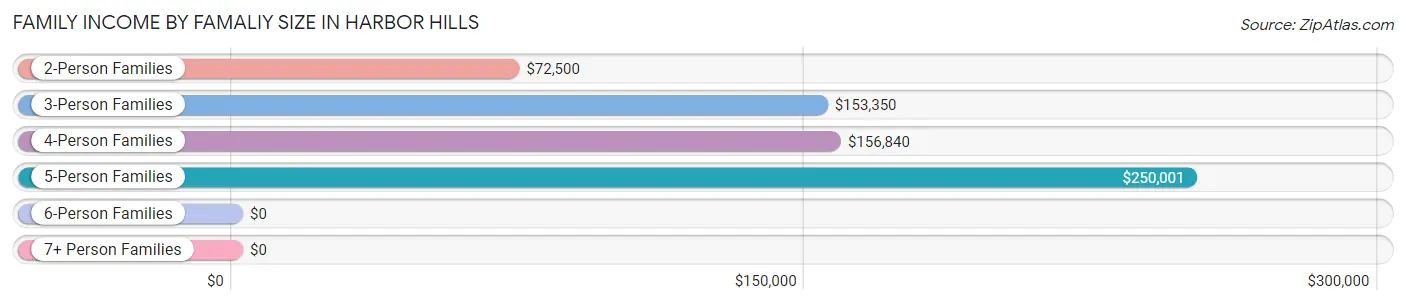
Family Income by Famaliy Size in Harbor Hills
5-person families (48 | 9.8%) account for the highest median family income in Harbor Hills with $250,001 per family, while 3-person families (65 | 13.2%) have the highest median income of $51,117 per family member.
| Income Bracket | # Families | Median Income |
| 2-Person Families | 284 (57.8%) | $72,500 |
| 3-Person Families | 65 (13.2%) | $153,350 |
| 4-Person Families | 94 (19.1%) | $156,840 |
| 5-Person Families | 48 (9.8%) | $250,001 |
| 6-Person Families | 0 (0.0%) | $0 |
| 7+ Person Families | 0 (0.0%) | $0 |
| Total | 491 (100.0%) | $115,781 |
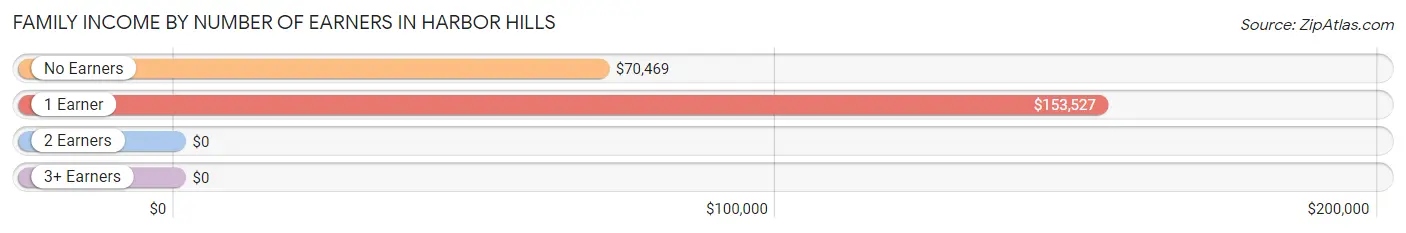
Family Income by Number of Earners in Harbor Hills
| Number of Earners | # Families | Median Income |
| No Earners | 111 (22.6%) | $70,469 |
| 1 Earner | 141 (28.7%) | $153,527 |
| 2 Earners | 161 (32.8%) | $0 |
| 3+ Earners | 78 (15.9%) | $0 |
| Total | 491 (100.0%) | $115,781 |
Household Income in Harbor Hills
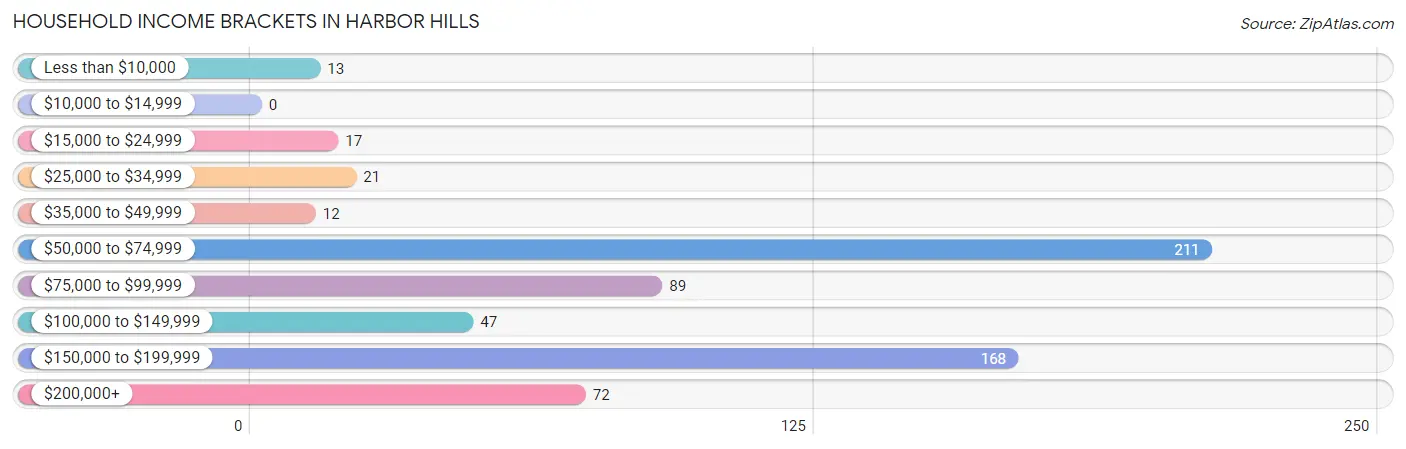
Household Income Brackets in Harbor Hills
With 211 households falling in the category, the $50,000 to $74,999 income range is the most frequent in Harbor Hills, accounting for 32.5% of all households.
| Income Bracket | # Households | % Households |
| Less than $10,000 | 13 | 2.0% |
| $10,000 to $14,999 | 0 | 0.0% |
| $15,000 to $24,999 | 17 | 2.6% |
| $25,000 to $34,999 | 21 | 3.2% |
| $35,000 to $49,999 | 12 | 1.8% |
| $50,000 to $74,999 | 211 | 32.5% |
| $75,000 to $99,999 | 89 | 13.7% |
| $100,000 to $149,999 | 47 | 7.2% |
| $150,000 to $199,999 | 168 | 25.8% |
| $200,000+ | 72 | 11.1% |
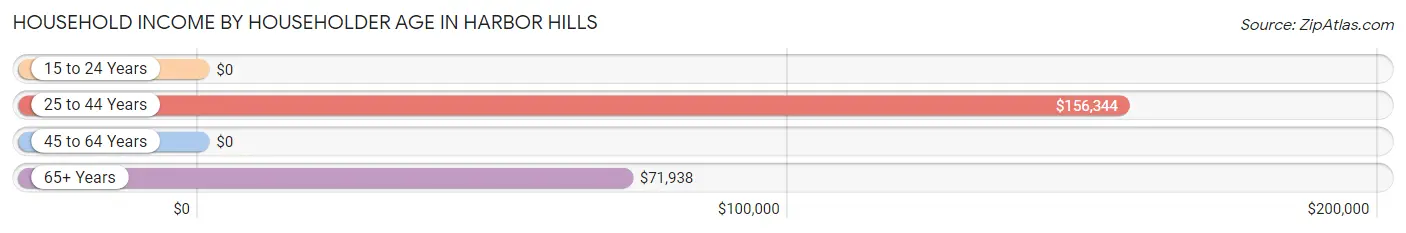
Household Income by Householder Age in Harbor Hills
The median household income in Harbor Hills is $79,423, with the highest median household income of $156,344 found in the 25 to 44 years age bracket for the primary householder. A total of 207 households (31.9%) fall into this category.
| Income Bracket | # Households | Median Income |
| 15 to 24 Years | 0 (0.0%) | $0 |
| 25 to 44 Years | 207 (31.9%) | $156,344 |
| 45 to 64 Years | 146 (22.5%) | $0 |
| 65+ Years | 297 (45.7%) | $71,938 |
| Total | 650 (100.0%) | $79,423 |
Poverty in Harbor Hills
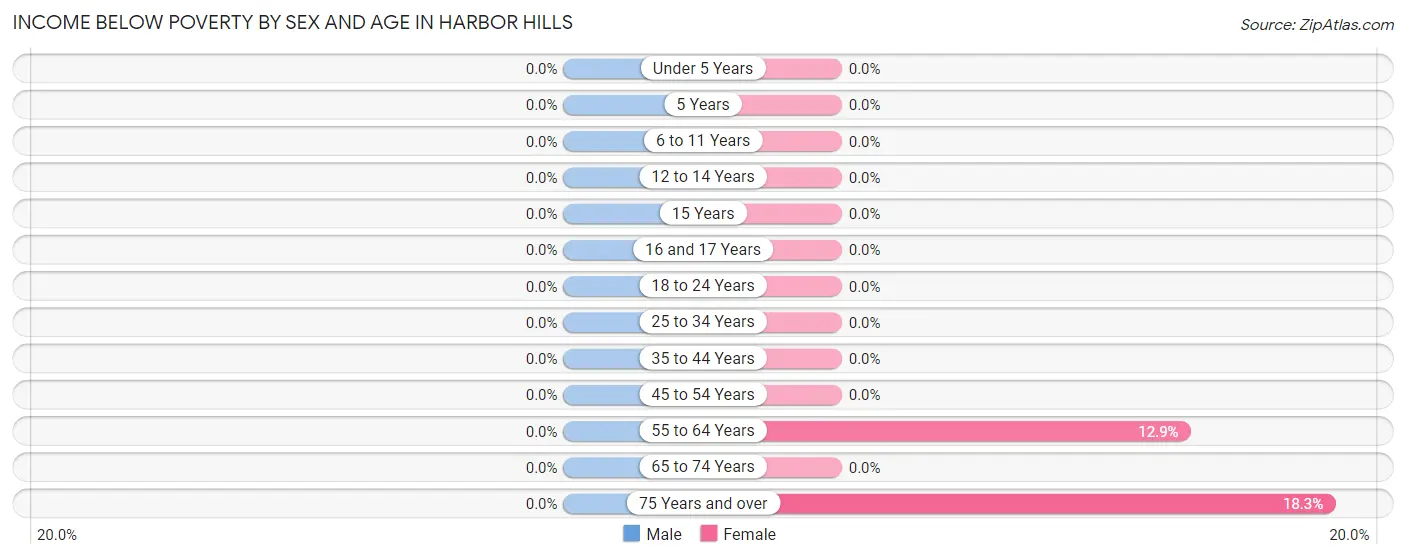
Income Below Poverty by Sex and Age in Harbor Hills
| Age Bracket | Male | Female |
| Under 5 Years | 0 (0.0%) | 0 (0.0%) |
| 5 Years | 0 (0.0%) | 0 (0.0%) |
| 6 to 11 Years | 0 (0.0%) | 0 (0.0%) |
| 12 to 14 Years | 0 (0.0%) | 0 (0.0%) |
| 15 Years | 0 (0.0%) | 0 (0.0%) |
| 16 and 17 Years | 0 (0.0%) | 0 (0.0%) |
| 18 to 24 Years | 0 (0.0%) | 0 (0.0%) |
| 25 to 34 Years | 0 (0.0%) | 0 (0.0%) |
| 35 to 44 Years | 0 (0.0%) | 0 (0.0%) |
| 45 to 54 Years | 0 (0.0%) | 0 (0.0%) |
| 55 to 64 Years | 0 (0.0%) | 22 (12.9%) |
| 65 to 74 Years | 0 (0.0%) | 0 (0.0%) |
| 75 Years and over | 0 (0.0%) | 13 (18.3%) |
| Total | 0 (0.0%) | 35 (4.2%) |
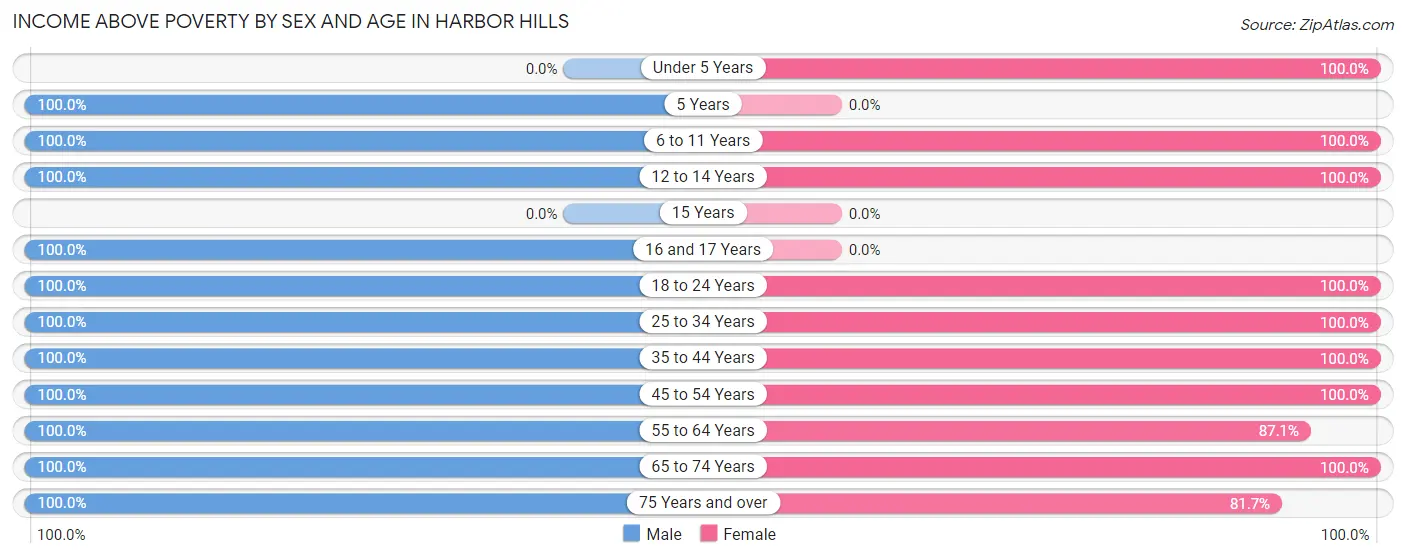
Income Above Poverty by Sex and Age in Harbor Hills
According to the poverty statistics in Harbor Hills, males aged 5 years and females aged under 5 years are the age groups that are most secure financially, with 100.0% of males and 100.0% of females in these age groups living above the poverty line.
| Age Bracket | Male | Female |
| Under 5 Years | 0 (0.0%) | 34 (100.0%) |
| 5 Years | 18 (100.0%) | 0 (0.0%) |
| 6 to 11 Years | 93 (100.0%) | 101 (100.0%) |
| 12 to 14 Years | 28 (100.0%) | 54 (100.0%) |
| 15 Years | 0 (0.0%) | 0 (0.0%) |
| 16 and 17 Years | 16 (100.0%) | 0 (0.0%) |
| 18 to 24 Years | 86 (100.0%) | 49 (100.0%) |
| 25 to 34 Years | 55 (100.0%) | 56 (100.0%) |
| 35 to 44 Years | 145 (100.0%) | 145 (100.0%) |
| 45 to 54 Years | 46 (100.0%) | 19 (100.0%) |
| 55 to 64 Years | 63 (100.0%) | 148 (87.1%) |
| 65 to 74 Years | 150 (100.0%) | 139 (100.0%) |
| 75 Years and over | 97 (100.0%) | 58 (81.7%) |
| Total | 797 (100.0%) | 803 (95.8%) |
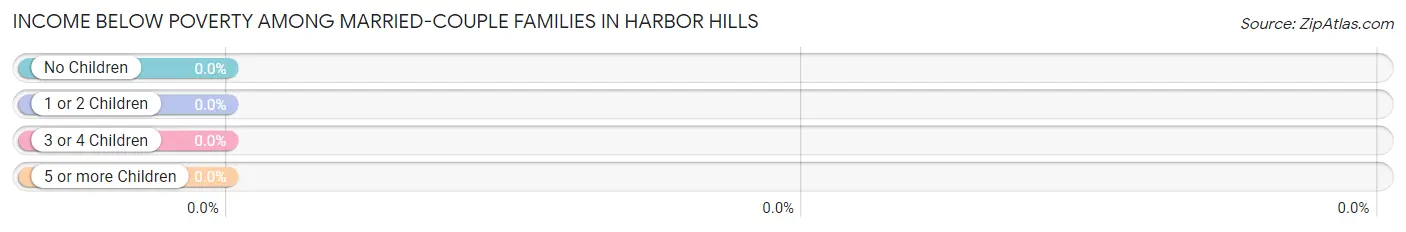
Income Below Poverty Among Married-Couple Families in Harbor Hills
| Children | Above Poverty | Below Poverty |
| No Children | 253 (100.0%) | 0 (0.0%) |
| 1 or 2 Children | 126 (100.0%) | 0 (0.0%) |
| 3 or 4 Children | 48 (100.0%) | 0 (0.0%) |
| 5 or more Children | 0 (0.0%) | 0 (0.0%) |
| Total | 427 (100.0%) | 0 (0.0%) |
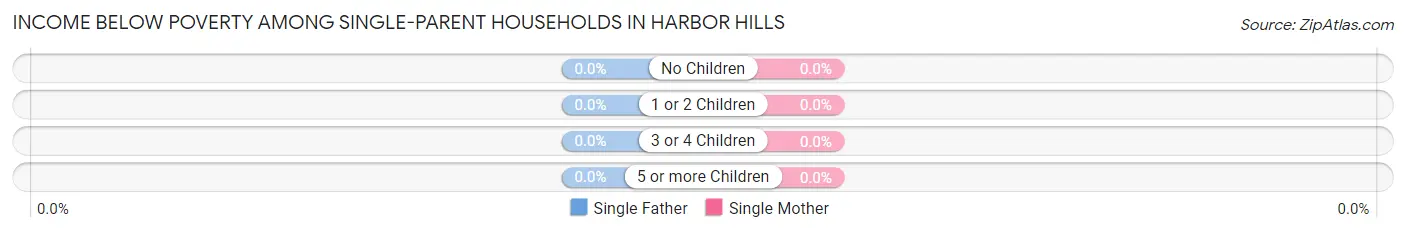
Income Below Poverty Among Single-Parent Households in Harbor Hills
| Children | Single Father | Single Mother |
| No Children | 0 (0.0%) | 0 (0.0%) |
| 1 or 2 Children | 0 (0.0%) | 0 (0.0%) |
| 3 or 4 Children | 0 (0.0%) | 0 (0.0%) |
| 5 or more Children | 0 (0.0%) | 0 (0.0%) |
| Total | 0 (0.0%) | 0 (0.0%) |
Income Below Poverty Among Married-Couple vs Single-Parent Households in Harbor Hills
| Children | Married-Couple Families | Single-Parent Households |
| No Children | 0 (0.0%) | 0 (0.0%) |
| 1 or 2 Children | 0 (0.0%) | 0 (0.0%) |
| 3 or 4 Children | 0 (0.0%) | 0 (0.0%) |
| 5 or more Children | 0 (0.0%) | 0 (0.0%) |
| Total | 0 (0.0%) | 0 (0.0%) |
Employment Characteristics in Harbor Hills
Employment by Class of Employer in Harbor Hills
Among the 774 employed individuals in Harbor Hills, private company employees (592 | 76.5%), self-employed (incorporated) (60 | 7.7%), and not-for-profit organizations (59 | 7.6%) make up the most common classes of employment.
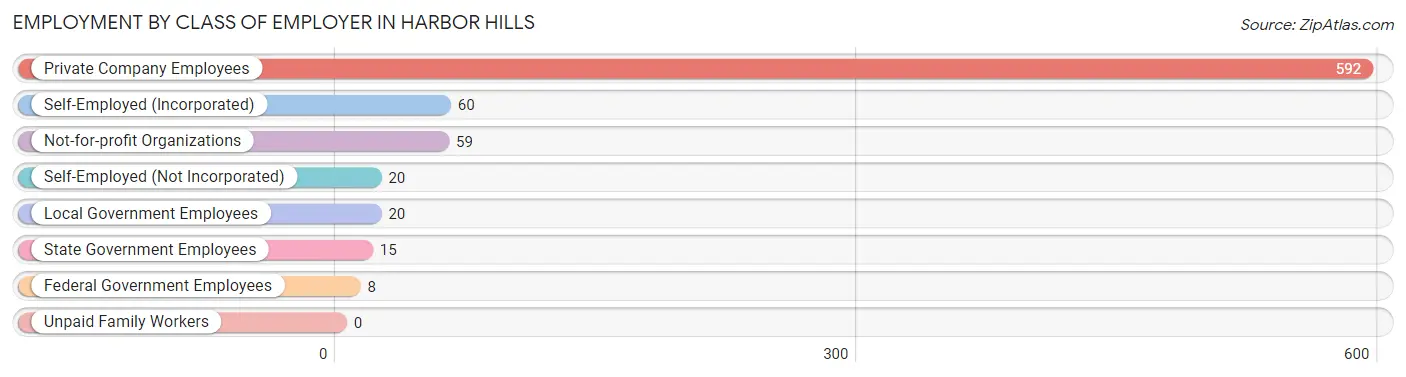
| Employer Class | # Employees | % Employees |
| Private Company Employees | 592 | 76.5% |
| Self-Employed (Incorporated) | 60 | 7.7% |
| Self-Employed (Not Incorporated) | 20 | 2.6% |
| Not-for-profit Organizations | 59 | 7.6% |
| Local Government Employees | 20 | 2.6% |
| State Government Employees | 15 | 1.9% |
| Federal Government Employees | 8 | 1.0% |
| Unpaid Family Workers | 0 | 0.0% |
| Total | 774 | 100.0% |
Employment Status by Age in Harbor Hills
According to the labor force statistics for Harbor Hills, out of the total population over 16 years of age (1,307), 61.1% or 799 individuals are in the labor force, with 3.0% or 24 of them unemployed. The age group with the highest labor force participation rate is 20 to 24 years, with 100.0% or 83 individuals in the labor force. Within the labor force, the 30 to 34 years age range has the highest percentage of unemployed individuals, with 48.0% or 24 of them being unemployed.
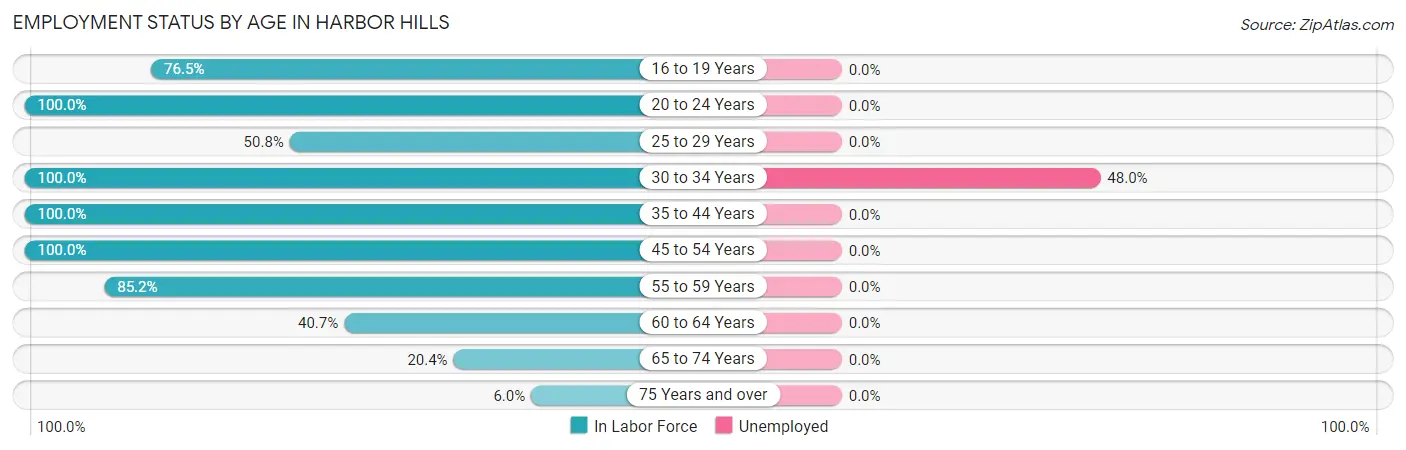
| Age Bracket | In Labor Force | Unemployed |
| 16 to 19 Years | 52 (76.5%) | 0 (0.0%) |
| 20 to 24 Years | 83 (100.0%) | 0 (0.0%) |
| 25 to 29 Years | 31 (50.8%) | 0 (0.0%) |
| 30 to 34 Years | 50 (100.0%) | 24 (48.0%) |
| 35 to 44 Years | 290 (100.0%) | 0 (0.0%) |
| 45 to 54 Years | 65 (100.0%) | 0 (0.0%) |
| 55 to 59 Years | 121 (85.2%) | 0 (0.0%) |
| 60 to 64 Years | 37 (40.7%) | 0 (0.0%) |
| 65 to 74 Years | 59 (20.4%) | 0 (0.0%) |
| 75 Years and over | 10 (6.0%) | 0 (0.0%) |
| Total | 799 (61.1%) | 24 (3.0%) |
Employment Status by Educational Attainment in Harbor Hills
According to labor force statistics for Harbor Hills, 85.0% of individuals (594) out of the total population between 25 and 64 years of age (699) are in the labor force, with 4.0% or 24 of them being unemployed. The group with the highest labor force participation rate are those with the educational attainment of bachelor's degree or higher, with 96.1% or 270 individuals in the labor force. Within the labor force, individuals with high school diploma education have the highest percentage of unemployment, with 15.5% or 24 of them being unemployed.
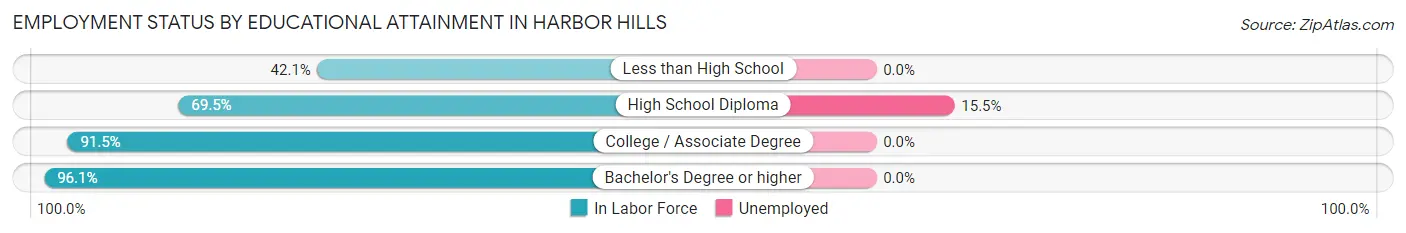
| Educational Attainment | In Labor Force | Unemployed |
| Less than High School | 8 (42.1%) | 0 (0.0%) |
| High School Diploma | 155 (69.5%) | 35 (15.5%) |
| College / Associate Degree | 161 (91.5%) | 0 (0.0%) |
| Bachelor's Degree or higher | 270 (96.1%) | 0 (0.0%) |
| Total | 594 (85.0%) | 28 (4.0%) |
Employment Occupations by Sex in Harbor Hills
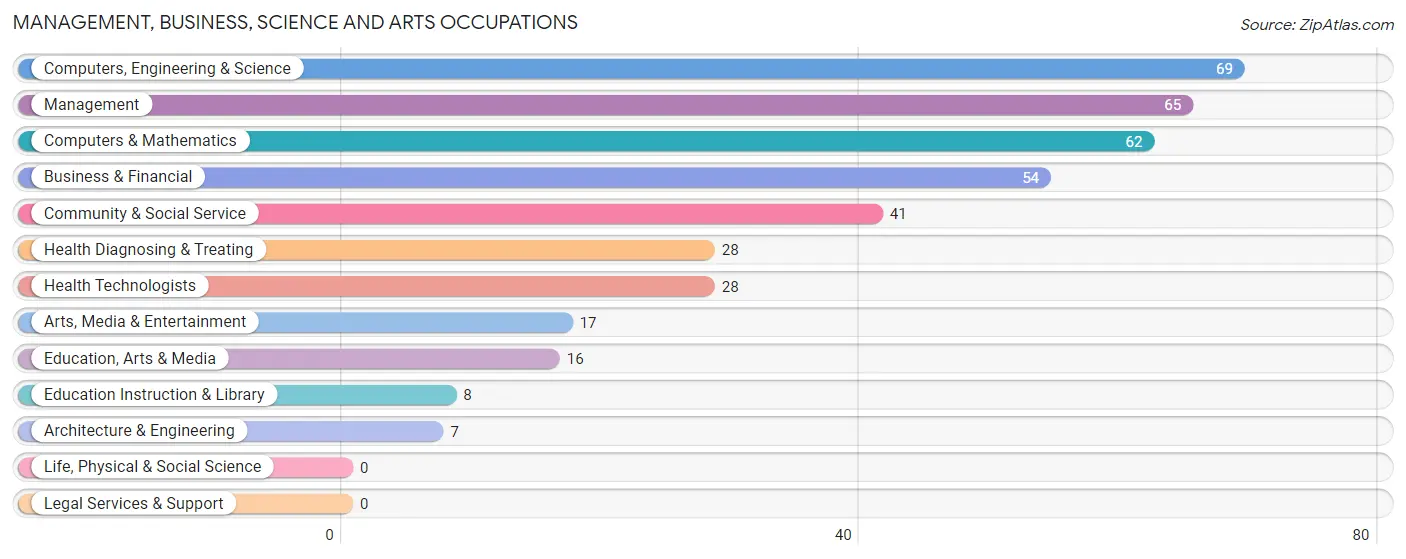
Management, Business, Science and Arts Occupations
The most common Management, Business, Science and Arts occupations in Harbor Hills are Computers, Engineering & Science (69 | 8.9%), Management (65 | 8.4%), Computers & Mathematics (62 | 8.0%), Business & Financial (54 | 7.0%), and Community & Social Service (41 | 5.3%).
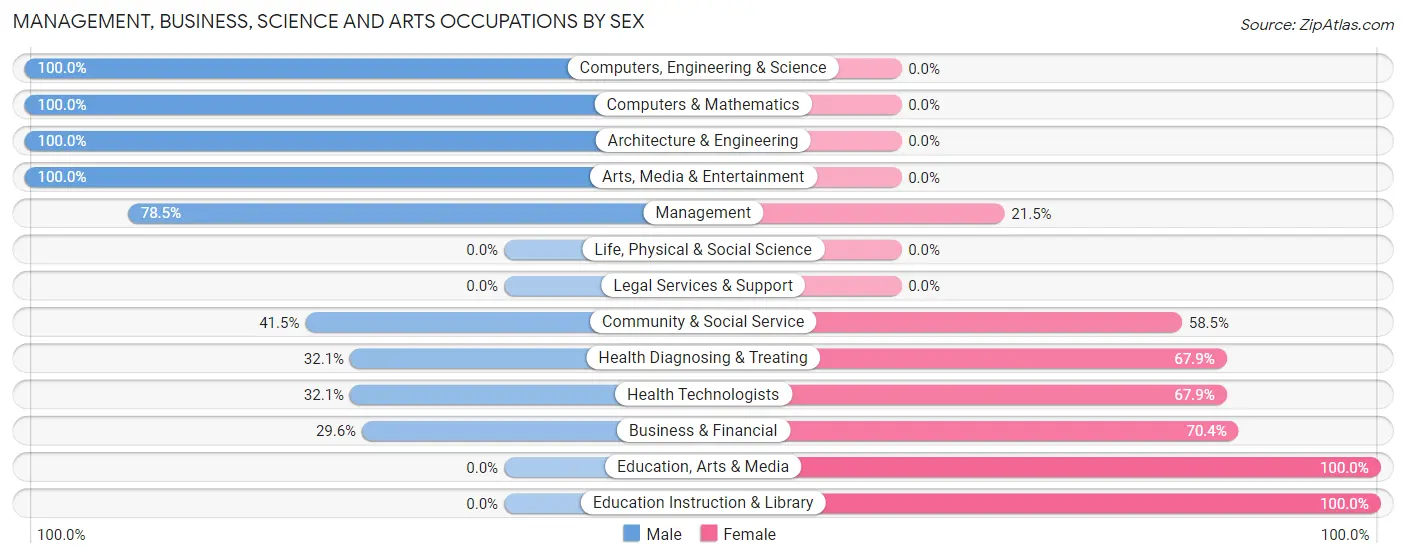
Management, Business, Science and Arts Occupations by Sex
Within the Management, Business, Science and Arts occupations in Harbor Hills, the most male-oriented occupations are Computers, Engineering & Science (100.0%), Computers & Mathematics (100.0%), and Architecture & Engineering (100.0%), while the most female-oriented occupations are Education, Arts & Media (100.0%), Education Instruction & Library (100.0%), and Business & Financial (70.4%).
| Occupation | Male | Female |
| Management | 51 (78.5%) | 14 (21.5%) |
| Business & Financial | 16 (29.6%) | 38 (70.4%) |
| Computers, Engineering & Science | 69 (100.0%) | 0 (0.0%) |
| Computers & Mathematics | 62 (100.0%) | 0 (0.0%) |
| Architecture & Engineering | 7 (100.0%) | 0 (0.0%) |
| Life, Physical & Social Science | 0 (0.0%) | 0 (0.0%) |
| Community & Social Service | 17 (41.5%) | 24 (58.5%) |
| Education, Arts & Media | 0 (0.0%) | 16 (100.0%) |
| Legal Services & Support | 0 (0.0%) | 0 (0.0%) |
| Education Instruction & Library | 0 (0.0%) | 8 (100.0%) |
| Arts, Media & Entertainment | 17 (100.0%) | 0 (0.0%) |
| Health Diagnosing & Treating | 9 (32.1%) | 19 (67.9%) |
| Health Technologists | 9 (32.1%) | 19 (67.9%) |
| Total (Category) | 162 (63.0%) | 95 (37.0%) |
| Total (Overall) | 421 (54.4%) | 353 (45.6%) |
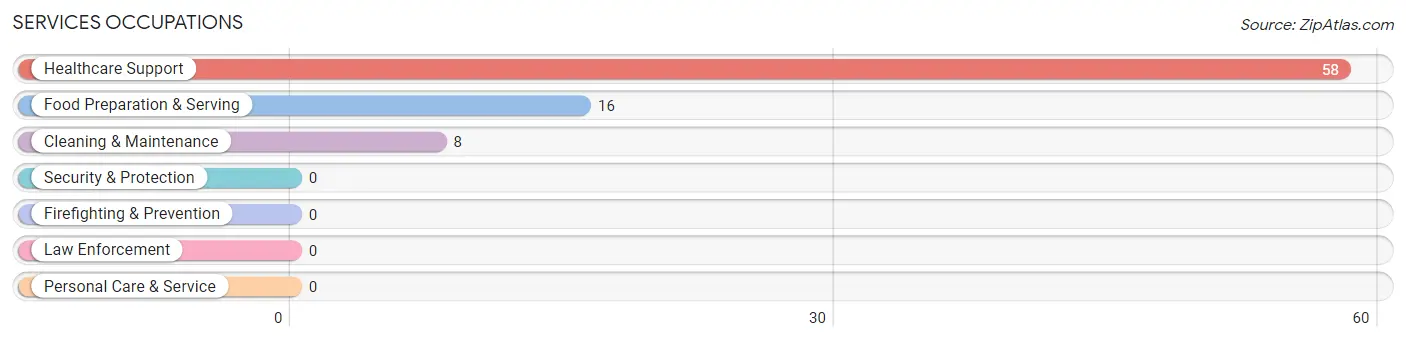
Services Occupations
The most common Services occupations in Harbor Hills are Healthcare Support (58 | 7.5%), Food Preparation & Serving (16 | 2.1%), and Cleaning & Maintenance (8 | 1.0%).
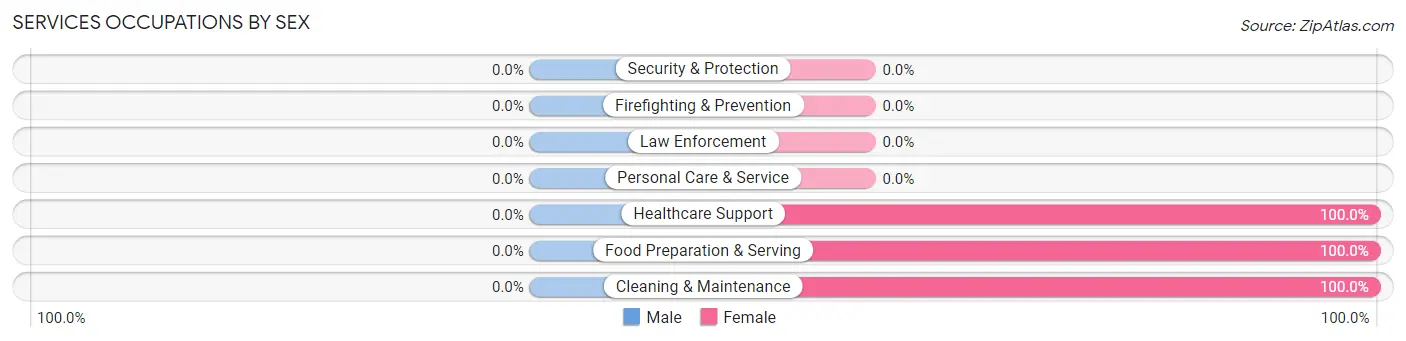
Services Occupations by Sex
| Occupation | Male | Female |
| Healthcare Support | 0 (0.0%) | 58 (100.0%) |
| Security & Protection | 0 (0.0%) | 0 (0.0%) |
| Firefighting & Prevention | 0 (0.0%) | 0 (0.0%) |
| Law Enforcement | 0 (0.0%) | 0 (0.0%) |
| Food Preparation & Serving | 0 (0.0%) | 16 (100.0%) |
| Cleaning & Maintenance | 0 (0.0%) | 8 (100.0%) |
| Personal Care & Service | 0 (0.0%) | 0 (0.0%) |
| Total (Category) | 0 (0.0%) | 82 (100.0%) |
| Total (Overall) | 421 (54.4%) | 353 (45.6%) |
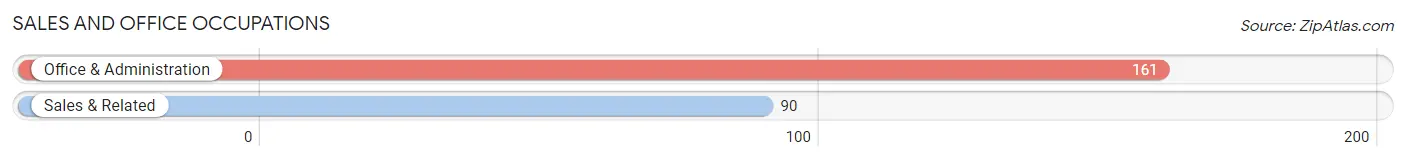
Sales and Office Occupations
The most common Sales and Office occupations in Harbor Hills are Office & Administration (161 | 20.8%), and Sales & Related (90 | 11.6%).
Sales and Office Occupations by Sex
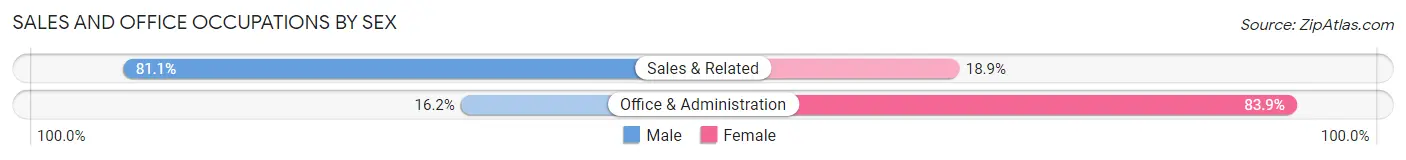
| Occupation | Male | Female |
| Sales & Related | 73 (81.1%) | 17 (18.9%) |
| Office & Administration | 26 (16.2%) | 135 (83.9%) |
| Total (Category) | 99 (39.4%) | 152 (60.6%) |
| Total (Overall) | 421 (54.4%) | 353 (45.6%) |
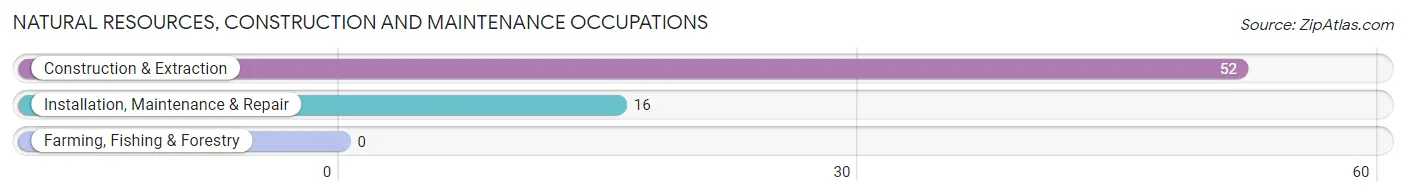
Natural Resources, Construction and Maintenance Occupations
The most common Natural Resources, Construction and Maintenance occupations in Harbor Hills are Construction & Extraction (52 | 6.7%), and Installation, Maintenance & Repair (16 | 2.1%).
Natural Resources, Construction and Maintenance Occupations by Sex
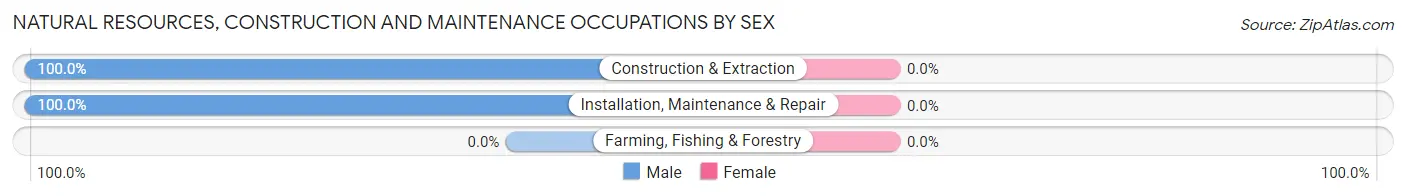
| Occupation | Male | Female |
| Farming, Fishing & Forestry | 0 (0.0%) | 0 (0.0%) |
| Construction & Extraction | 52 (100.0%) | 0 (0.0%) |
| Installation, Maintenance & Repair | 16 (100.0%) | 0 (0.0%) |
| Total (Category) | 68 (100.0%) | 0 (0.0%) |
| Total (Overall) | 421 (54.4%) | 353 (45.6%) |
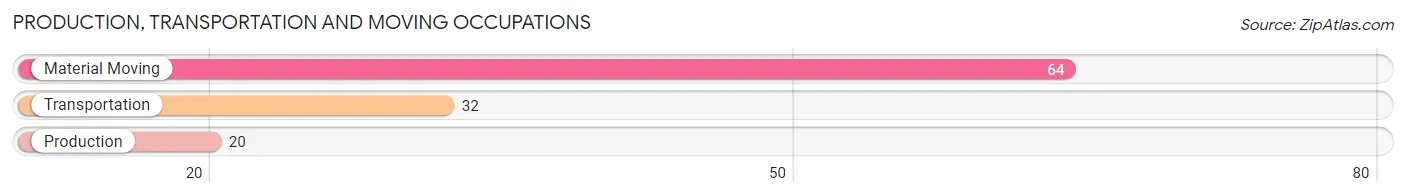
Production, Transportation and Moving Occupations
The most common Production, Transportation and Moving occupations in Harbor Hills are Material Moving (64 | 8.3%), Transportation (32 | 4.1%), and Production (20 | 2.6%).
Production, Transportation and Moving Occupations by Sex
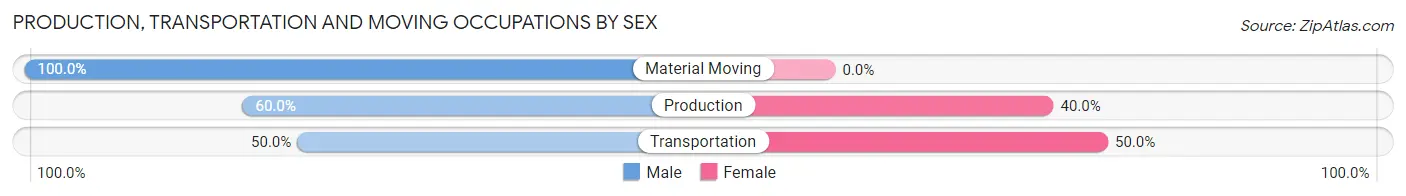
| Occupation | Male | Female |
| Production | 12 (60.0%) | 8 (40.0%) |
| Transportation | 16 (50.0%) | 16 (50.0%) |
| Material Moving | 64 (100.0%) | 0 (0.0%) |
| Total (Category) | 92 (79.3%) | 24 (20.7%) |
| Total (Overall) | 421 (54.4%) | 353 (45.6%) |
Employment Industries by Sex in Harbor Hills
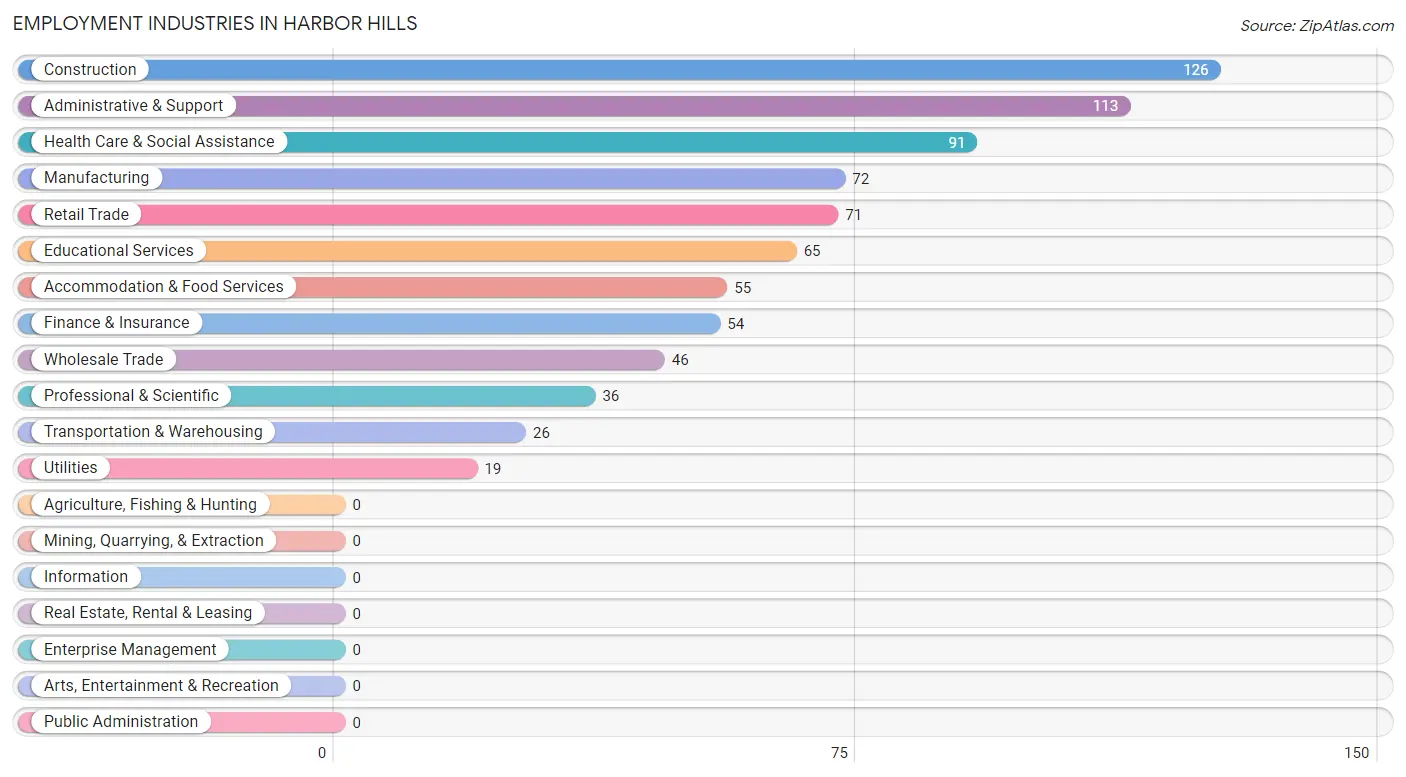
Employment Industries in Harbor Hills
The major employment industries in Harbor Hills include Construction (126 | 16.3%), Administrative & Support (113 | 14.6%), Health Care & Social Assistance (91 | 11.8%), Manufacturing (72 | 9.3%), and Retail Trade (71 | 9.2%).
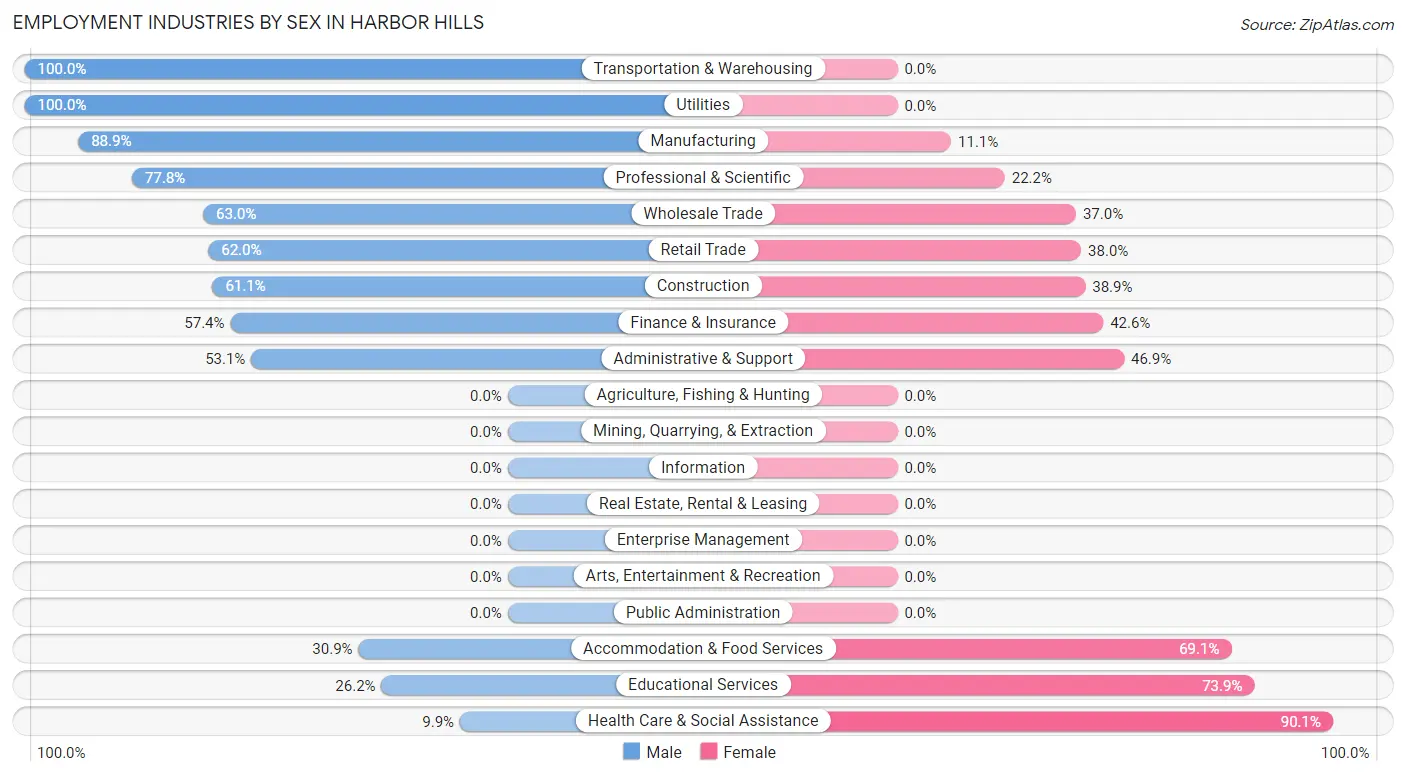
Employment Industries by Sex in Harbor Hills
The Harbor Hills industries that see more men than women are Transportation & Warehousing (100.0%), Utilities (100.0%), and Manufacturing (88.9%), whereas the industries that tend to have a higher number of women are Health Care & Social Assistance (90.1%), Educational Services (73.9%), and Accommodation & Food Services (69.1%).
| Industry | Male | Female |
| Agriculture, Fishing & Hunting | 0 (0.0%) | 0 (0.0%) |
| Mining, Quarrying, & Extraction | 0 (0.0%) | 0 (0.0%) |
| Construction | 77 (61.1%) | 49 (38.9%) |
| Manufacturing | 64 (88.9%) | 8 (11.1%) |
| Wholesale Trade | 29 (63.0%) | 17 (37.0%) |
| Retail Trade | 44 (62.0%) | 27 (38.0%) |
| Transportation & Warehousing | 26 (100.0%) | 0 (0.0%) |
| Utilities | 19 (100.0%) | 0 (0.0%) |
| Information | 0 (0.0%) | 0 (0.0%) |
| Finance & Insurance | 31 (57.4%) | 23 (42.6%) |
| Real Estate, Rental & Leasing | 0 (0.0%) | 0 (0.0%) |
| Professional & Scientific | 28 (77.8%) | 8 (22.2%) |
| Enterprise Management | 0 (0.0%) | 0 (0.0%) |
| Administrative & Support | 60 (53.1%) | 53 (46.9%) |
| Educational Services | 17 (26.2%) | 48 (73.9%) |
| Health Care & Social Assistance | 9 (9.9%) | 82 (90.1%) |
| Arts, Entertainment & Recreation | 0 (0.0%) | 0 (0.0%) |
| Accommodation & Food Services | 17 (30.9%) | 38 (69.1%) |
| Public Administration | 0 (0.0%) | 0 (0.0%) |
| Total | 421 (54.4%) | 353 (45.6%) |
Education in Harbor Hills
School Enrollment in Harbor Hills
The most common levels of schooling among the 420 students in Harbor Hills are elementary school (183 | 43.6%), middle school (82 | 19.5%), and high school (77 | 18.3%).
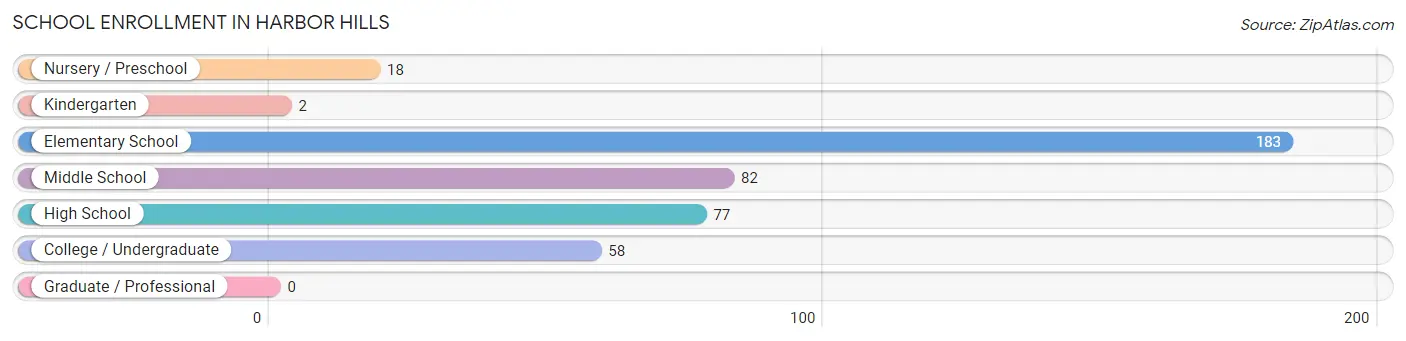
| School Level | # Students | % Students |
| Nursery / Preschool | 18 | 4.3% |
| Kindergarten | 2 | 0.5% |
| Elementary School | 183 | 43.6% |
| Middle School | 82 | 19.5% |
| High School | 77 | 18.3% |
| College / Undergraduate | 58 | 13.8% |
| Graduate / Professional | 0 | 0.0% |
| Total | 420 | 100.0% |
School Enrollment by Age by Funding Source in Harbor Hills
Out of a total of 420 students who are enrolled in schools in Harbor Hills, 74 (17.6%) attend a private institution, while the remaining 346 (82.4%) are enrolled in public schools. The age group of 3 to 4 year olds has the highest likelihood of being enrolled in private schools, with 18 (100.0% in the age bracket) enrolled. Conversely, the age group of 15 to 17 year olds has the lowest likelihood of being enrolled in a private school, with 16 (100.0% in the age bracket) attending a public institution.
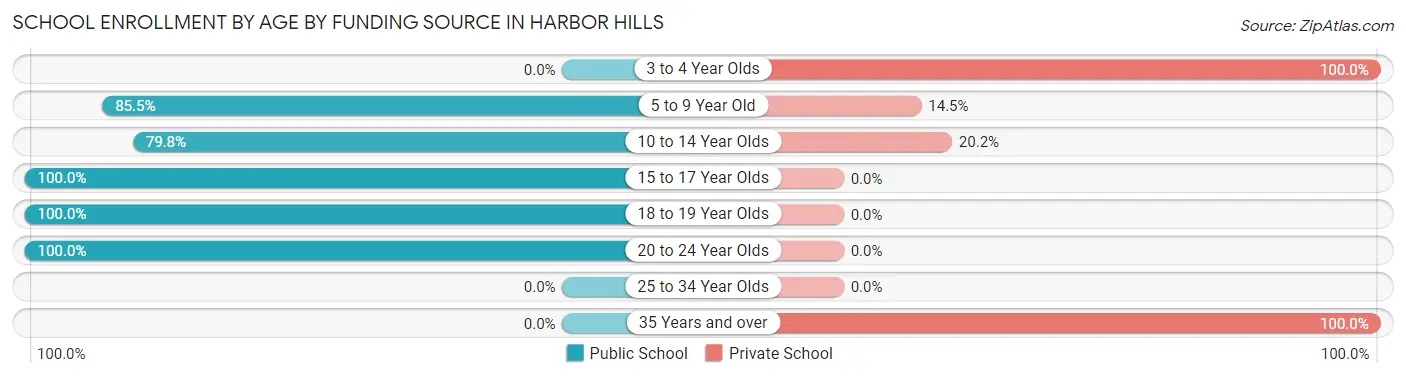
| Age Bracket | Public School | Private School |
| 3 to 4 Year Olds | 0 (0.0%) | 18 (100.0%) |
| 5 to 9 Year Old | 130 (85.5%) | 22 (14.5%) |
| 10 to 14 Year Olds | 99 (79.8%) | 25 (20.2%) |
| 15 to 17 Year Olds | 16 (100.0%) | 0 (0.0%) |
| 18 to 19 Year Olds | 52 (100.0%) | 0 (0.0%) |
| 20 to 24 Year Olds | 49 (100.0%) | 0 (0.0%) |
| 25 to 34 Year Olds | 0 (0.0%) | 0 (0.0%) |
| 35 Years and over | 0 (0.0%) | 9 (100.0%) |
| Total | 346 (82.4%) | 74 (17.6%) |
Educational Attainment by Field of Study in Harbor Hills
Business (124 | 28.4%), science & technology (48 | 11.0%), social sciences (47 | 10.8%), visual & performing arts (37 | 8.5%), and arts & humanities (32 | 7.3%) are the most common fields of study among 437 individuals in Harbor Hills who have obtained a bachelor's degree or higher.
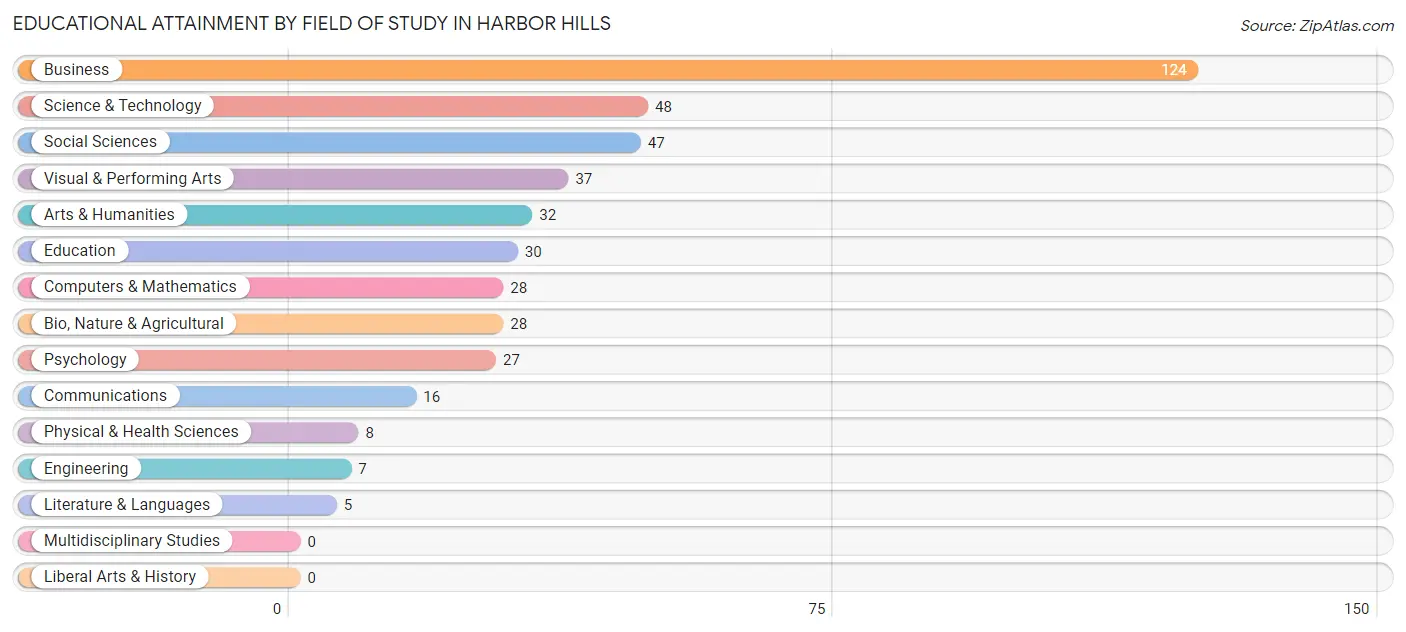
| Field of Study | # Graduates | % Graduates |
| Computers & Mathematics | 28 | 6.4% |
| Bio, Nature & Agricultural | 28 | 6.4% |
| Physical & Health Sciences | 8 | 1.8% |
| Psychology | 27 | 6.2% |
| Social Sciences | 47 | 10.8% |
| Engineering | 7 | 1.6% |
| Multidisciplinary Studies | 0 | 0.0% |
| Science & Technology | 48 | 11.0% |
| Business | 124 | 28.4% |
| Education | 30 | 6.9% |
| Literature & Languages | 5 | 1.1% |
| Liberal Arts & History | 0 | 0.0% |
| Visual & Performing Arts | 37 | 8.5% |
| Communications | 16 | 3.7% |
| Arts & Humanities | 32 | 7.3% |
| Total | 437 | 100.0% |
Transportation & Commute in Harbor Hills
Vehicle Availability by Sex in Harbor Hills
The most prevalent vehicle ownership categories in Harbor Hills are males with 3 vehicles (178, accounting for 42.3%) and females with 3 vehicles (100, making up 50.4%).
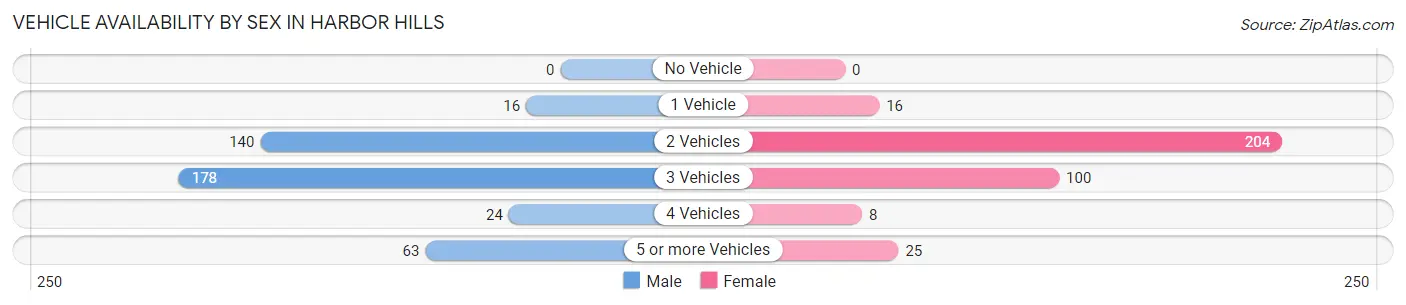
| Vehicles Available | Male | Female |
| No Vehicle | 0 (0.0%) | 0 (0.0%) |
| 1 Vehicle | 16 (3.8%) | 16 (4.5%) |
| 2 Vehicles | 140 (33.3%) | 204 (57.8%) |
| 3 Vehicles | 178 (42.3%) | 100 (28.3%) |
| 4 Vehicles | 24 (5.7%) | 8 (2.3%) |
| 5 or more Vehicles | 63 (15.0%) | 25 (7.1%) |
| Total | 421 (100.0%) | 353 (100.0%) |
Commute Time in Harbor Hills
The most frequently occuring commute durations in Harbor Hills are 20 to 24 minutes (152 commuters, 21.2%), 25 to 29 minutes (146 commuters, 20.4%), and 10 to 14 minutes (132 commuters, 18.4%).
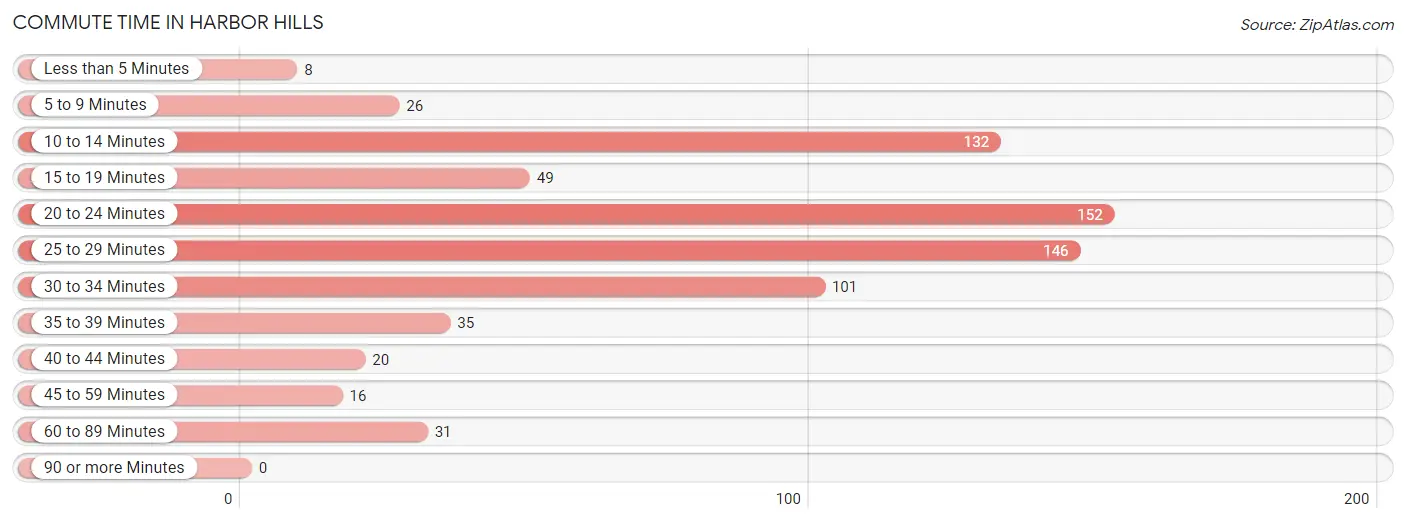
| Commute Time | # Commuters | % Commuters |
| Less than 5 Minutes | 8 | 1.1% |
| 5 to 9 Minutes | 26 | 3.6% |
| 10 to 14 Minutes | 132 | 18.4% |
| 15 to 19 Minutes | 49 | 6.8% |
| 20 to 24 Minutes | 152 | 21.2% |
| 25 to 29 Minutes | 146 | 20.4% |
| 30 to 34 Minutes | 101 | 14.1% |
| 35 to 39 Minutes | 35 | 4.9% |
| 40 to 44 Minutes | 20 | 2.8% |
| 45 to 59 Minutes | 16 | 2.2% |
| 60 to 89 Minutes | 31 | 4.3% |
| 90 or more Minutes | 0 | 0.0% |
Commute Time by Sex in Harbor Hills
The most common commute times in Harbor Hills are 20 to 24 minutes (89 commuters, 23.1%) for males and 10 to 14 minutes (109 commuters, 33.0%) for females.
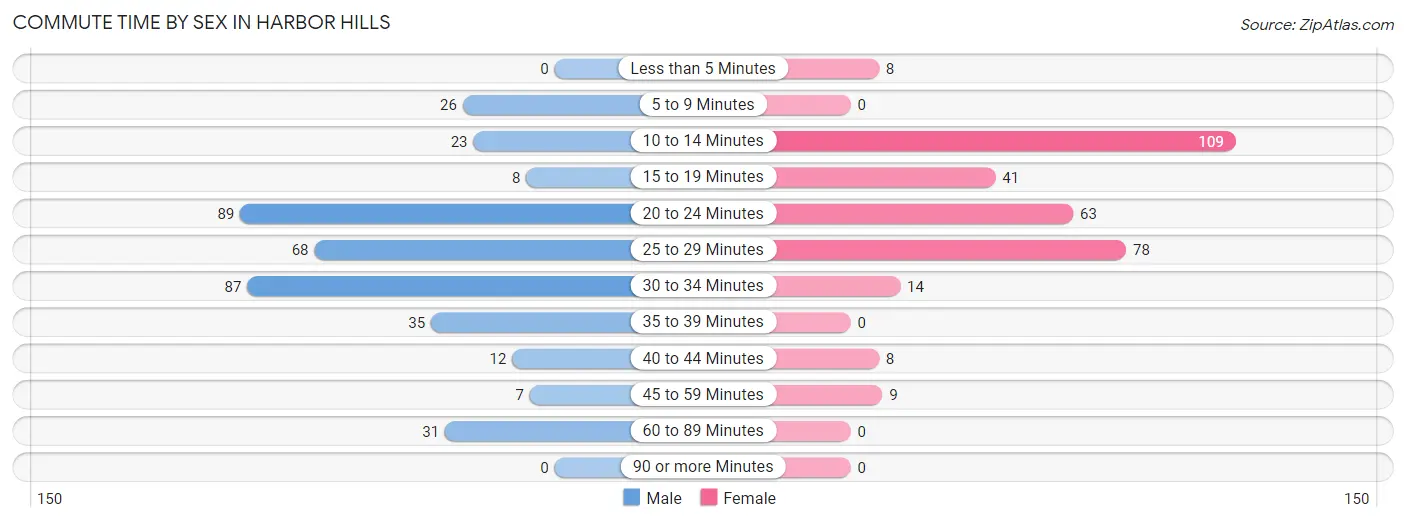
| Commute Time | Male | Female |
| Less than 5 Minutes | 0 (0.0%) | 8 (2.4%) |
| 5 to 9 Minutes | 26 (6.7%) | 0 (0.0%) |
| 10 to 14 Minutes | 23 (6.0%) | 109 (33.0%) |
| 15 to 19 Minutes | 8 (2.1%) | 41 (12.4%) |
| 20 to 24 Minutes | 89 (23.1%) | 63 (19.1%) |
| 25 to 29 Minutes | 68 (17.6%) | 78 (23.6%) |
| 30 to 34 Minutes | 87 (22.5%) | 14 (4.2%) |
| 35 to 39 Minutes | 35 (9.1%) | 0 (0.0%) |
| 40 to 44 Minutes | 12 (3.1%) | 8 (2.4%) |
| 45 to 59 Minutes | 7 (1.8%) | 9 (2.7%) |
| 60 to 89 Minutes | 31 (8.0%) | 0 (0.0%) |
| 90 or more Minutes | 0 (0.0%) | 0 (0.0%) |
Time of Departure to Work by Sex in Harbor Hills
The most frequent times of departure to work in Harbor Hills are 6:00 AM to 6:29 AM (105, 27.2%) for males and 8:30 AM to 8:59 AM (83, 25.2%) for females.
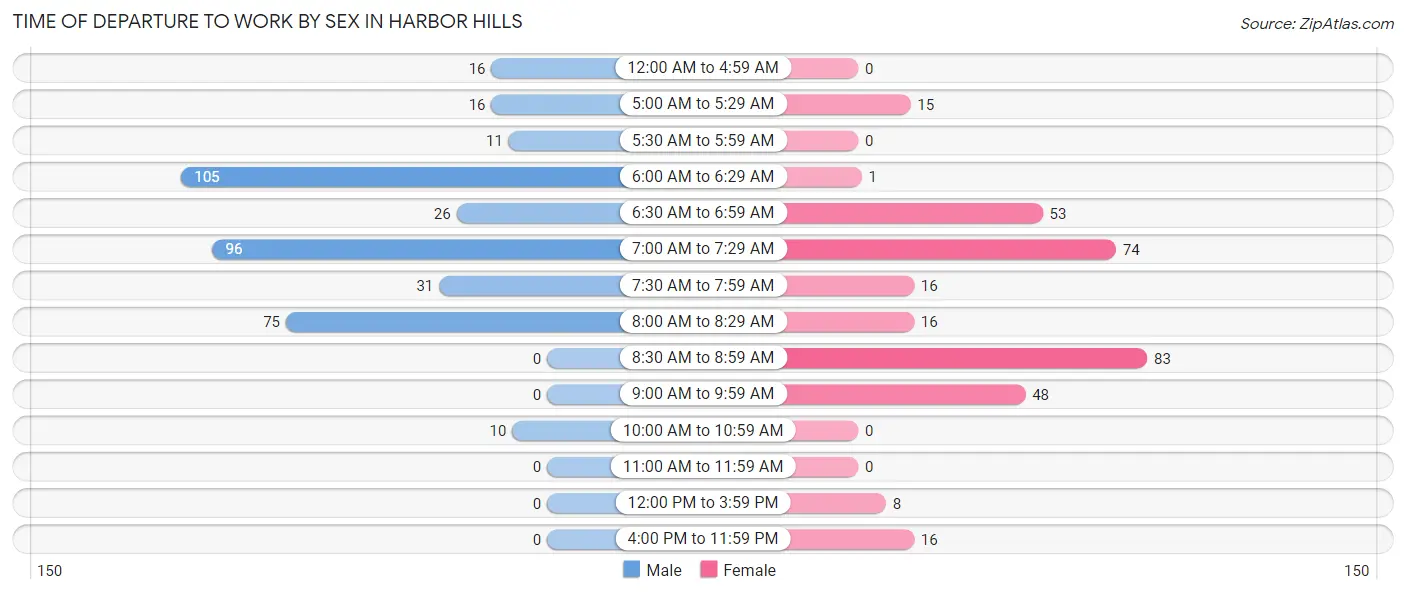
| Time of Departure | Male | Female |
| 12:00 AM to 4:59 AM | 16 (4.2%) | 0 (0.0%) |
| 5:00 AM to 5:29 AM | 16 (4.2%) | 15 (4.5%) |
| 5:30 AM to 5:59 AM | 11 (2.9%) | 0 (0.0%) |
| 6:00 AM to 6:29 AM | 105 (27.2%) | 1 (0.3%) |
| 6:30 AM to 6:59 AM | 26 (6.7%) | 53 (16.1%) |
| 7:00 AM to 7:29 AM | 96 (24.9%) | 74 (22.4%) |
| 7:30 AM to 7:59 AM | 31 (8.0%) | 16 (4.9%) |
| 8:00 AM to 8:29 AM | 75 (19.4%) | 16 (4.9%) |
| 8:30 AM to 8:59 AM | 0 (0.0%) | 83 (25.2%) |
| 9:00 AM to 9:59 AM | 0 (0.0%) | 48 (14.5%) |
| 10:00 AM to 10:59 AM | 10 (2.6%) | 0 (0.0%) |
| 11:00 AM to 11:59 AM | 0 (0.0%) | 0 (0.0%) |
| 12:00 PM to 3:59 PM | 0 (0.0%) | 8 (2.4%) |
| 4:00 PM to 11:59 PM | 0 (0.0%) | 16 (4.9%) |
| Total | 386 (100.0%) | 330 (100.0%) |
Housing Occupancy in Harbor Hills
Occupancy by Ownership in Harbor Hills
Of the total 650 dwellings in Harbor Hills, owner-occupied units account for 585 (90.0%), while renter-occupied units make up 65 (10.0%).
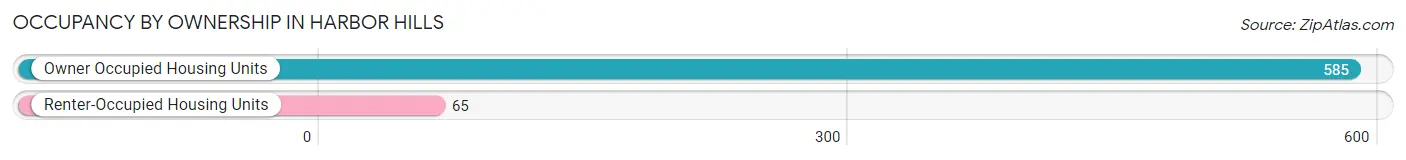
| Occupancy | # Housing Units | % Housing Units |
| Owner Occupied Housing Units | 585 | 90.0% |
| Renter-Occupied Housing Units | 65 | 10.0% |
| Total Occupied Housing Units | 650 | 100.0% |
Occupancy by Household Size in Harbor Hills
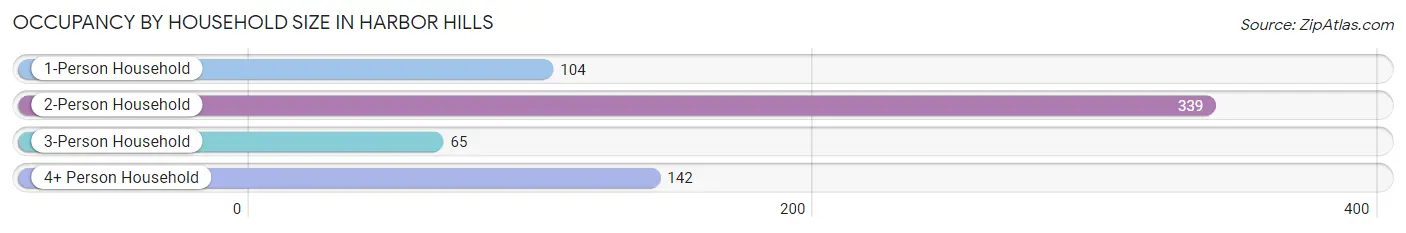
| Household Size | # Housing Units | % Housing Units |
| 1-Person Household | 104 | 16.0% |
| 2-Person Household | 339 | 52.1% |
| 3-Person Household | 65 | 10.0% |
| 4+ Person Household | 142 | 21.8% |
| Total Housing Units | 650 | 100.0% |
Occupancy by Ownership by Household Size in Harbor Hills
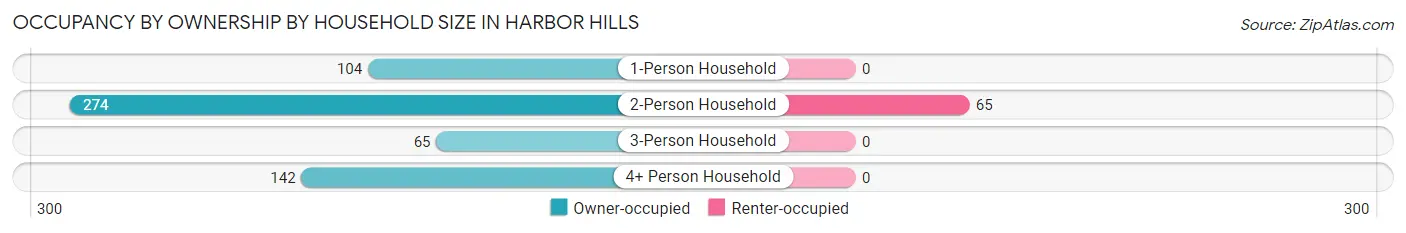
| Household Size | Owner-occupied | Renter-occupied |
| 1-Person Household | 104 (100.0%) | 0 (0.0%) |
| 2-Person Household | 274 (80.8%) | 65 (19.2%) |
| 3-Person Household | 65 (100.0%) | 0 (0.0%) |
| 4+ Person Household | 142 (100.0%) | 0 (0.0%) |
| Total Housing Units | 585 (90.0%) | 65 (10.0%) |
Occupancy by Educational Attainment in Harbor Hills
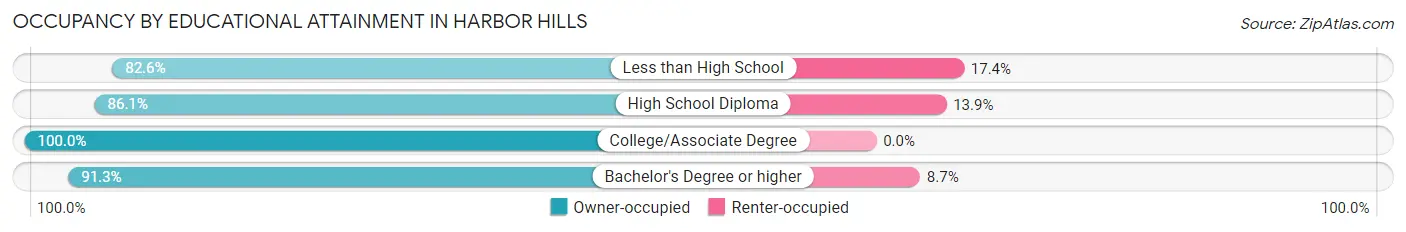
| Household Size | Owner-occupied | Renter-occupied |
| Less than High School | 19 (82.6%) | 4 (17.4%) |
| High School Diploma | 217 (86.1%) | 35 (13.9%) |
| College/Associate Degree | 75 (100.0%) | 0 (0.0%) |
| Bachelor's Degree or higher | 274 (91.3%) | 26 (8.7%) |
Occupancy by Age of Householder in Harbor Hills
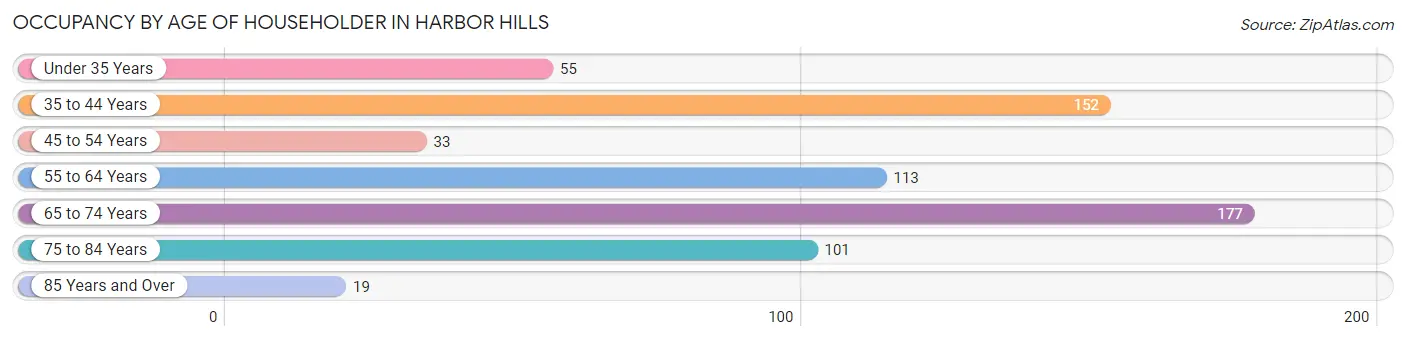
| Age Bracket | # Households | % Households |
| Under 35 Years | 55 | 8.5% |
| 35 to 44 Years | 152 | 23.4% |
| 45 to 54 Years | 33 | 5.1% |
| 55 to 64 Years | 113 | 17.4% |
| 65 to 74 Years | 177 | 27.2% |
| 75 to 84 Years | 101 | 15.5% |
| 85 Years and Over | 19 | 2.9% |
| Total | 650 | 100.0% |
Housing Finances in Harbor Hills
Median Income by Occupancy in Harbor Hills
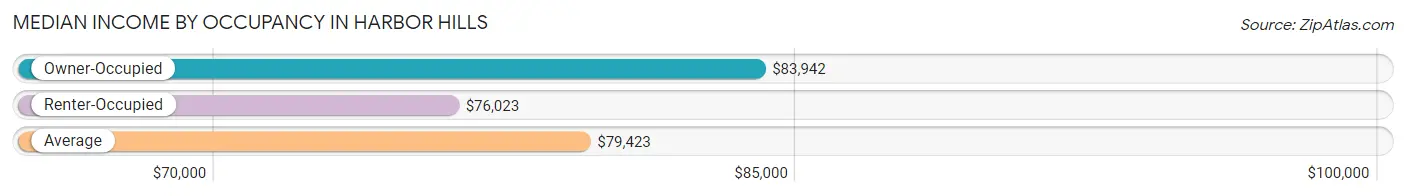
| Occupancy Type | # Households | Median Income |
| Owner-Occupied | 585 (90.0%) | $83,942 |
| Renter-Occupied | 65 (10.0%) | $76,023 |
| Average | 650 (100.0%) | $79,423 |
Occupancy by Householder Income Bracket in Harbor Hills
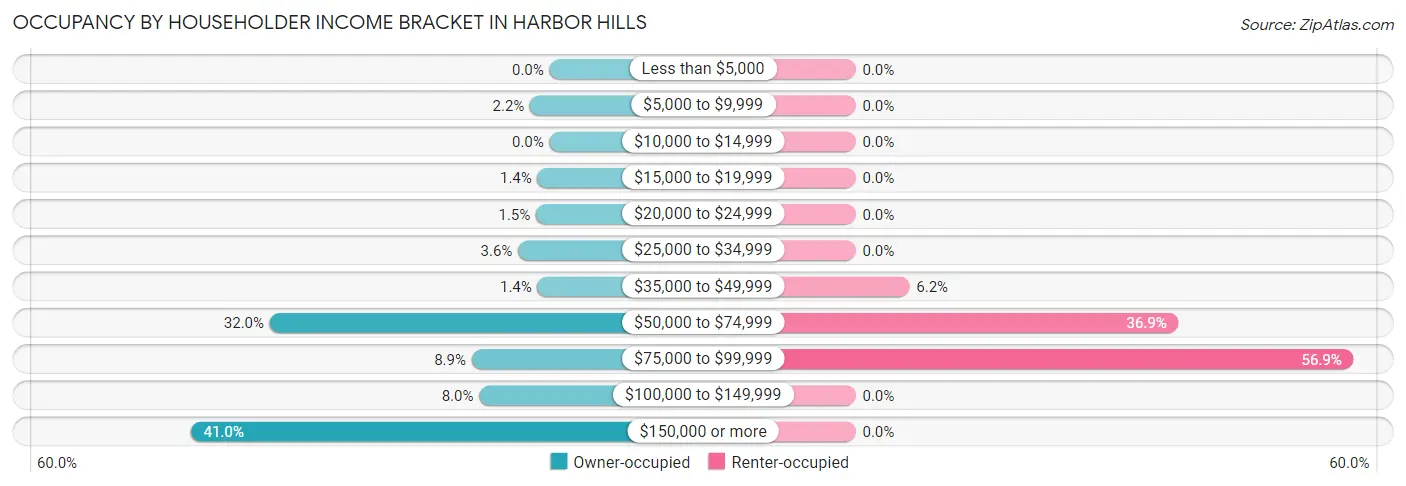
| Income Bracket | Owner-occupied | Renter-occupied |
| Less than $5,000 | 0 (0.0%) | 0 (0.0%) |
| $5,000 to $9,999 | 13 (2.2%) | 0 (0.0%) |
| $10,000 to $14,999 | 0 (0.0%) | 0 (0.0%) |
| $15,000 to $19,999 | 8 (1.4%) | 0 (0.0%) |
| $20,000 to $24,999 | 9 (1.5%) | 0 (0.0%) |
| $25,000 to $34,999 | 21 (3.6%) | 0 (0.0%) |
| $35,000 to $49,999 | 8 (1.4%) | 4 (6.1%) |
| $50,000 to $74,999 | 187 (32.0%) | 24 (36.9%) |
| $75,000 to $99,999 | 52 (8.9%) | 37 (56.9%) |
| $100,000 to $149,999 | 47 (8.0%) | 0 (0.0%) |
| $150,000 or more | 240 (41.0%) | 0 (0.0%) |
| Total | 585 (100.0%) | 65 (100.0%) |
Monthly Housing Cost Tiers in Harbor Hills
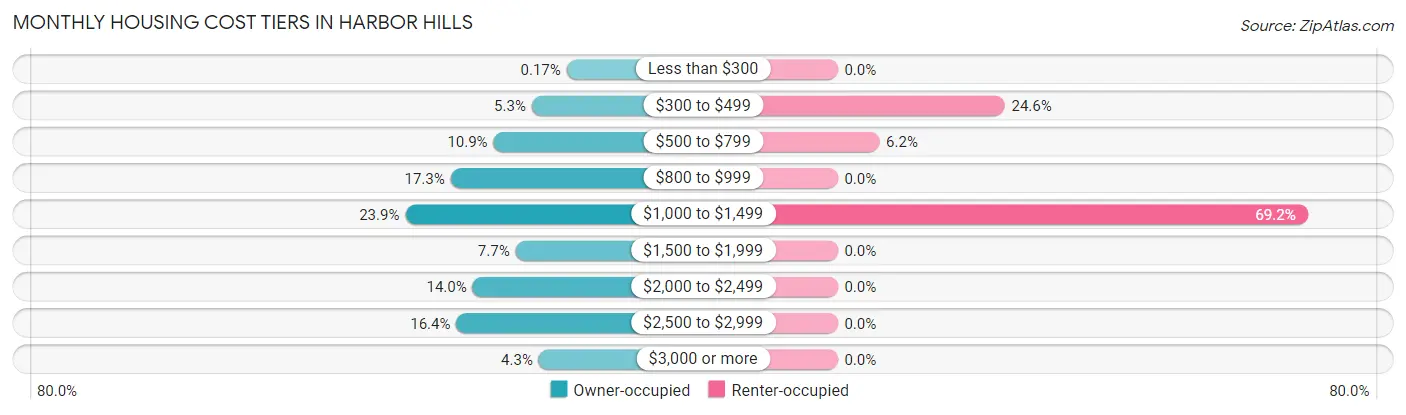
| Monthly Cost | Owner-occupied | Renter-occupied |
| Less than $300 | 1 (0.2%) | 0 (0.0%) |
| $300 to $499 | 31 (5.3%) | 16 (24.6%) |
| $500 to $799 | 64 (10.9%) | 4 (6.1%) |
| $800 to $999 | 101 (17.3%) | 0 (0.0%) |
| $1,000 to $1,499 | 140 (23.9%) | 45 (69.2%) |
| $1,500 to $1,999 | 45 (7.7%) | 0 (0.0%) |
| $2,000 to $2,499 | 82 (14.0%) | 0 (0.0%) |
| $2,500 to $2,999 | 96 (16.4%) | 0 (0.0%) |
| $3,000 or more | 25 (4.3%) | 0 (0.0%) |
| Total | 585 (100.0%) | 65 (100.0%) |
Physical Housing Characteristics in Harbor Hills
Housing Structures in Harbor Hills
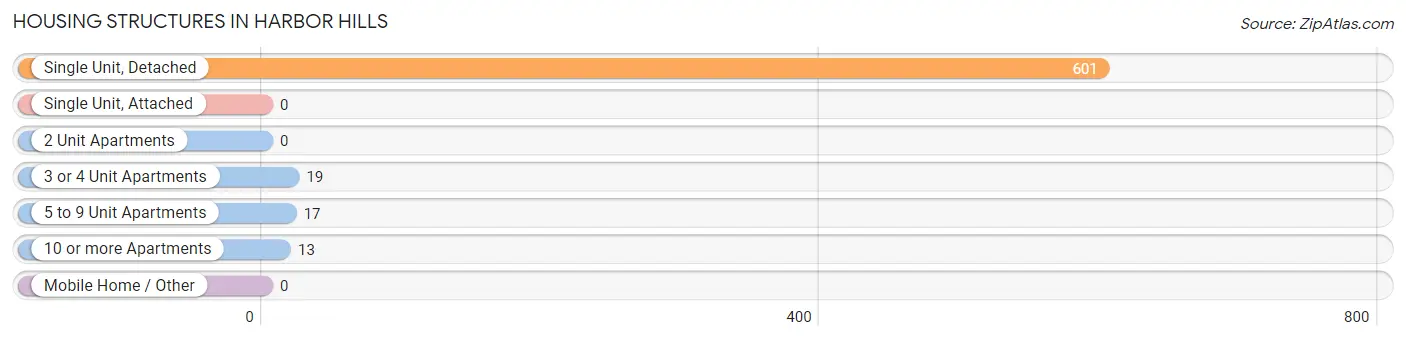
| Structure Type | # Housing Units | % Housing Units |
| Single Unit, Detached | 601 | 92.5% |
| Single Unit, Attached | 0 | 0.0% |
| 2 Unit Apartments | 0 | 0.0% |
| 3 or 4 Unit Apartments | 19 | 2.9% |
| 5 to 9 Unit Apartments | 17 | 2.6% |
| 10 or more Apartments | 13 | 2.0% |
| Mobile Home / Other | 0 | 0.0% |
| Total | 650 | 100.0% |
Housing Structures by Occupancy in Harbor Hills
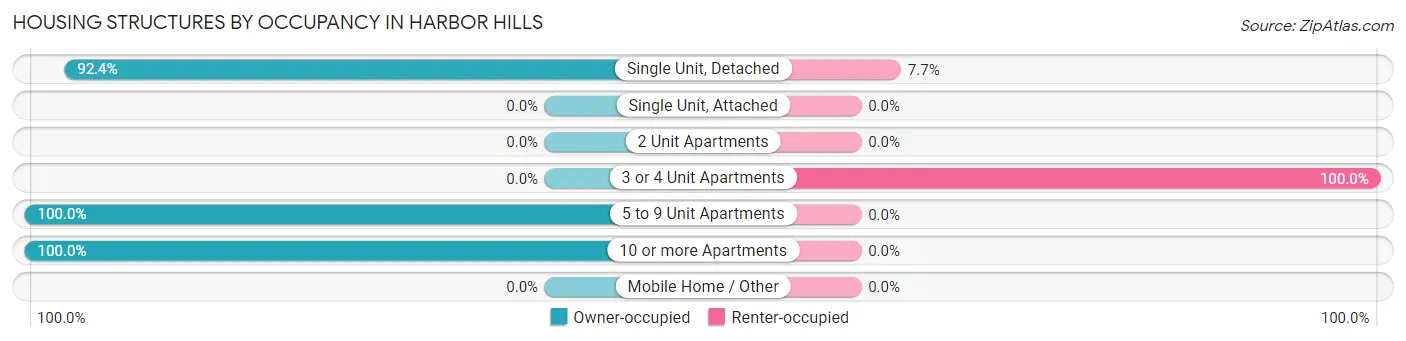
| Structure Type | Owner-occupied | Renter-occupied |
| Single Unit, Detached | 555 (92.3%) | 46 (7.6%) |
| Single Unit, Attached | 0 (0.0%) | 0 (0.0%) |
| 2 Unit Apartments | 0 (0.0%) | 0 (0.0%) |
| 3 or 4 Unit Apartments | 0 (0.0%) | 19 (100.0%) |
| 5 to 9 Unit Apartments | 17 (100.0%) | 0 (0.0%) |
| 10 or more Apartments | 13 (100.0%) | 0 (0.0%) |
| Mobile Home / Other | 0 (0.0%) | 0 (0.0%) |
| Total | 585 (90.0%) | 65 (10.0%) |
Housing Structures by Number of Rooms in Harbor Hills
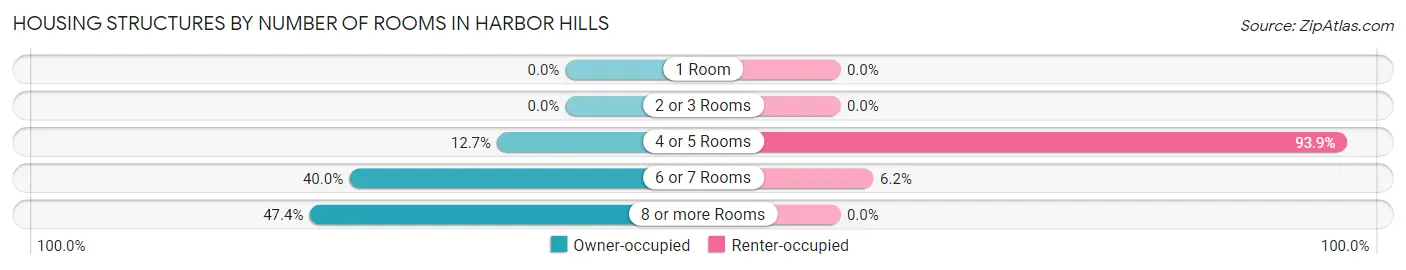
| Number of Rooms | Owner-occupied | Renter-occupied |
| 1 Room | 0 (0.0%) | 0 (0.0%) |
| 2 or 3 Rooms | 0 (0.0%) | 0 (0.0%) |
| 4 or 5 Rooms | 74 (12.7%) | 61 (93.9%) |
| 6 or 7 Rooms | 234 (40.0%) | 4 (6.1%) |
| 8 or more Rooms | 277 (47.3%) | 0 (0.0%) |
| Total | 585 (100.0%) | 65 (100.0%) |
Housing Structure by Heating Type in Harbor Hills
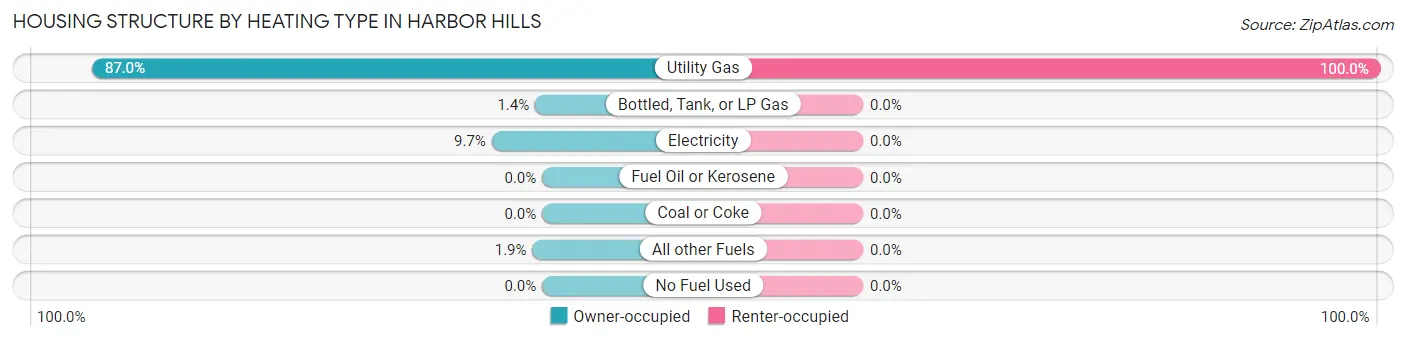
| Heating Type | Owner-occupied | Renter-occupied |
| Utility Gas | 509 (87.0%) | 65 (100.0%) |
| Bottled, Tank, or LP Gas | 8 (1.4%) | 0 (0.0%) |
| Electricity | 57 (9.7%) | 0 (0.0%) |
| Fuel Oil or Kerosene | 0 (0.0%) | 0 (0.0%) |
| Coal or Coke | 0 (0.0%) | 0 (0.0%) |
| All other Fuels | 11 (1.9%) | 0 (0.0%) |
| No Fuel Used | 0 (0.0%) | 0 (0.0%) |
| Total | 585 (100.0%) | 65 (100.0%) |
Household Vehicle Usage in Harbor Hills
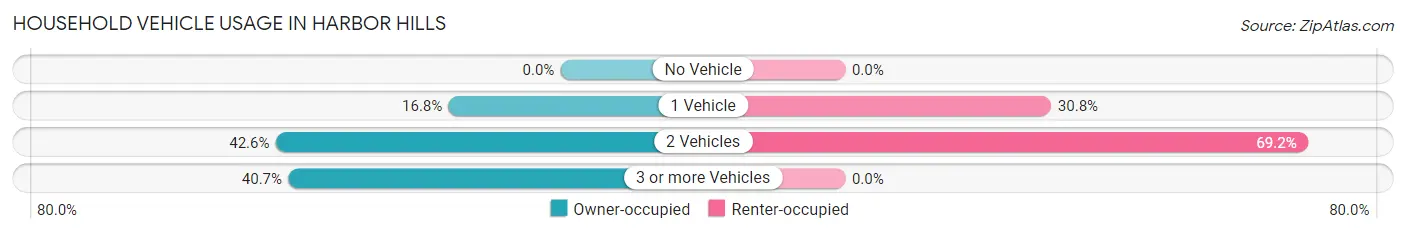
| Vehicles per Household | Owner-occupied | Renter-occupied |
| No Vehicle | 0 (0.0%) | 0 (0.0%) |
| 1 Vehicle | 98 (16.8%) | 20 (30.8%) |
| 2 Vehicles | 249 (42.6%) | 45 (69.2%) |
| 3 or more Vehicles | 238 (40.7%) | 0 (0.0%) |
| Total | 585 (100.0%) | 65 (100.0%) |
Real Estate & Mortgages in Harbor Hills
Real Estate and Mortgage Overview in Harbor Hills
| Characteristic | Without Mortgage | With Mortgage |
| Housing Units | 181 | 404 |
| Median Property Value | $427,900 | $407,500 |
| Median Household Income | $74,583 | $199 |
| Monthly Housing Costs | $792 | $25 |
| Real Estate Taxes | $5,552 | $0 |
Property Value by Mortgage Status in Harbor Hills
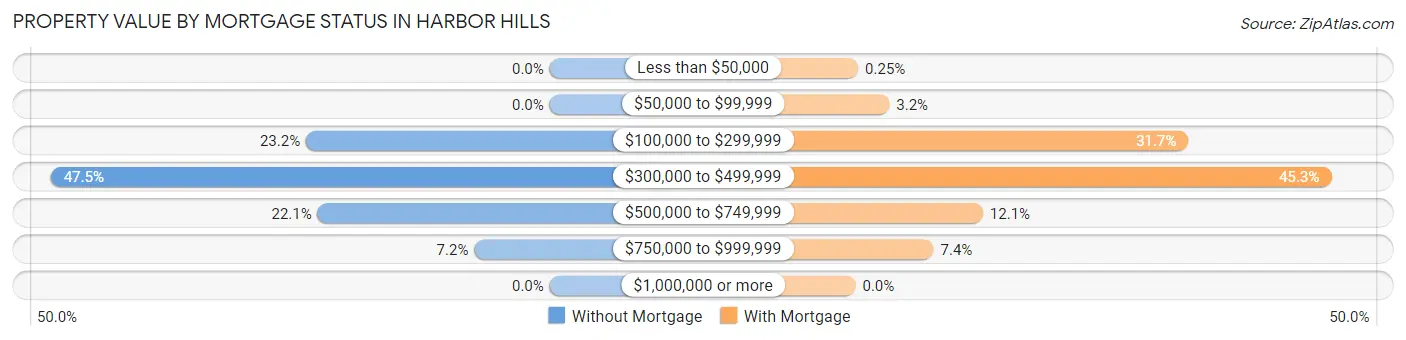
| Property Value | Without Mortgage | With Mortgage |
| Less than $50,000 | 0 (0.0%) | 1 (0.3%) |
| $50,000 to $99,999 | 0 (0.0%) | 13 (3.2%) |
| $100,000 to $299,999 | 42 (23.2%) | 128 (31.7%) |
| $300,000 to $499,999 | 86 (47.5%) | 183 (45.3%) |
| $500,000 to $749,999 | 40 (22.1%) | 49 (12.1%) |
| $750,000 to $999,999 | 13 (7.2%) | 30 (7.4%) |
| $1,000,000 or more | 0 (0.0%) | 0 (0.0%) |
| Total | 181 (100.0%) | 404 (100.0%) |
Household Income by Mortgage Status in Harbor Hills
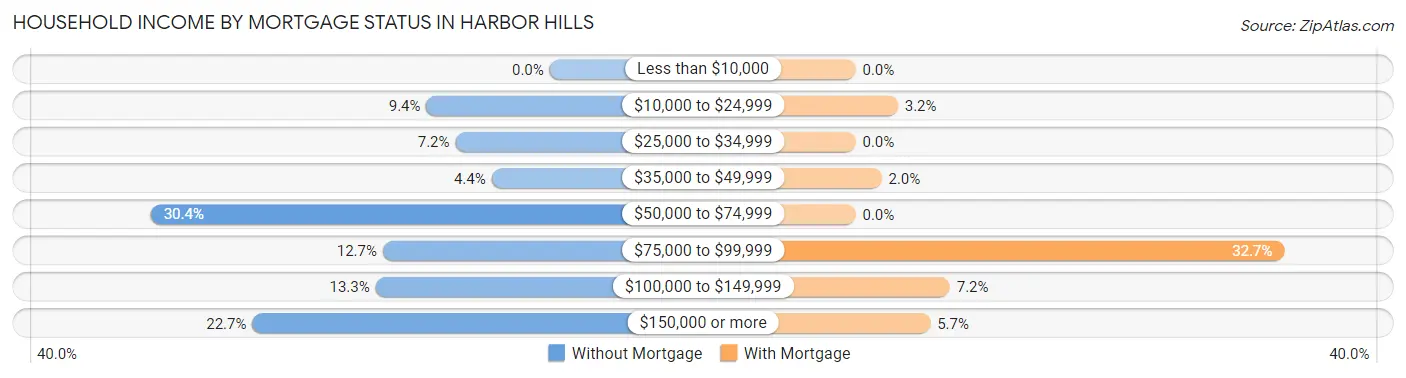
| Household Income | Without Mortgage | With Mortgage |
| Less than $10,000 | 0 (0.0%) | 0 (0.0%) |
| $10,000 to $24,999 | 17 (9.4%) | 13 (3.2%) |
| $25,000 to $34,999 | 13 (7.2%) | 0 (0.0%) |
| $35,000 to $49,999 | 8 (4.4%) | 8 (2.0%) |
| $50,000 to $74,999 | 55 (30.4%) | 0 (0.0%) |
| $75,000 to $99,999 | 23 (12.7%) | 132 (32.7%) |
| $100,000 to $149,999 | 24 (13.3%) | 29 (7.2%) |
| $150,000 or more | 41 (22.7%) | 23 (5.7%) |
| Total | 181 (100.0%) | 404 (100.0%) |
Property Value to Household Income Ratio in Harbor Hills
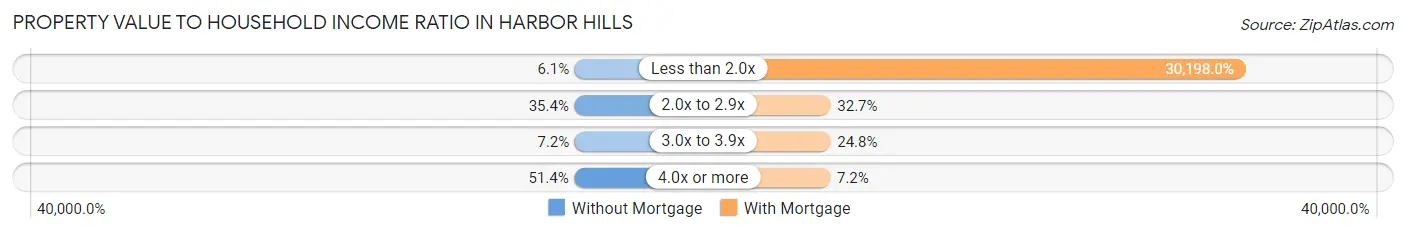
| Value-to-Income Ratio | Without Mortgage | With Mortgage |
| Less than 2.0x | 11 (6.1%) | 122,000 (30,198.0%) |
| 2.0x to 2.9x | 64 (35.4%) | 132 (32.7%) |
| 3.0x to 3.9x | 13 (7.2%) | 100 (24.7%) |
| 4.0x or more | 93 (51.4%) | 29 (7.2%) |
| Total | 181 (100.0%) | 404 (100.0%) |
Real Estate Taxes by Mortgage Status in Harbor Hills
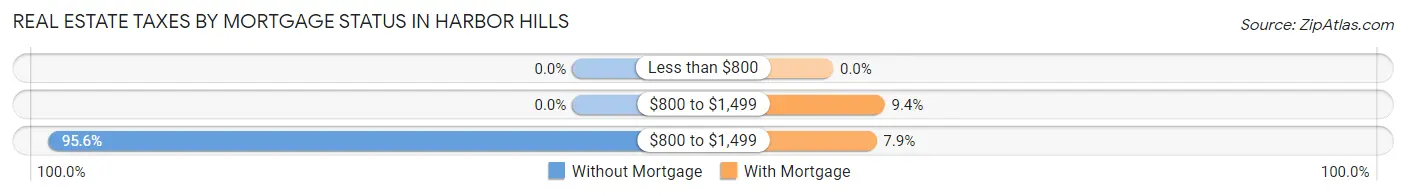
| Property Taxes | Without Mortgage | With Mortgage |
| Less than $800 | 0 (0.0%) | 0 (0.0%) |
| $800 to $1,499 | 0 (0.0%) | 38 (9.4%) |
| $800 to $1,499 | 173 (95.6%) | 32 (7.9%) |
| Total | 181 (100.0%) | 404 (100.0%) |
Health & Disability in Harbor Hills
Health Insurance Coverage by Age in Harbor Hills
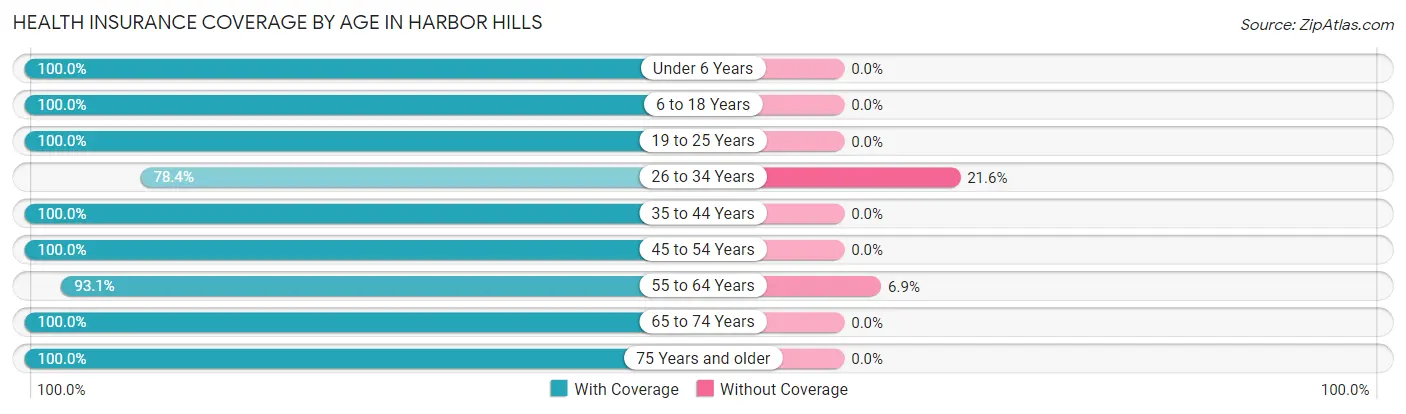
| Age Bracket | With Coverage | Without Coverage |
| Under 6 Years | 52 (100.0%) | 0 (0.0%) |
| 6 to 18 Years | 344 (100.0%) | 0 (0.0%) |
| 19 to 25 Years | 83 (100.0%) | 0 (0.0%) |
| 26 to 34 Years | 87 (78.4%) | 24 (21.6%) |
| 35 to 44 Years | 290 (100.0%) | 0 (0.0%) |
| 45 to 54 Years | 65 (100.0%) | 0 (0.0%) |
| 55 to 64 Years | 217 (93.1%) | 16 (6.9%) |
| 65 to 74 Years | 289 (100.0%) | 0 (0.0%) |
| 75 Years and older | 168 (100.0%) | 0 (0.0%) |
| Total | 1,595 (97.6%) | 40 (2.5%) |
Health Insurance Coverage by Citizenship Status in Harbor Hills
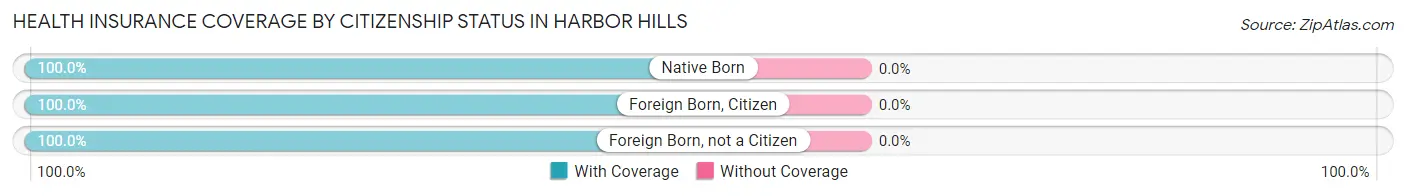
| Citizenship Status | With Coverage | Without Coverage |
| Native Born | 52 (100.0%) | 0 (0.0%) |
| Foreign Born, Citizen | 344 (100.0%) | 0 (0.0%) |
| Foreign Born, not a Citizen | 83 (100.0%) | 0 (0.0%) |
Health Insurance Coverage by Household Income in Harbor Hills
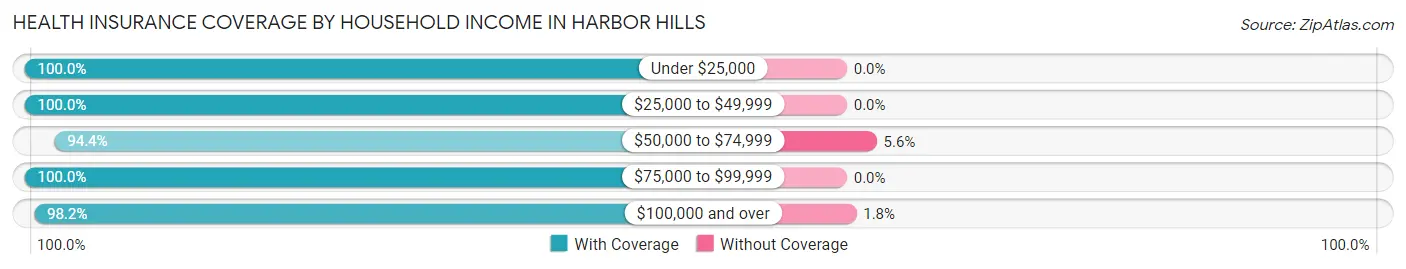
| Household Income | With Coverage | Without Coverage |
| Under $25,000 | 37 (100.0%) | 0 (0.0%) |
| $25,000 to $49,999 | 49 (100.0%) | 0 (0.0%) |
| $50,000 to $74,999 | 406 (94.4%) | 24 (5.6%) |
| $75,000 to $99,999 | 222 (100.0%) | 0 (0.0%) |
| $100,000 and over | 881 (98.2%) | 16 (1.8%) |
Public vs Private Health Insurance Coverage by Age in Harbor Hills
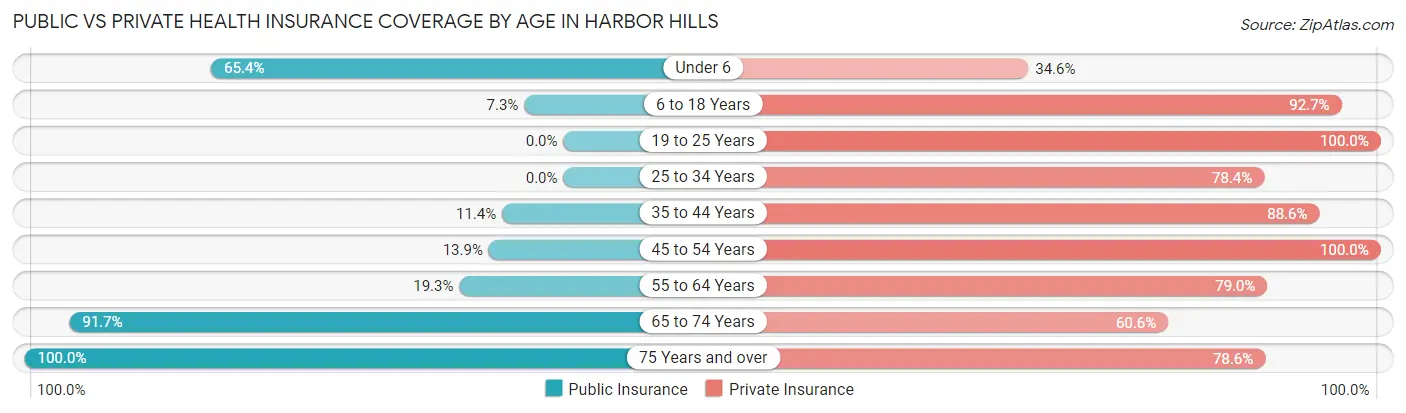
| Age Bracket | Public Insurance | Private Insurance |
| Under 6 | 34 (65.4%) | 18 (34.6%) |
| 6 to 18 Years | 25 (7.3%) | 319 (92.7%) |
| 19 to 25 Years | 0 (0.0%) | 83 (100.0%) |
| 25 to 34 Years | 0 (0.0%) | 87 (78.4%) |
| 35 to 44 Years | 33 (11.4%) | 257 (88.6%) |
| 45 to 54 Years | 9 (13.9%) | 65 (100.0%) |
| 55 to 64 Years | 45 (19.3%) | 184 (79.0%) |
| 65 to 74 Years | 265 (91.7%) | 175 (60.6%) |
| 75 Years and over | 168 (100.0%) | 132 (78.6%) |
| Total | 579 (35.4%) | 1,320 (80.7%) |
Disability Status by Sex by Age in Harbor Hills
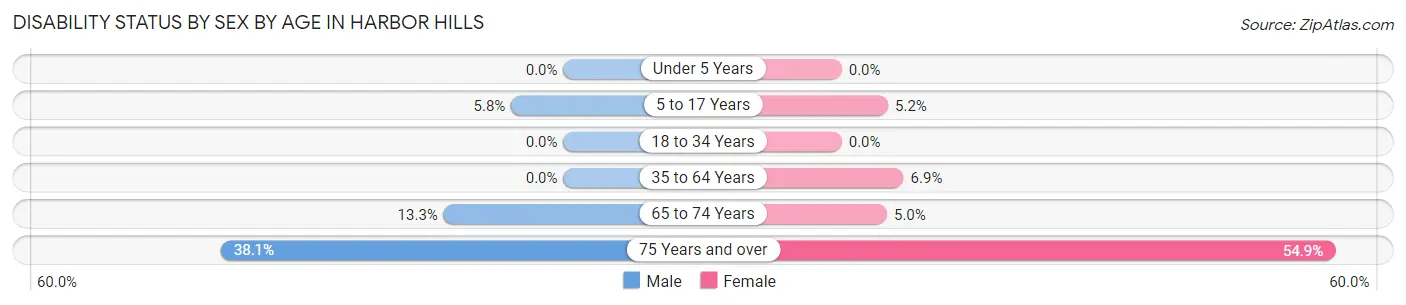
| Age Bracket | Male | Female |
| Under 5 Years | 0 (0.0%) | 0 (0.0%) |
| 5 to 17 Years | 9 (5.8%) | 8 (5.2%) |
| 18 to 34 Years | 0 (0.0%) | 0 (0.0%) |
| 35 to 64 Years | 0 (0.0%) | 23 (6.9%) |
| 65 to 74 Years | 20 (13.3%) | 7 (5.0%) |
| 75 Years and over | 37 (38.1%) | 39 (54.9%) |
Disability Class by Sex by Age in Harbor Hills
Disability Class: Hearing Difficulty
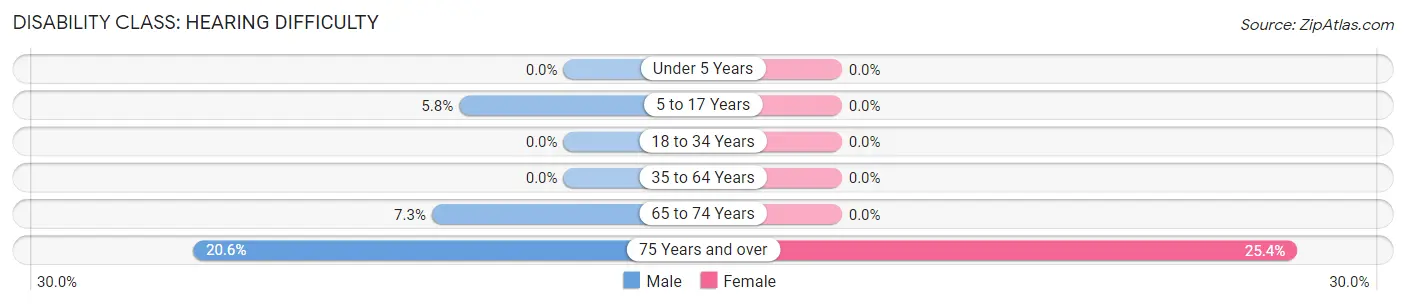
| Age Bracket | Male | Female |
| Under 5 Years | 0 (0.0%) | 0 (0.0%) |
| 5 to 17 Years | 9 (5.8%) | 0 (0.0%) |
| 18 to 34 Years | 0 (0.0%) | 0 (0.0%) |
| 35 to 64 Years | 0 (0.0%) | 0 (0.0%) |
| 65 to 74 Years | 11 (7.3%) | 0 (0.0%) |
| 75 Years and over | 20 (20.6%) | 18 (25.4%) |
Disability Class: Vision Difficulty
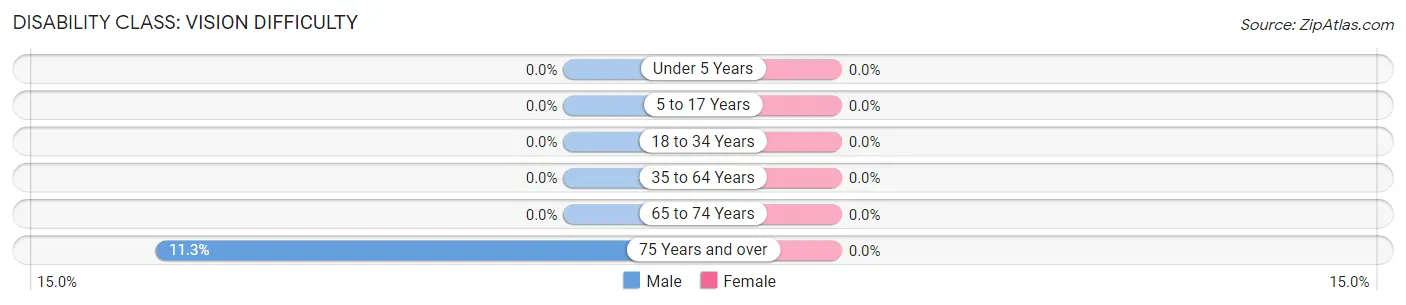
| Age Bracket | Male | Female |
| Under 5 Years | 0 (0.0%) | 0 (0.0%) |
| 5 to 17 Years | 0 (0.0%) | 0 (0.0%) |
| 18 to 34 Years | 0 (0.0%) | 0 (0.0%) |
| 35 to 64 Years | 0 (0.0%) | 0 (0.0%) |
| 65 to 74 Years | 0 (0.0%) | 0 (0.0%) |
| 75 Years and over | 11 (11.3%) | 0 (0.0%) |
Disability Class: Cognitive Difficulty
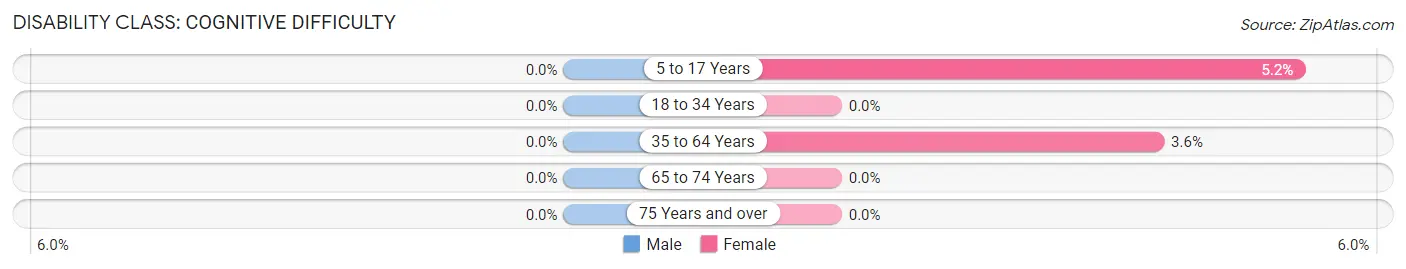
| Age Bracket | Male | Female |
| 5 to 17 Years | 0 (0.0%) | 8 (5.2%) |
| 18 to 34 Years | 0 (0.0%) | 0 (0.0%) |
| 35 to 64 Years | 0 (0.0%) | 12 (3.6%) |
| 65 to 74 Years | 0 (0.0%) | 0 (0.0%) |
| 75 Years and over | 0 (0.0%) | 0 (0.0%) |
Disability Class: Ambulatory Difficulty
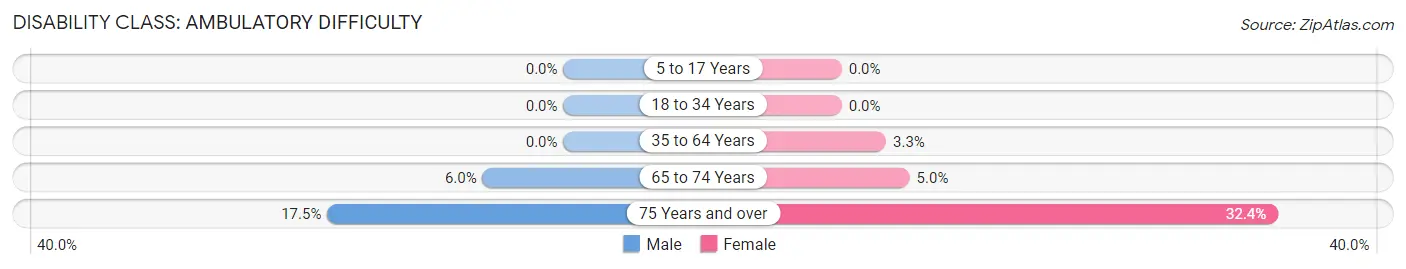
| Age Bracket | Male | Female |
| 5 to 17 Years | 0 (0.0%) | 0 (0.0%) |
| 18 to 34 Years | 0 (0.0%) | 0 (0.0%) |
| 35 to 64 Years | 0 (0.0%) | 11 (3.3%) |
| 65 to 74 Years | 9 (6.0%) | 7 (5.0%) |
| 75 Years and over | 17 (17.5%) | 23 (32.4%) |
Disability Class: Self-Care Difficulty
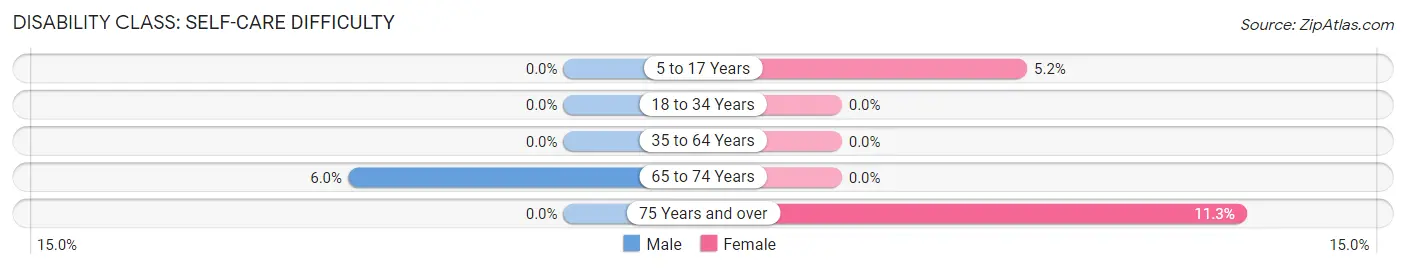
| Age Bracket | Male | Female |
| 5 to 17 Years | 0 (0.0%) | 8 (5.2%) |
| 18 to 34 Years | 0 (0.0%) | 0 (0.0%) |
| 35 to 64 Years | 0 (0.0%) | 0 (0.0%) |
| 65 to 74 Years | 9 (6.0%) | 0 (0.0%) |
| 75 Years and over | 0 (0.0%) | 8 (11.3%) |
Technology Access in Harbor Hills
Computing Device Access in Harbor Hills
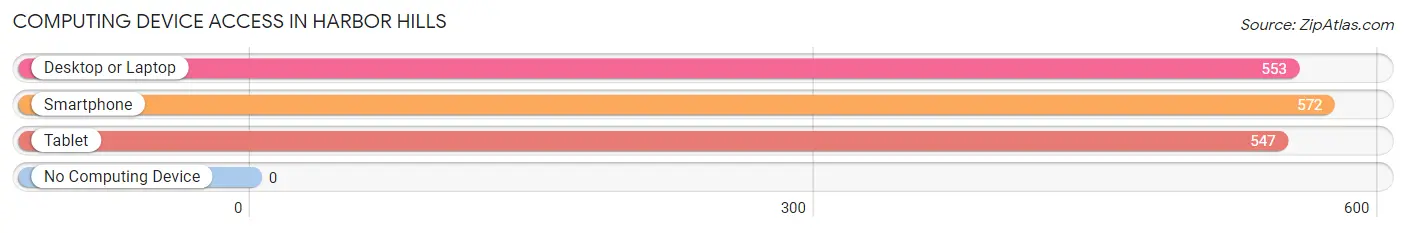
| Device Type | # Households | % Households |
| Desktop or Laptop | 553 | 85.1% |
| Smartphone | 572 | 88.0% |
| Tablet | 547 | 84.2% |
| No Computing Device | 0 | 0.0% |
| Total | 650 | 100.0% |
Internet Access in Harbor Hills
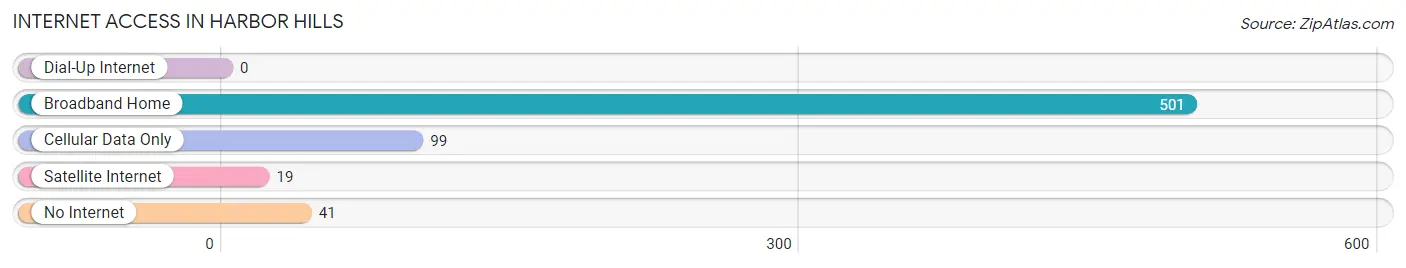
| Internet Type | # Households | % Households |
| Dial-Up Internet | 0 | 0.0% |
| Broadband Home | 501 | 77.1% |
| Cellular Data Only | 99 | 15.2% |
| Satellite Internet | 19 | 2.9% |
| No Internet | 41 | 6.3% |
| Total | 650 | 100.0% |
Harbor Hills Summary
Harbor Hills is a small village located in the state of Ohio, United States. It is situated in the county of Lake, and is part of the Cleveland-Elyria-Mentor Metropolitan Statistical Area. The village has a population of approximately 1,000 people, and is located on the shores of Lake Erie.
History
Harbor Hills was first settled in the early 1800s by a group of settlers from Connecticut. The settlers were attracted to the area due to its proximity to Lake Erie, which provided them with access to the Great Lakes. The village was originally known as “Harbor Hill”, and was incorporated in 1837.
The village was initially a small fishing and farming community, but it soon developed into a popular summer resort destination. The village was home to several large hotels, and was a popular destination for wealthy vacationers from Cleveland and other nearby cities.
In the late 19th century, the village began to experience a decline in popularity as a resort destination. This was due to the increasing popularity of other nearby resort towns, such as Put-in-Bay and Sandusky. The village also experienced a decline in population, as many of the wealthy vacationers moved away.
In the early 20th century, the village experienced a resurgence in popularity as a summer resort destination. This was due to the increasing popularity of the nearby Cedar Point amusement park, which was located just a few miles away. The village also experienced a population increase, as many of the wealthy vacationers returned to the area.
Geography
Harbor Hills is located in the northeastern corner of Lake County, Ohio. It is situated on the shores of Lake Erie, and is bordered by the cities of Mentor and Willoughby. The village is located approximately 30 miles northeast of Cleveland, and is part of the Cleveland-Elyria-Mentor Metropolitan Statistical Area.
The village is situated on a small peninsula, and is surrounded by several small lakes and ponds. The village is also home to several parks and recreational areas, including the Harbor Hills Nature Preserve.
Economy
The economy of Harbor Hills is largely based on tourism and recreation. The village is home to several hotels and resorts, which attract visitors from all over the country. The village is also home to several marinas, which provide access to Lake Erie for boaters and fishermen.
The village is also home to several small businesses, including restaurants, shops, and other services. The village is also home to several manufacturing companies, which produce a variety of products, including furniture, clothing, and electronics.
Demographics
As of the 2010 census, the population of Harbor Hills was 1,000 people. The racial makeup of the village was 97.2% White, 0.7% African American, 0.3% Native American, 0.3% Asian, and 1.5% from other races. The median household income was $45,000, and the median family income was $50,000.
The village is home to several churches, including the Harbor Hills United Methodist Church, the Harbor Hills Presbyterian Church, and the Harbor Hills Baptist Church. The village is also home to several schools, including the Harbor Hills Elementary School and the Harbor Hills High School.
Common Questions
What is the Total Population of Harbor Hills?
Total Population of Harbor Hills is 1,635.
What is the Total Male Population of Harbor Hills?
Total Male Population of Harbor Hills is 797.
What is the Total Female Population of Harbor Hills?
Total Female Population of Harbor Hills is 838.
What is the Ratio of Males per 100 Females in Harbor Hills?
There are 95.11 Males per 100 Females in Harbor Hills.
What is the Ratio of Females per 100 Males in Harbor Hills?
There are 105.14 Females per 100 Males in Harbor Hills.
What is the Median Population Age in Harbor Hills?
Median Population Age in Harbor Hills is 42.8 Years.
What is the Average Family Size in Harbor Hills
Average Family Size in Harbor Hills is 2.9 People.
What is the Average Household Size in Harbor Hills
Average Household Size in Harbor Hills is 2.5 People.
What is Per Capita Income in Harbor Hills?
Per Capita income in Harbor Hills is $46,682.
What is the Median Family Income in Harbor Hills?
Median Family Income in Harbor Hills is $115,781.
What is the Median Household income in Harbor Hills?
Median Household Income in Harbor Hills is $79,423.
What is Income or Wage Gap in Harbor Hills?
Income or Wage Gap in Harbor Hills is 3.1%.
Women in Harbor Hills earn 96.9 cents for every dollar earned by a man.
What is Inequality or Gini Index in Harbor Hills?
Inequality or Gini Index in Harbor Hills is 0.35.
How Large is the Labor Force in Harbor Hills?
There are 799 People in the Labor Forcein in Harbor Hills.
What is the Percentage of People in the Labor Force in Harbor Hills?
61.1% of People are in the Labor Force in Harbor Hills.
What is the Unemployment Rate in Harbor Hills?
Unemployment Rate in Harbor Hills is 3.0%.