Maplewood Park, OH
Maplewood Park Map
Maplewood Park Overview
275
TOTAL POPULATION
123
MALE POPULATION
152
FEMALE POPULATION
80.92
MALES / 100 FEMALES
123.58
FEMALES / 100 MALES
42.5
MEDIAN AGE
3.2
AVG FAMILY SIZE
2.8
AVG HOUSEHOLD SIZE
$21,319
PER CAPITA INCOME
$48,224
AVG FAMILY INCOME
$49,408
AVG HOUSEHOLD INCOME
0.29
INEQUALITY / GINI INDEX
107
LABOR FORCE [ PEOPLE ]
45.7%
PERCENT IN LABOR FORCE
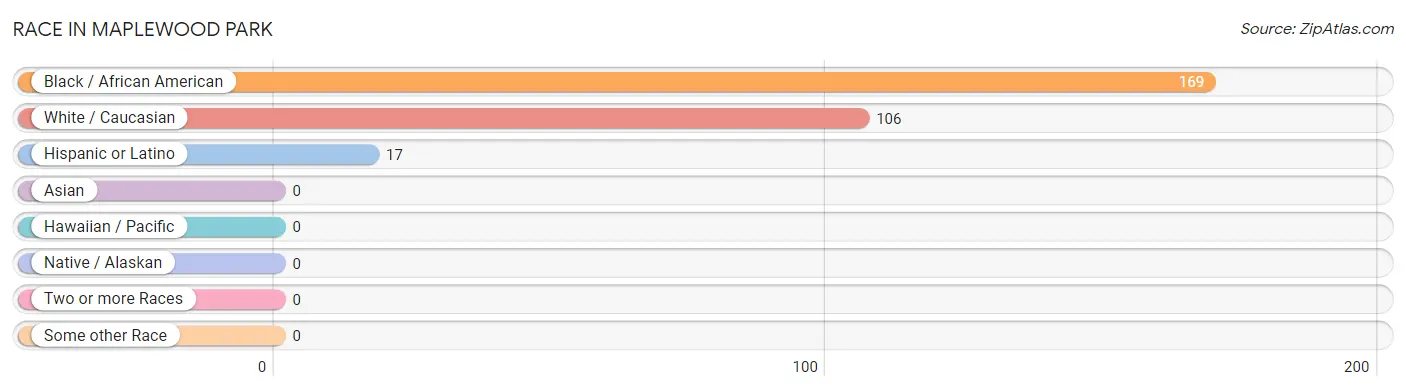
Race in Maplewood Park
The most populous races in Maplewood Park are Black / African American (169 | 61.5%), White / Caucasian (106 | 38.6%), and Hispanic or Latino (17 | 6.2%).
| Race | # Population | % Population |
| Asian | 0 | 0.0% |
| Black / African American | 169 | 61.5% |
| Hawaiian / Pacific | 0 | 0.0% |
| Hispanic or Latino | 17 | 6.2% |
| Native / Alaskan | 0 | 0.0% |
| White / Caucasian | 106 | 38.6% |
| Two or more Races | 0 | 0.0% |
| Some other Race | 0 | 0.0% |
| Total | 275 | 100.0% |
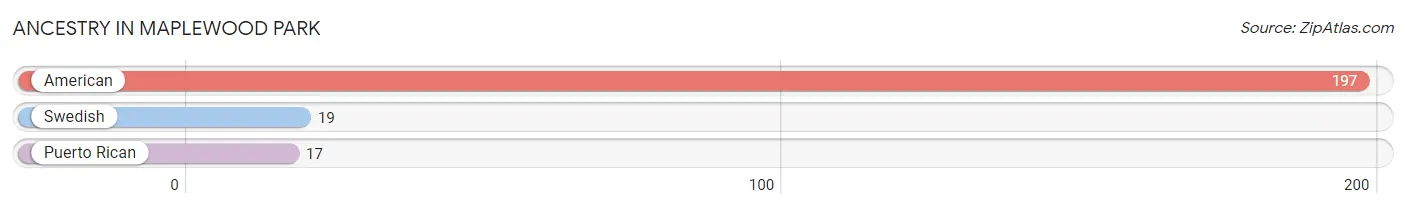
Ancestry in Maplewood Park
The most populous ancestries reported in Maplewood Park are American (197 | 71.6%), Swedish (19 | 6.9%), and Puerto Rican (17 | 6.2%), together accounting for 84.7% of all Maplewood Park residents.
| Ancestry | # Population | % Population |
| American | 197 | 71.6% |
| Puerto Rican | 17 | 6.2% |
| Swedish | 19 | 6.9% | View All 3 Rows |
Immigrants in Maplewood Park

| Immigration Origin | # Population | % Population | View All 0 Rows |
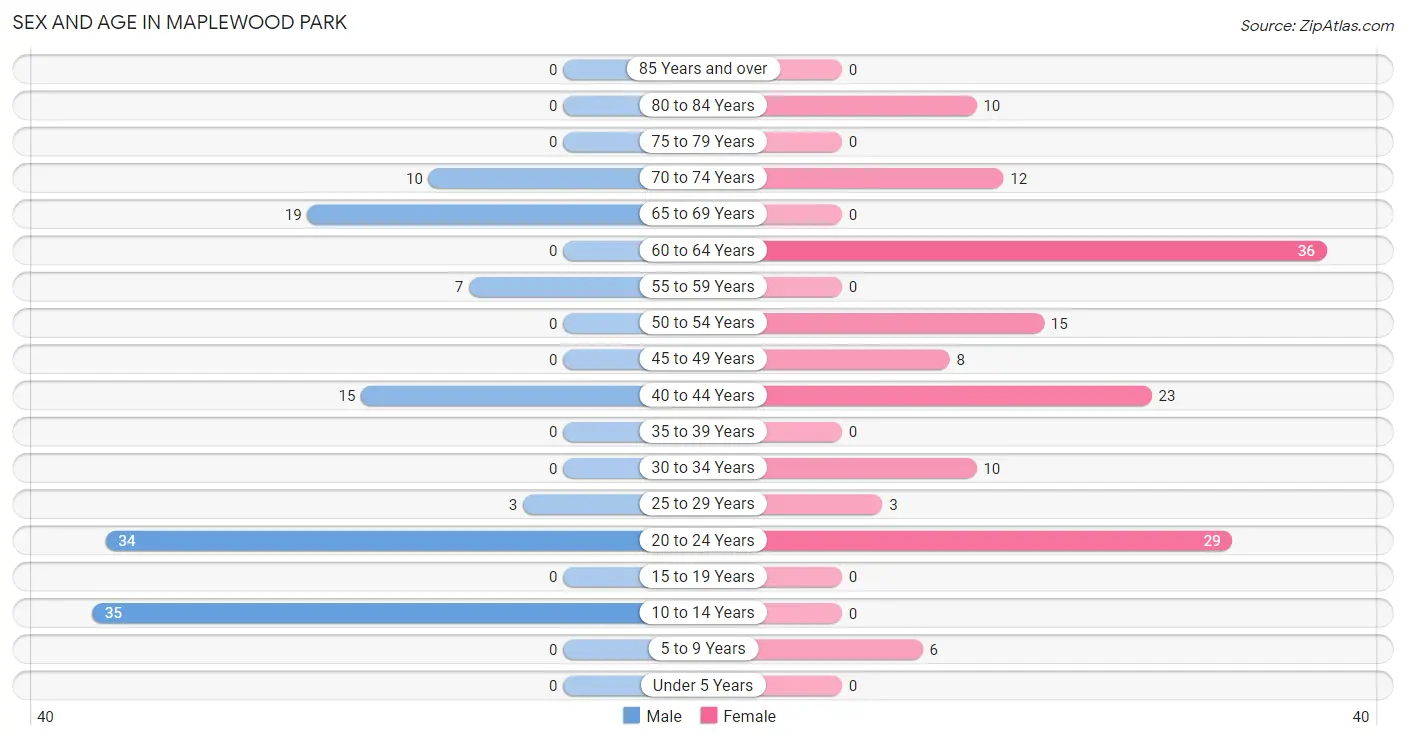
Sex and Age in Maplewood Park
Sex and Age in Maplewood Park
The most populous age groups in Maplewood Park are 10 to 14 Years (35 | 28.5%) for men and 60 to 64 Years (36 | 23.7%) for women.
| Age Bracket | Male | Female |
| Under 5 Years | 0 (0.0%) | 0 (0.0%) |
| 5 to 9 Years | 0 (0.0%) | 6 (4.0%) |
| 10 to 14 Years | 35 (28.5%) | 0 (0.0%) |
| 15 to 19 Years | 0 (0.0%) | 0 (0.0%) |
| 20 to 24 Years | 34 (27.6%) | 29 (19.1%) |
| 25 to 29 Years | 3 (2.4%) | 3 (2.0%) |
| 30 to 34 Years | 0 (0.0%) | 10 (6.6%) |
| 35 to 39 Years | 0 (0.0%) | 0 (0.0%) |
| 40 to 44 Years | 15 (12.2%) | 23 (15.1%) |
| 45 to 49 Years | 0 (0.0%) | 8 (5.3%) |
| 50 to 54 Years | 0 (0.0%) | 15 (9.9%) |
| 55 to 59 Years | 7 (5.7%) | 0 (0.0%) |
| 60 to 64 Years | 0 (0.0%) | 36 (23.7%) |
| 65 to 69 Years | 19 (15.4%) | 0 (0.0%) |
| 70 to 74 Years | 10 (8.1%) | 12 (7.9%) |
| 75 to 79 Years | 0 (0.0%) | 0 (0.0%) |
| 80 to 84 Years | 0 (0.0%) | 10 (6.6%) |
| 85 Years and over | 0 (0.0%) | 0 (0.0%) |
| Total | 123 (100.0%) | 152 (100.0%) |
Families and Households in Maplewood Park
Median Family Size in Maplewood Park
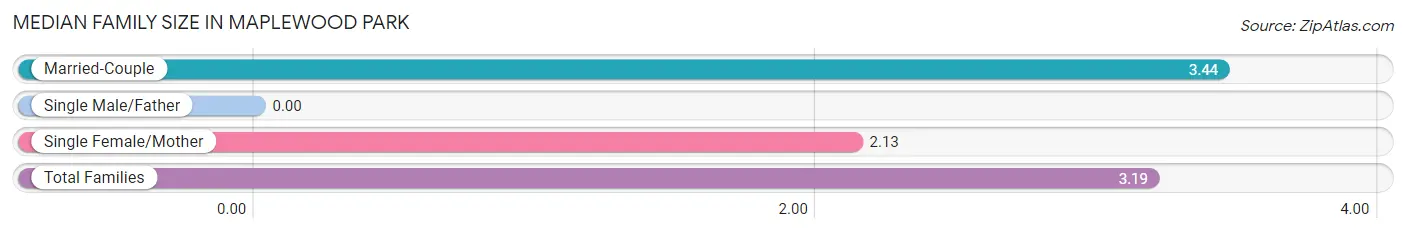
| Family Type | # Families | Family Size |
| Married-Couple | 64 (81.0%) | 3.44 |
| Single Male/Father | 0 (0.0%) | - |
| Single Female/Mother | 15 (19.0%) | 2.13 |
| Total Families | 79 (100.0%) | 3.19 |
Median Household Size in Maplewood Park
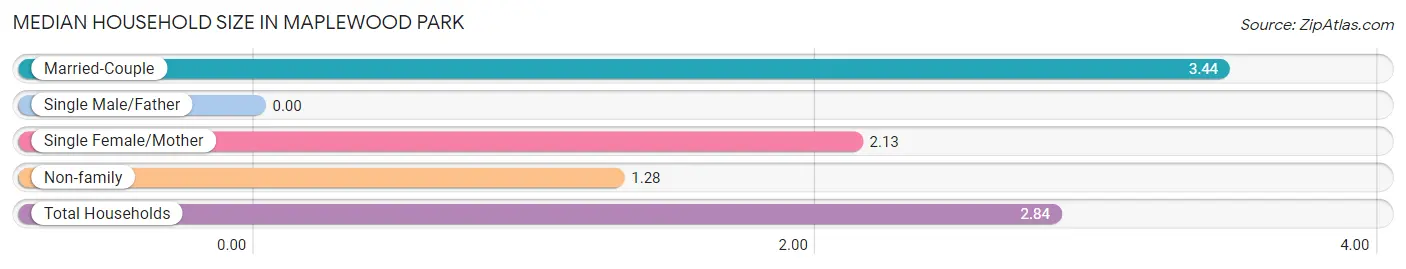
| Household Type | # Households | Household Size |
| Married-Couple | 64 (66.0%) | 3.44 |
| Single Male/Father | 0 (0.0%) | - |
| Single Female/Mother | 15 (15.5%) | 2.13 |
| Non-family | 18 (18.6%) | 1.28 |
| Total Households | 97 (100.0%) | 2.84 |
Household Size by Marriage Status in Maplewood Park
Out of a total of 97 households in Maplewood Park, 79 (81.4%) are family households, while 18 (18.6%) are nonfamily households. The most numerous type of family households are 2-person households, comprising 30, and the most common type of nonfamily households are 1-person households, comprising 13.
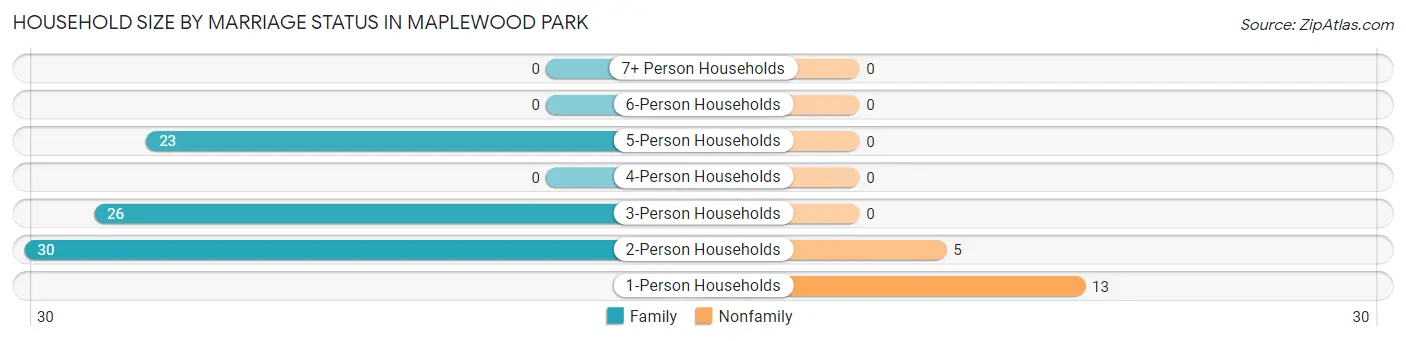
| Household Size | Family Households | Nonfamily Households |
| 1-Person Households | - | 13 (13.4%) |
| 2-Person Households | 30 (30.9%) | 5 (5.1%) |
| 3-Person Households | 26 (26.8%) | 0 (0.0%) |
| 4-Person Households | 0 (0.0%) | 0 (0.0%) |
| 5-Person Households | 23 (23.7%) | 0 (0.0%) |
| 6-Person Households | 0 (0.0%) | 0 (0.0%) |
| 7+ Person Households | 0 (0.0%) | 0 (0.0%) |
| Total | 79 (81.4%) | 18 (18.6%) |
Female Fertility in Maplewood Park
Fertility by Age in Maplewood Park
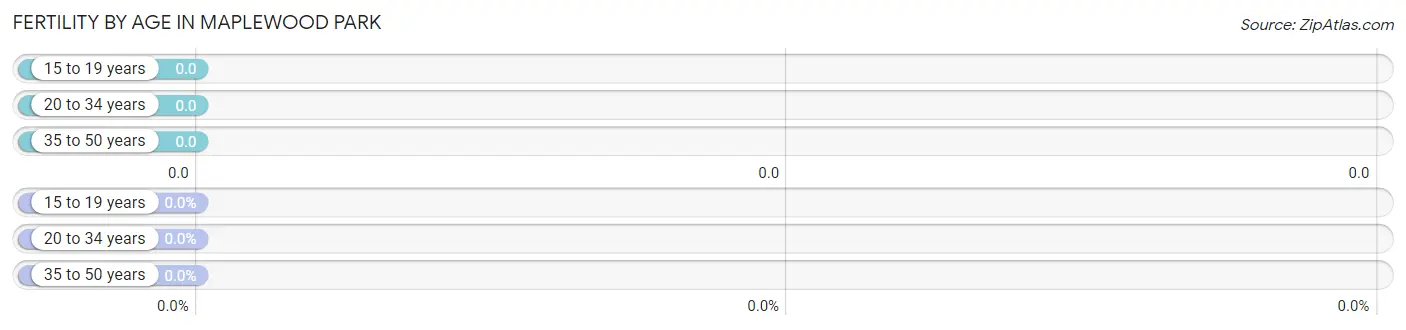
| Age Bracket | Women with Births | Births / 1,000 Women |
| 15 to 19 years | 0 (0.0%) | 0.0 |
| 20 to 34 years | 0 (0.0%) | 0.0 |
| 35 to 50 years | 0 (0.0%) | 0.0 |
| Total | 0 (0.0%) | 0.0 |
Fertility by Age by Marriage Status in Maplewood Park
| Age Bracket | Married | Unmarried |
| 15 to 19 years | 0 (0.0%) | 0 (0.0%) |
| 20 to 34 years | 0 (0.0%) | 0 (0.0%) |
| 35 to 50 years | 0 (0.0%) | 0 (0.0%) |
| Total | 0 (0.0%) | 0 (0.0%) |
Fertility by Education in Maplewood Park
| Educational Attainment | Women with Births | Births / 1,000 Women |
| Less than High School | 0 (0.0%) | 0.0 |
| High School Diploma | 0 (0.0%) | 0.0 |
| College or Associate's Degree | 0 (0.0%) | 0.0 |
| Bachelor's Degree | 0 (0.0%) | 0.0 |
| Graduate Degree | 0 (0.0%) | 0.0 |
| Total | 0 (0.0%) | 0.0 |
Fertility by Education by Marriage Status in Maplewood Park
| Educational Attainment | Married | Unmarried |
| Less than High School | 0 (0.0%) | 0 (0.0%) |
| High School Diploma | 0 (0.0%) | 0 (0.0%) |
| College or Associate's Degree | 0 (0.0%) | 0 (0.0%) |
| Bachelor's Degree | 0 (0.0%) | 0 (0.0%) |
| Graduate Degree | 0 (0.0%) | 0 (0.0%) |
| Total | 0 (0.0%) | 0 (0.0%) |
Income in Maplewood Park
Income Overview in Maplewood Park
Per Capita Income in Maplewood Park is $21,319, while median incomes of families and households are $48,224 and $49,408 respectively.
| Characteristic | Number | Measure |
| Per Capita Income | 275 | $21,319 |
| Median Family Income | 79 | $48,224 |
| Mean Family Income | 79 | $54,789 |
| Median Household Income | 97 | $49,408 |
| Mean Household Income | 97 | $62,289 |
| Income Deficit | 79 | $0 |
| Wage / Income Gap (%) | 275 | 0.00% |
| Wage / Income Gap ($) | 275 | 100.00¢ per $1 |
| Gini / Inequality Index | 275 | 0.29 |
Earnings by Sex in Maplewood Park
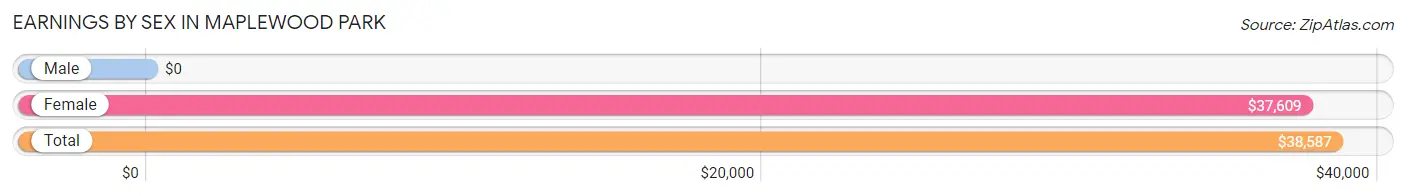
| Sex | Number | Average Earnings |
| Male | 18 (16.1%) | $0 |
| Female | 94 (83.9%) | $37,609 |
| Total | 112 (100.0%) | $38,587 |
Earnings by Sex by Income Bracket in Maplewood Park
The most common earnings brackets in Maplewood Park are $45,000 to $49,999 for men (15 | 83.3%) and $22,500 to $24,999 for women (29 | 30.8%).
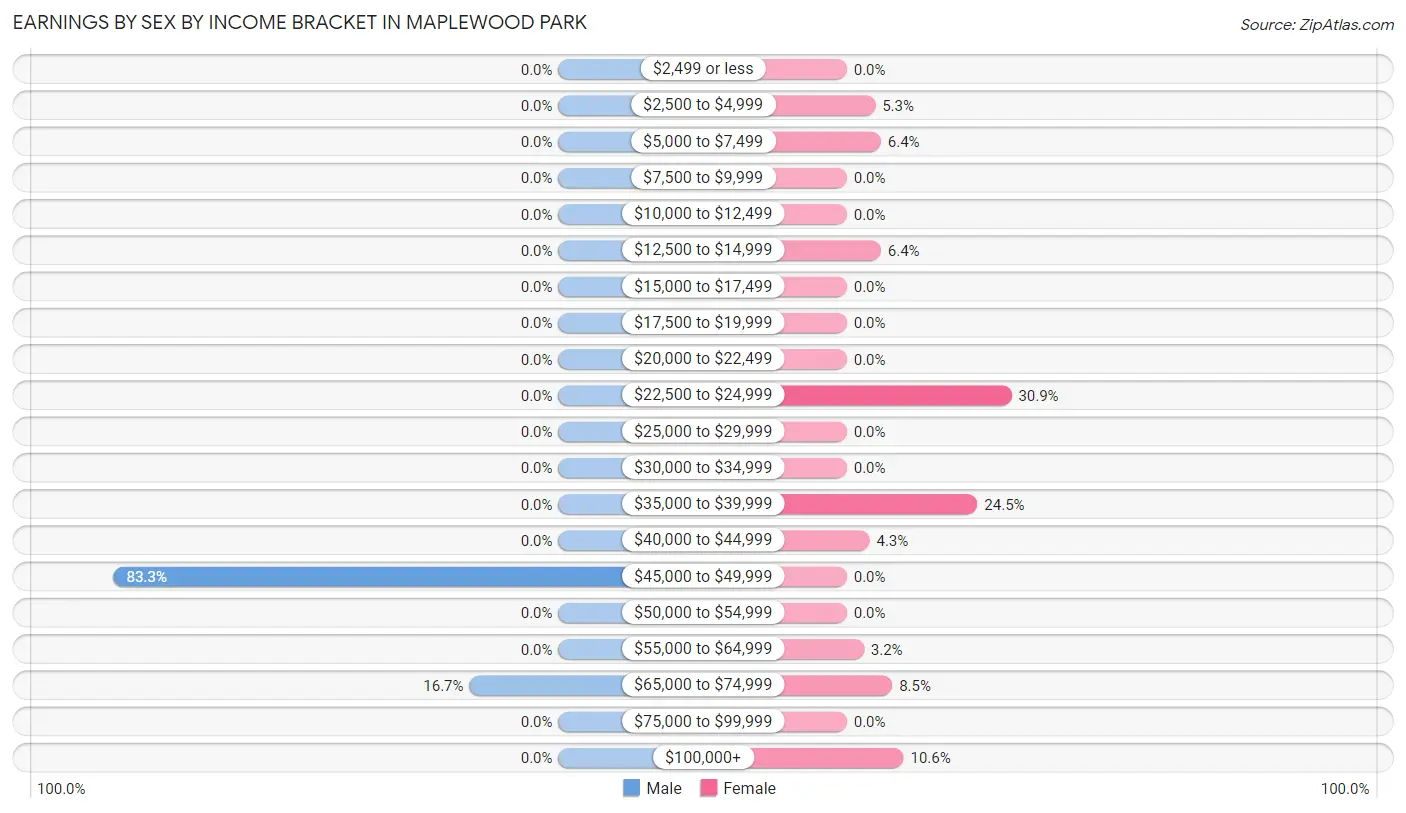
| Income | Male | Female |
| $2,499 or less | 0 (0.0%) | 0 (0.0%) |
| $2,500 to $4,999 | 0 (0.0%) | 5 (5.3%) |
| $5,000 to $7,499 | 0 (0.0%) | 6 (6.4%) |
| $7,500 to $9,999 | 0 (0.0%) | 0 (0.0%) |
| $10,000 to $12,499 | 0 (0.0%) | 0 (0.0%) |
| $12,500 to $14,999 | 0 (0.0%) | 6 (6.4%) |
| $15,000 to $17,499 | 0 (0.0%) | 0 (0.0%) |
| $17,500 to $19,999 | 0 (0.0%) | 0 (0.0%) |
| $20,000 to $22,499 | 0 (0.0%) | 0 (0.0%) |
| $22,500 to $24,999 | 0 (0.0%) | 29 (30.8%) |
| $25,000 to $29,999 | 0 (0.0%) | 0 (0.0%) |
| $30,000 to $34,999 | 0 (0.0%) | 0 (0.0%) |
| $35,000 to $39,999 | 0 (0.0%) | 23 (24.5%) |
| $40,000 to $44,999 | 0 (0.0%) | 4 (4.3%) |
| $45,000 to $49,999 | 15 (83.3%) | 0 (0.0%) |
| $50,000 to $54,999 | 0 (0.0%) | 0 (0.0%) |
| $55,000 to $64,999 | 0 (0.0%) | 3 (3.2%) |
| $65,000 to $74,999 | 3 (16.7%) | 8 (8.5%) |
| $75,000 to $99,999 | 0 (0.0%) | 0 (0.0%) |
| $100,000+ | 0 (0.0%) | 10 (10.6%) |
| Total | 18 (100.0%) | 94 (100.0%) |
Earnings by Sex by Educational Attainment in Maplewood Park
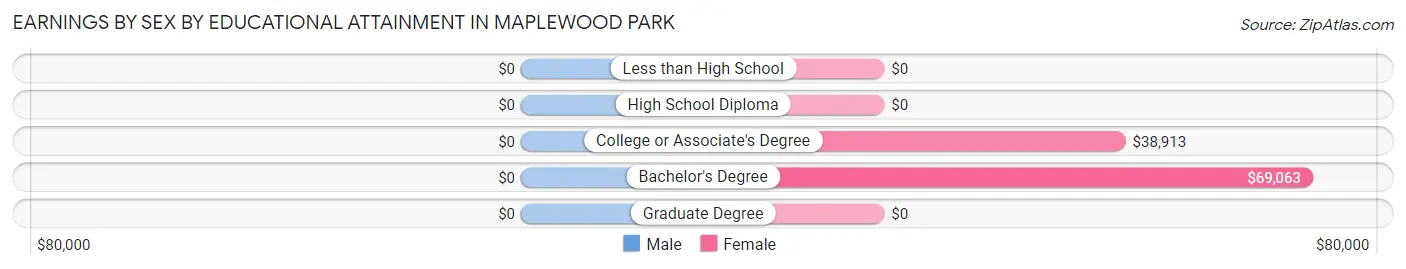
| Educational Attainment | Male Income | Female Income |
| Less than High School | - | - |
| High School Diploma | - | - |
| College or Associate's Degree | - | - |
| Bachelor's Degree | - | - |
| Graduate Degree | - | - |
| Total | - | - |
Family Income in Maplewood Park
Family Income Brackets in Maplewood Park
According to the Maplewood Park family income data, there are 30 families falling into the $35,000 to $49,999 income range, which is the most common income bracket and makes up 38.0% of all families.
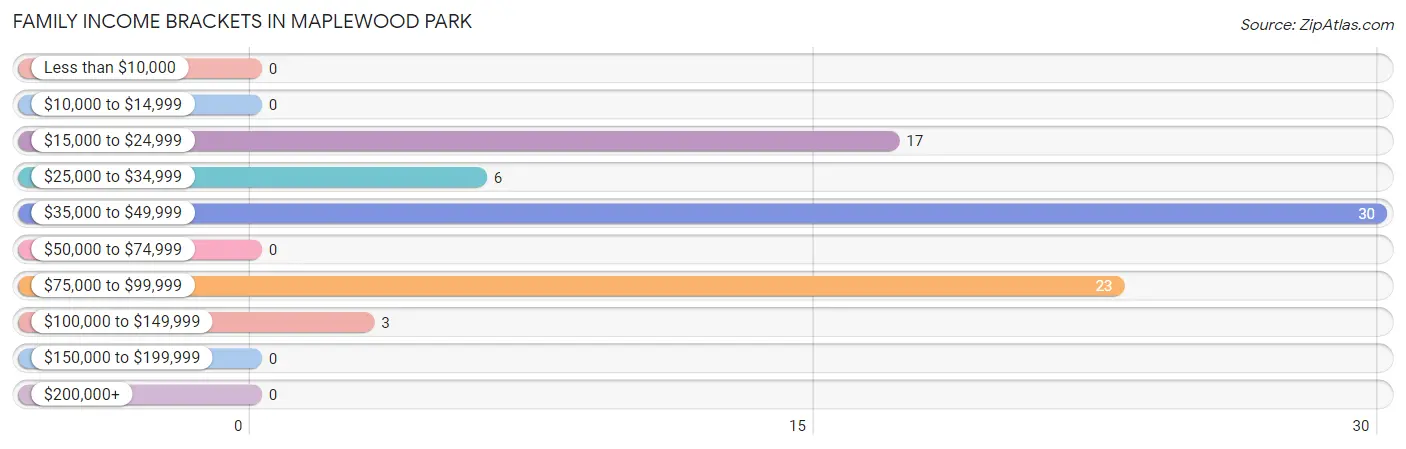
| Income Bracket | # Families | % Families |
| Less than $10,000 | 0 | 0.0% |
| $10,000 to $14,999 | 0 | 0.0% |
| $15,000 to $24,999 | 17 | 21.5% |
| $25,000 to $34,999 | 6 | 7.6% |
| $35,000 to $49,999 | 30 | 38.0% |
| $50,000 to $74,999 | 0 | 0.0% |
| $75,000 to $99,999 | 23 | 29.1% |
| $100,000 to $149,999 | 3 | 3.8% |
| $150,000 to $199,999 | 0 | 0.0% |
| $200,000+ | 0 | 0.0% |
Family Income by Famaliy Size in Maplewood Park
2-person families (30 | 38.0%) account for the highest median family income in Maplewood Park with $24,000 per family, while 2-person families (30 | 38.0%) have the highest median income of $12,000 per family member.
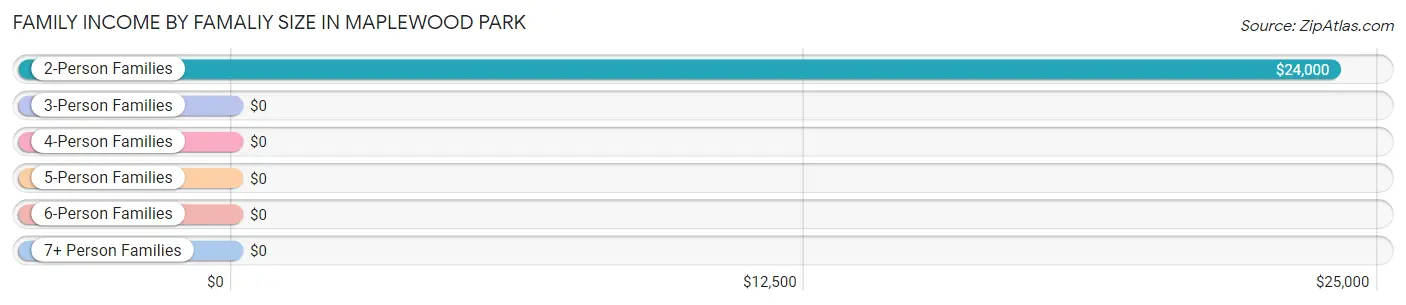
| Income Bracket | # Families | Median Income |
| 2-Person Families | 30 (38.0%) | $24,000 |
| 3-Person Families | 26 (32.9%) | $0 |
| 4-Person Families | 0 (0.0%) | $0 |
| 5-Person Families | 23 (29.1%) | $0 |
| 6-Person Families | 0 (0.0%) | $0 |
| 7+ Person Families | 0 (0.0%) | $0 |
| Total | 79 (100.0%) | $48,224 |
Family Income by Number of Earners in Maplewood Park
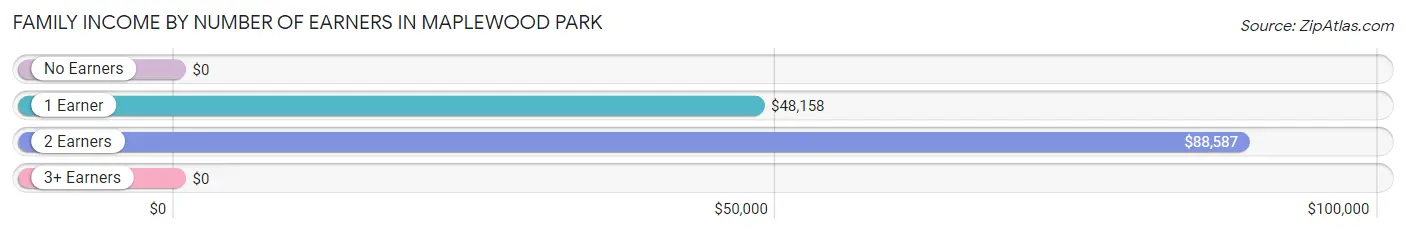
| Number of Earners | # Families | Median Income |
| No Earners | 19 (24.0%) | $0 |
| 1 Earner | 28 (35.4%) | $48,158 |
| 2 Earners | 32 (40.5%) | $88,587 |
| 3+ Earners | 0 (0.0%) | $0 |
| Total | 79 (100.0%) | $48,224 |
Household Income in Maplewood Park
Household Income Brackets in Maplewood Park
With 30 households falling in the category, the $35,000 to $49,999 income range is the most frequent in Maplewood Park, accounting for 30.9% of all households.
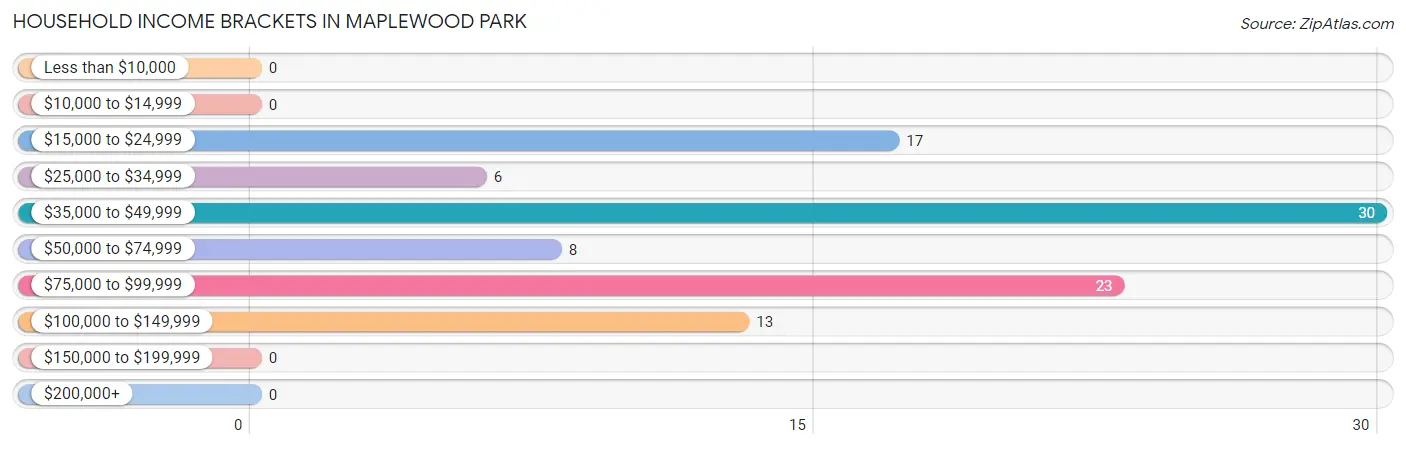
| Income Bracket | # Households | % Households |
| Less than $10,000 | 0 | 0.0% |
| $10,000 to $14,999 | 0 | 0.0% |
| $15,000 to $24,999 | 17 | 17.5% |
| $25,000 to $34,999 | 6 | 6.2% |
| $35,000 to $49,999 | 30 | 30.9% |
| $50,000 to $74,999 | 8 | 8.2% |
| $75,000 to $99,999 | 23 | 23.7% |
| $100,000 to $149,999 | 13 | 13.4% |
| $150,000 to $199,999 | 0 | 0.0% |
| $200,000+ | 0 | 0.0% |
Household Income by Householder Age in Maplewood Park
The median household income in Maplewood Park is $49,408, with the highest median household income of $88,696 found in the 25 to 44 years age bracket for the primary householder. A total of 30 households (30.9%) fall into this category.
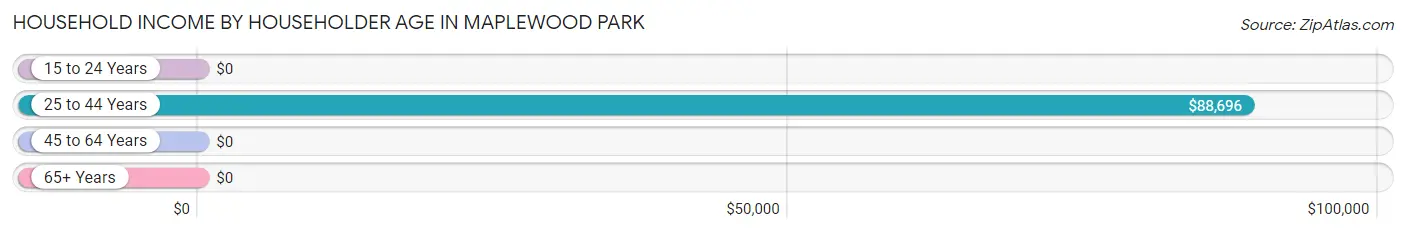
| Income Bracket | # Households | Median Income |
| 15 to 24 Years | 0 (0.0%) | $0 |
| 25 to 44 Years | 30 (30.9%) | $88,696 |
| 45 to 64 Years | 36 (37.1%) | $0 |
| 65+ Years | 31 (32.0%) | $0 |
| Total | 97 (100.0%) | $49,408 |
Poverty in Maplewood Park
Income Below Poverty by Sex and Age in Maplewood Park
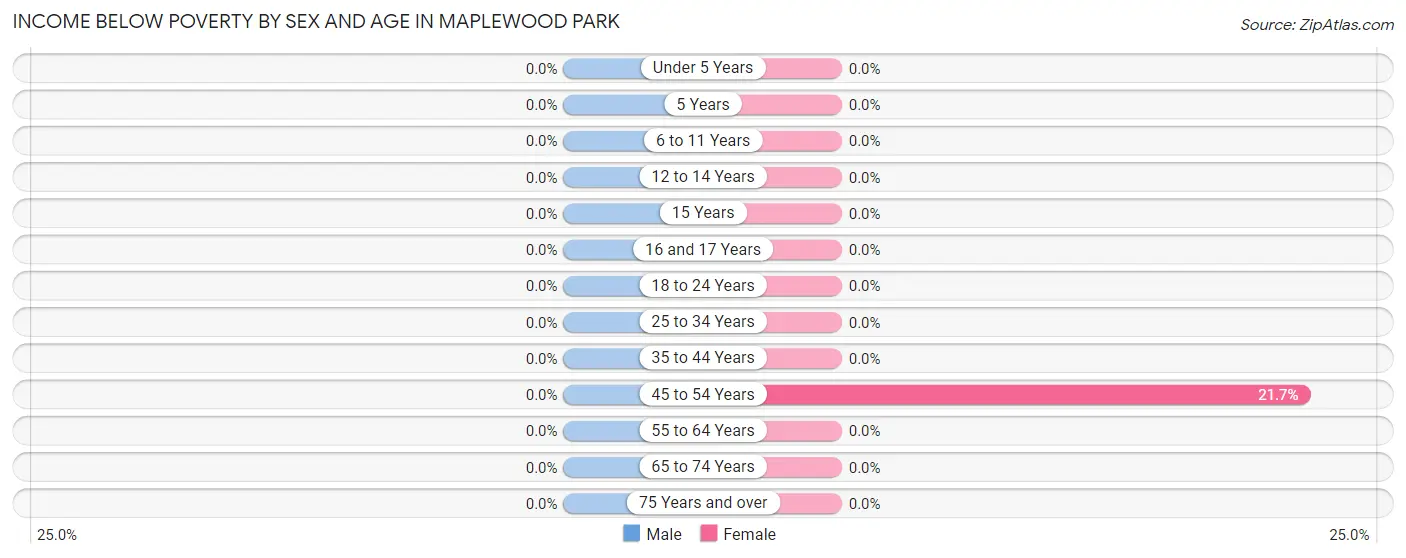
| Age Bracket | Male | Female |
| Under 5 Years | 0 (0.0%) | 0 (0.0%) |
| 5 Years | 0 (0.0%) | 0 (0.0%) |
| 6 to 11 Years | 0 (0.0%) | 0 (0.0%) |
| 12 to 14 Years | 0 (0.0%) | 0 (0.0%) |
| 15 Years | 0 (0.0%) | 0 (0.0%) |
| 16 and 17 Years | 0 (0.0%) | 0 (0.0%) |
| 18 to 24 Years | 0 (0.0%) | 0 (0.0%) |
| 25 to 34 Years | 0 (0.0%) | 0 (0.0%) |
| 35 to 44 Years | 0 (0.0%) | 0 (0.0%) |
| 45 to 54 Years | 0 (0.0%) | 5 (21.7%) |
| 55 to 64 Years | 0 (0.0%) | 0 (0.0%) |
| 65 to 74 Years | 0 (0.0%) | 0 (0.0%) |
| 75 Years and over | 0 (0.0%) | 0 (0.0%) |
| Total | 0 (0.0%) | 5 (3.3%) |
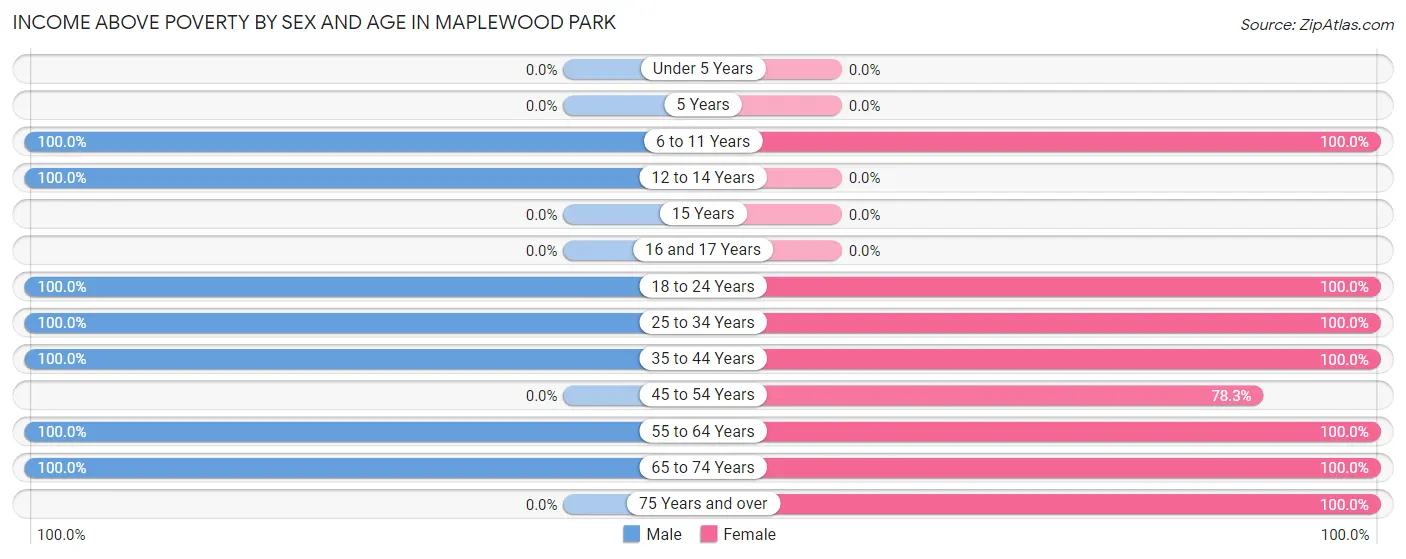
Income Above Poverty by Sex and Age in Maplewood Park
According to the poverty statistics in Maplewood Park, males aged 6 to 11 years and females aged 6 to 11 years are the age groups that are most secure financially, with 100.0% of males and 100.0% of females in these age groups living above the poverty line.
| Age Bracket | Male | Female |
| Under 5 Years | 0 (0.0%) | 0 (0.0%) |
| 5 Years | 0 (0.0%) | 0 (0.0%) |
| 6 to 11 Years | 17 (100.0%) | 6 (100.0%) |
| 12 to 14 Years | 18 (100.0%) | 0 (0.0%) |
| 15 Years | 0 (0.0%) | 0 (0.0%) |
| 16 and 17 Years | 0 (0.0%) | 0 (0.0%) |
| 18 to 24 Years | 34 (100.0%) | 29 (100.0%) |
| 25 to 34 Years | 3 (100.0%) | 13 (100.0%) |
| 35 to 44 Years | 15 (100.0%) | 23 (100.0%) |
| 45 to 54 Years | 0 (0.0%) | 18 (78.3%) |
| 55 to 64 Years | 7 (100.0%) | 36 (100.0%) |
| 65 to 74 Years | 29 (100.0%) | 12 (100.0%) |
| 75 Years and over | 0 (0.0%) | 10 (100.0%) |
| Total | 123 (100.0%) | 147 (96.7%) |
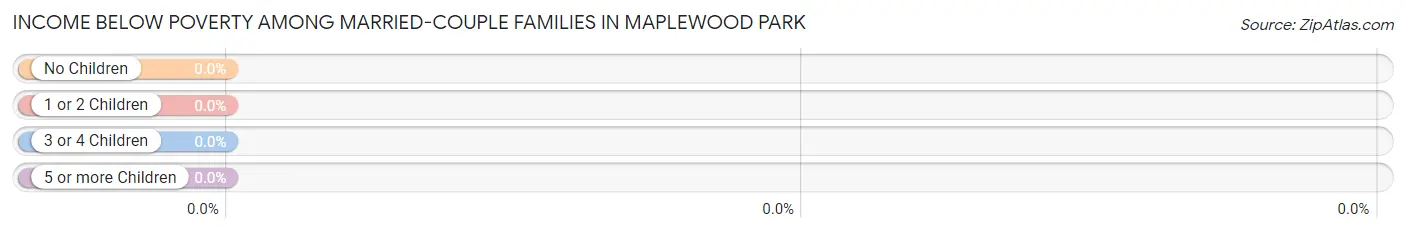
Income Below Poverty Among Married-Couple Families in Maplewood Park
| Children | Above Poverty | Below Poverty |
| No Children | 41 (100.0%) | 0 (0.0%) |
| 1 or 2 Children | 23 (100.0%) | 0 (0.0%) |
| 3 or 4 Children | 0 (0.0%) | 0 (0.0%) |
| 5 or more Children | 0 (0.0%) | 0 (0.0%) |
| Total | 64 (100.0%) | 0 (0.0%) |
Income Below Poverty Among Single-Parent Households in Maplewood Park
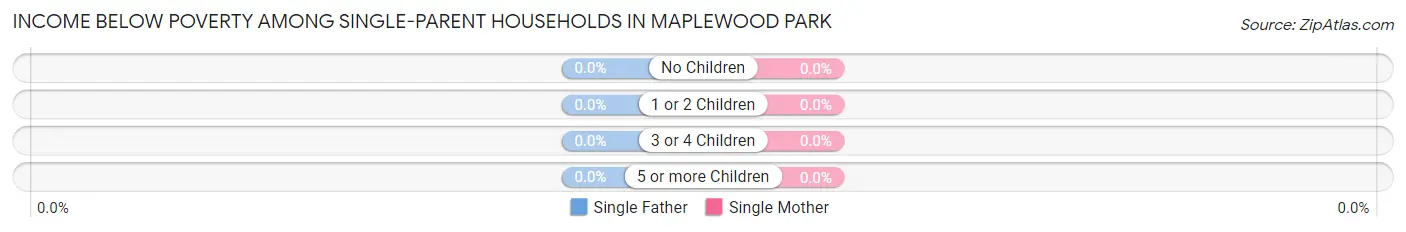
| Children | Single Father | Single Mother |
| No Children | 0 (0.0%) | 0 (0.0%) |
| 1 or 2 Children | 0 (0.0%) | 0 (0.0%) |
| 3 or 4 Children | 0 (0.0%) | 0 (0.0%) |
| 5 or more Children | 0 (0.0%) | 0 (0.0%) |
| Total | 0 (0.0%) | 0 (0.0%) |
Income Below Poverty Among Married-Couple vs Single-Parent Households in Maplewood Park
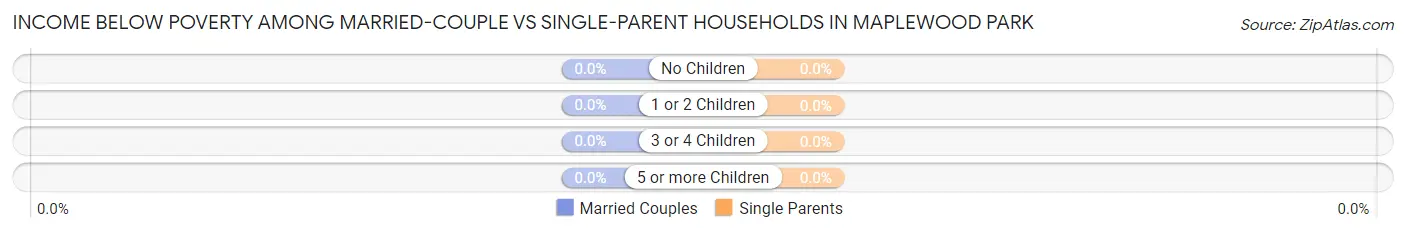
| Children | Married-Couple Families | Single-Parent Households |
| No Children | 0 (0.0%) | 0 (0.0%) |
| 1 or 2 Children | 0 (0.0%) | 0 (0.0%) |
| 3 or 4 Children | 0 (0.0%) | 0 (0.0%) |
| 5 or more Children | 0 (0.0%) | 0 (0.0%) |
| Total | 0 (0.0%) | 0 (0.0%) |
Employment Characteristics in Maplewood Park
Employment by Class of Employer in Maplewood Park
Among the 107 employed individuals in Maplewood Park, private company employees (92 | 86.0%), not-for-profit organizations (9 | 8.4%), and state government employees (6 | 5.6%) make up the most common classes of employment.
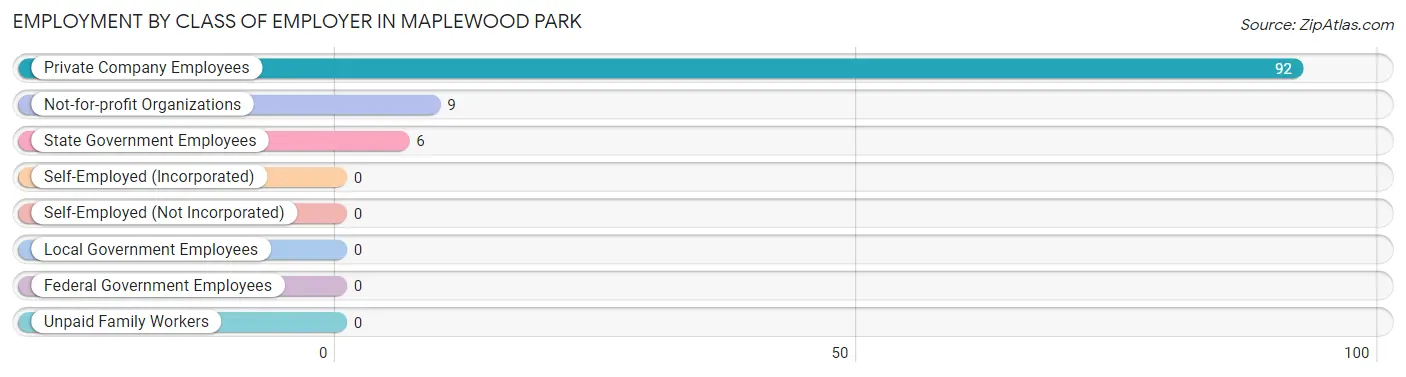
| Employer Class | # Employees | % Employees |
| Private Company Employees | 92 | 86.0% |
| Self-Employed (Incorporated) | 0 | 0.0% |
| Self-Employed (Not Incorporated) | 0 | 0.0% |
| Not-for-profit Organizations | 9 | 8.4% |
| Local Government Employees | 0 | 0.0% |
| State Government Employees | 6 | 5.6% |
| Federal Government Employees | 0 | 0.0% |
| Unpaid Family Workers | 0 | 0.0% |
| Total | 107 | 100.0% |
Employment Status by Age in Maplewood Park
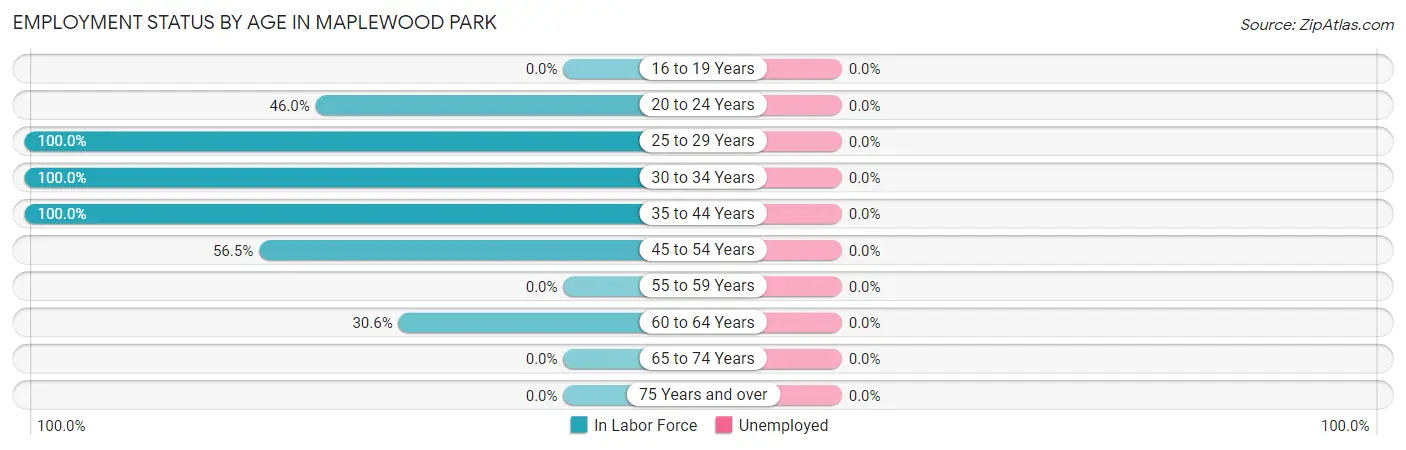
| Age Bracket | In Labor Force | Unemployed |
| 16 to 19 Years | 0 (0.0%) | 0 (0.0%) |
| 20 to 24 Years | 29 (46.0%) | 0 (0.0%) |
| 25 to 29 Years | 6 (100.0%) | 0 (0.0%) |
| 30 to 34 Years | 10 (100.0%) | 0 (0.0%) |
| 35 to 44 Years | 38 (100.0%) | 0 (0.0%) |
| 45 to 54 Years | 13 (56.5%) | 0 (0.0%) |
| 55 to 59 Years | 0 (0.0%) | 0 (0.0%) |
| 60 to 64 Years | 11 (30.6%) | 0 (0.0%) |
| 65 to 74 Years | 0 (0.0%) | 0 (0.0%) |
| 75 Years and over | 0 (0.0%) | 0 (0.0%) |
| Total | 107 (45.7%) | 0 (0.0%) |
Employment Status by Educational Attainment in Maplewood Park
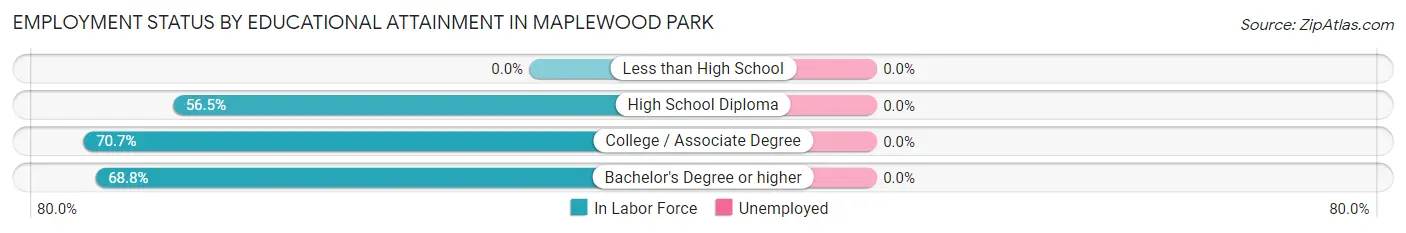
| Educational Attainment | In Labor Force | Unemployed |
| Less than High School | 0 (0.0%) | 0 (0.0%) |
| High School Diploma | 26 (56.5%) | 0 (0.0%) |
| College / Associate Degree | 41 (70.7%) | 0 (0.0%) |
| Bachelor's Degree or higher | 11 (68.8%) | 0 (0.0%) |
| Total | 78 (65.0%) | 0 (0.0%) |
Employment Occupations by Sex in Maplewood Park
Management, Business, Science and Arts Occupations
The most common Management, Business, Science and Arts occupations in Maplewood Park are Health Diagnosing & Treating (8 | 7.5%), Health Technologists (8 | 7.5%), Management (5 | 4.7%), Computers, Engineering & Science (3 | 2.8%), and Life, Physical & Social Science (3 | 2.8%).
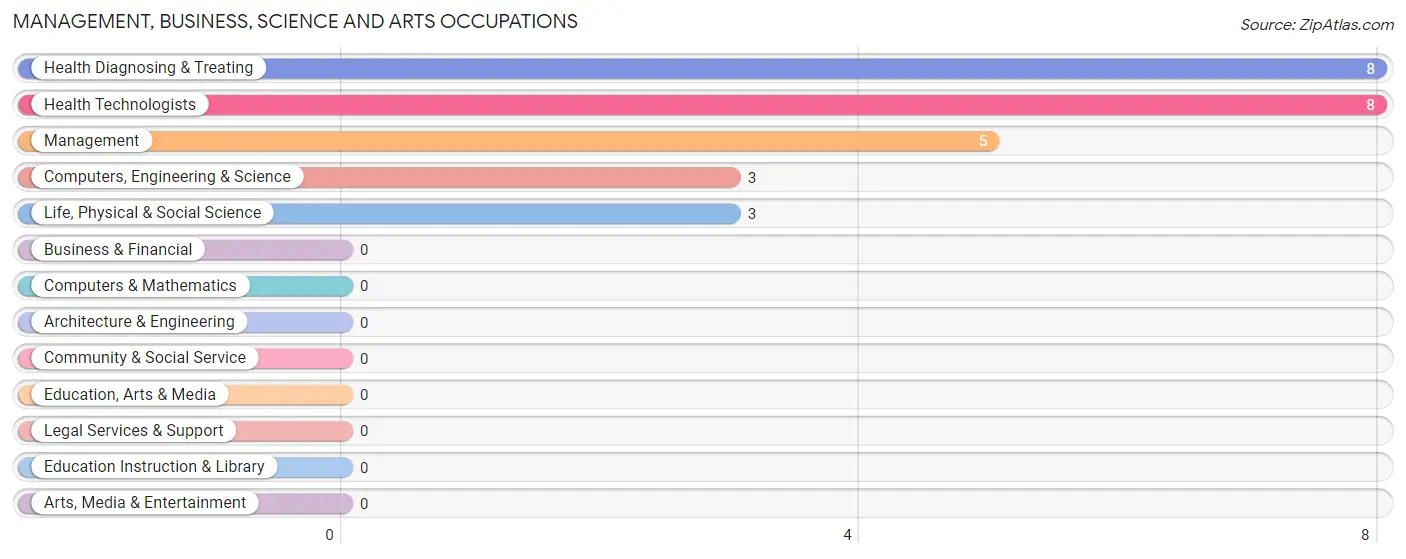
Management, Business, Science and Arts Occupations by Sex
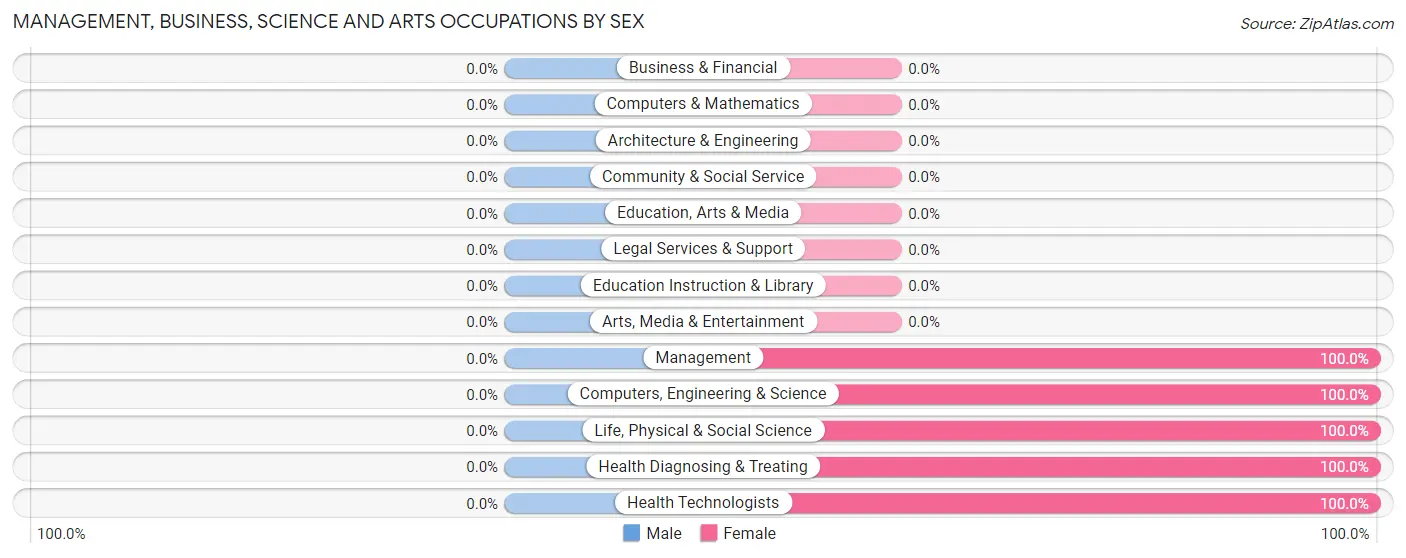
| Occupation | Male | Female |
| Management | 0 (0.0%) | 5 (100.0%) |
| Business & Financial | 0 (0.0%) | 0 (0.0%) |
| Computers, Engineering & Science | 0 (0.0%) | 3 (100.0%) |
| Computers & Mathematics | 0 (0.0%) | 0 (0.0%) |
| Architecture & Engineering | 0 (0.0%) | 0 (0.0%) |
| Life, Physical & Social Science | 0 (0.0%) | 3 (100.0%) |
| Community & Social Service | 0 (0.0%) | 0 (0.0%) |
| Education, Arts & Media | 0 (0.0%) | 0 (0.0%) |
| Legal Services & Support | 0 (0.0%) | 0 (0.0%) |
| Education Instruction & Library | 0 (0.0%) | 0 (0.0%) |
| Arts, Media & Entertainment | 0 (0.0%) | 0 (0.0%) |
| Health Diagnosing & Treating | 0 (0.0%) | 8 (100.0%) |
| Health Technologists | 0 (0.0%) | 8 (100.0%) |
| Total (Category) | 0 (0.0%) | 16 (100.0%) |
| Total (Overall) | 18 (16.8%) | 89 (83.2%) |
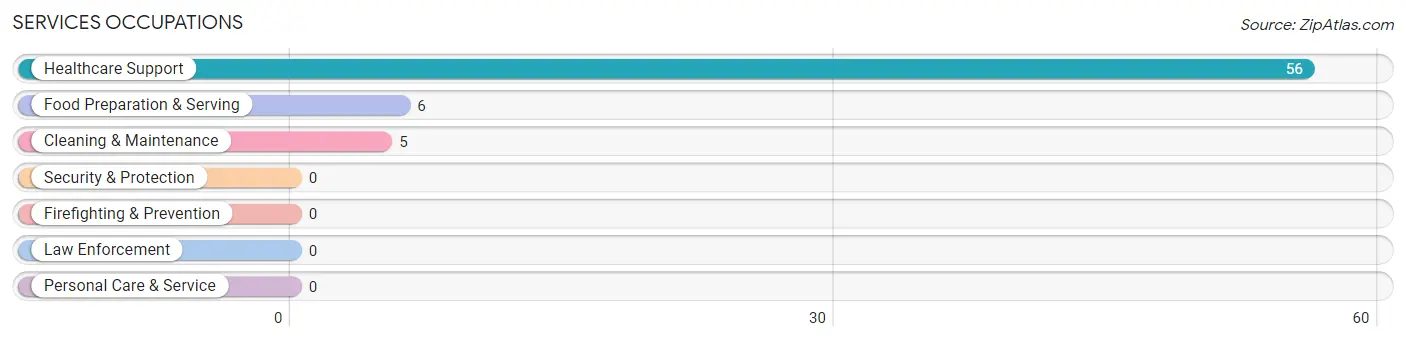
Services Occupations
The most common Services occupations in Maplewood Park are Healthcare Support (56 | 52.3%), Food Preparation & Serving (6 | 5.6%), and Cleaning & Maintenance (5 | 4.7%).
Services Occupations by Sex
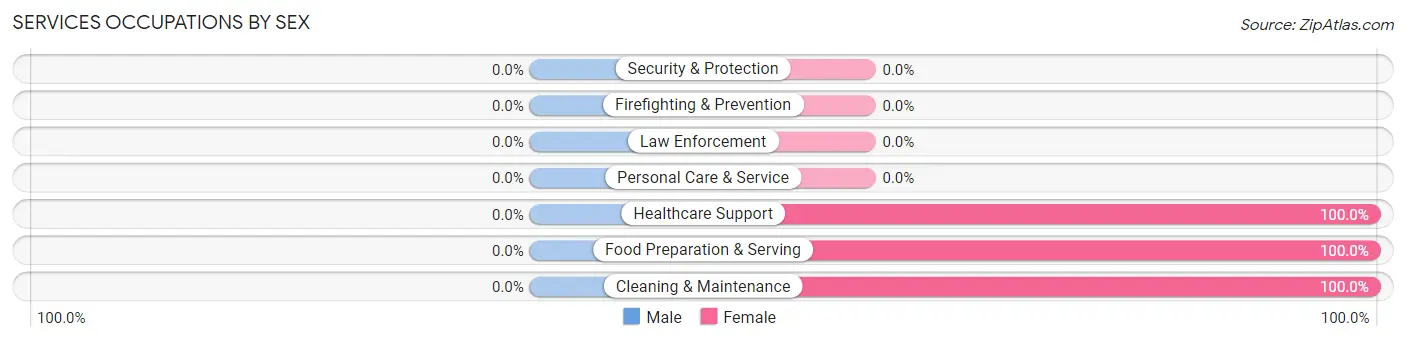
| Occupation | Male | Female |
| Healthcare Support | 0 (0.0%) | 56 (100.0%) |
| Security & Protection | 0 (0.0%) | 0 (0.0%) |
| Firefighting & Prevention | 0 (0.0%) | 0 (0.0%) |
| Law Enforcement | 0 (0.0%) | 0 (0.0%) |
| Food Preparation & Serving | 0 (0.0%) | 6 (100.0%) |
| Cleaning & Maintenance | 0 (0.0%) | 5 (100.0%) |
| Personal Care & Service | 0 (0.0%) | 0 (0.0%) |
| Total (Category) | 0 (0.0%) | 67 (100.0%) |
| Total (Overall) | 18 (16.8%) | 89 (83.2%) |
Sales and Office Occupations
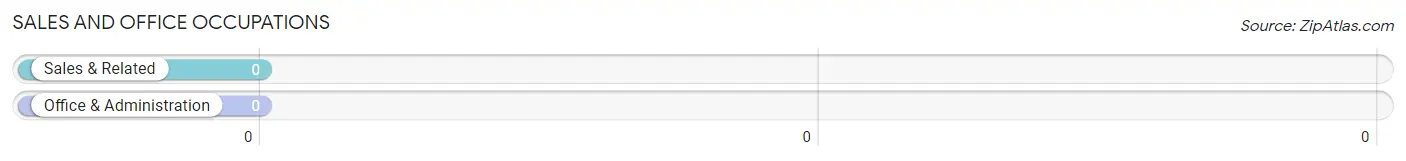
Sales and Office Occupations by Sex
| Occupation | Male | Female |
| Sales & Related | 0 (0.0%) | 0 (0.0%) |
| Office & Administration | 0 (0.0%) | 0 (0.0%) |
| Total (Category) | 0 (0.0%) | 0 (0.0%) |
| Total (Overall) | 18 (16.8%) | 89 (83.2%) |
Natural Resources, Construction and Maintenance Occupations
Natural Resources, Construction and Maintenance Occupations by Sex
| Occupation | Male | Female |
| Farming, Fishing & Forestry | 0 (0.0%) | 0 (0.0%) |
| Construction & Extraction | 0 (0.0%) | 0 (0.0%) |
| Installation, Maintenance & Repair | 0 (0.0%) | 0 (0.0%) |
| Total (Category) | 0 (0.0%) | 0 (0.0%) |
| Total (Overall) | 18 (16.8%) | 89 (83.2%) |
Production, Transportation and Moving Occupations
The most common Production, Transportation and Moving occupations in Maplewood Park are Transportation (15 | 14.0%), Production (6 | 5.6%), and Material Moving (3 | 2.8%).
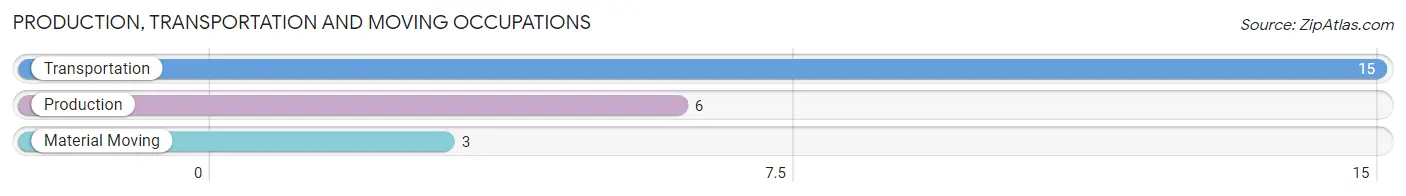
Production, Transportation and Moving Occupations by Sex
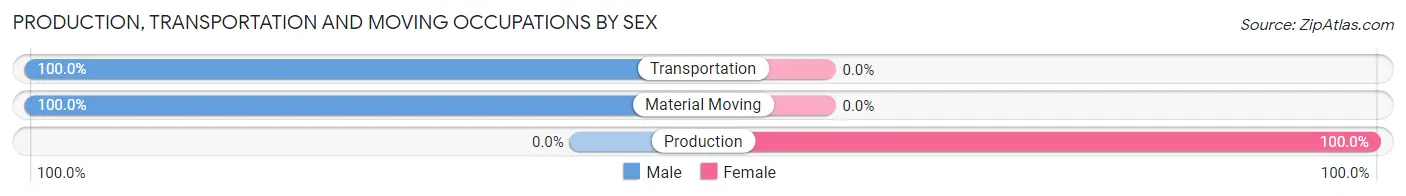
| Occupation | Male | Female |
| Production | 0 (0.0%) | 6 (100.0%) |
| Transportation | 15 (100.0%) | 0 (0.0%) |
| Material Moving | 3 (100.0%) | 0 (0.0%) |
| Total (Category) | 18 (75.0%) | 6 (25.0%) |
| Total (Overall) | 18 (16.8%) | 89 (83.2%) |
Employment Industries by Sex in Maplewood Park
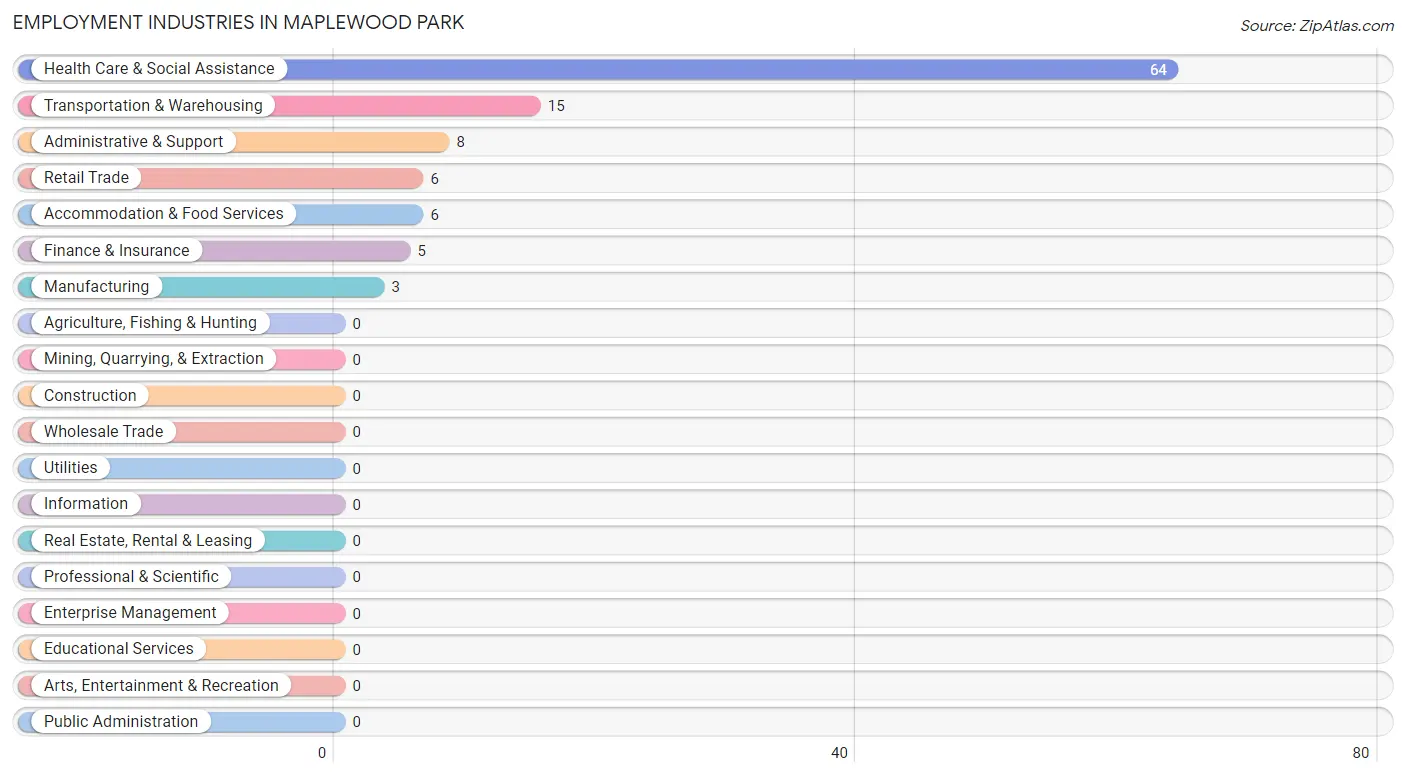
Employment Industries in Maplewood Park
The major employment industries in Maplewood Park include Health Care & Social Assistance (64 | 59.8%), Transportation & Warehousing (15 | 14.0%), Administrative & Support (8 | 7.5%), Retail Trade (6 | 5.6%), and Accommodation & Food Services (6 | 5.6%).
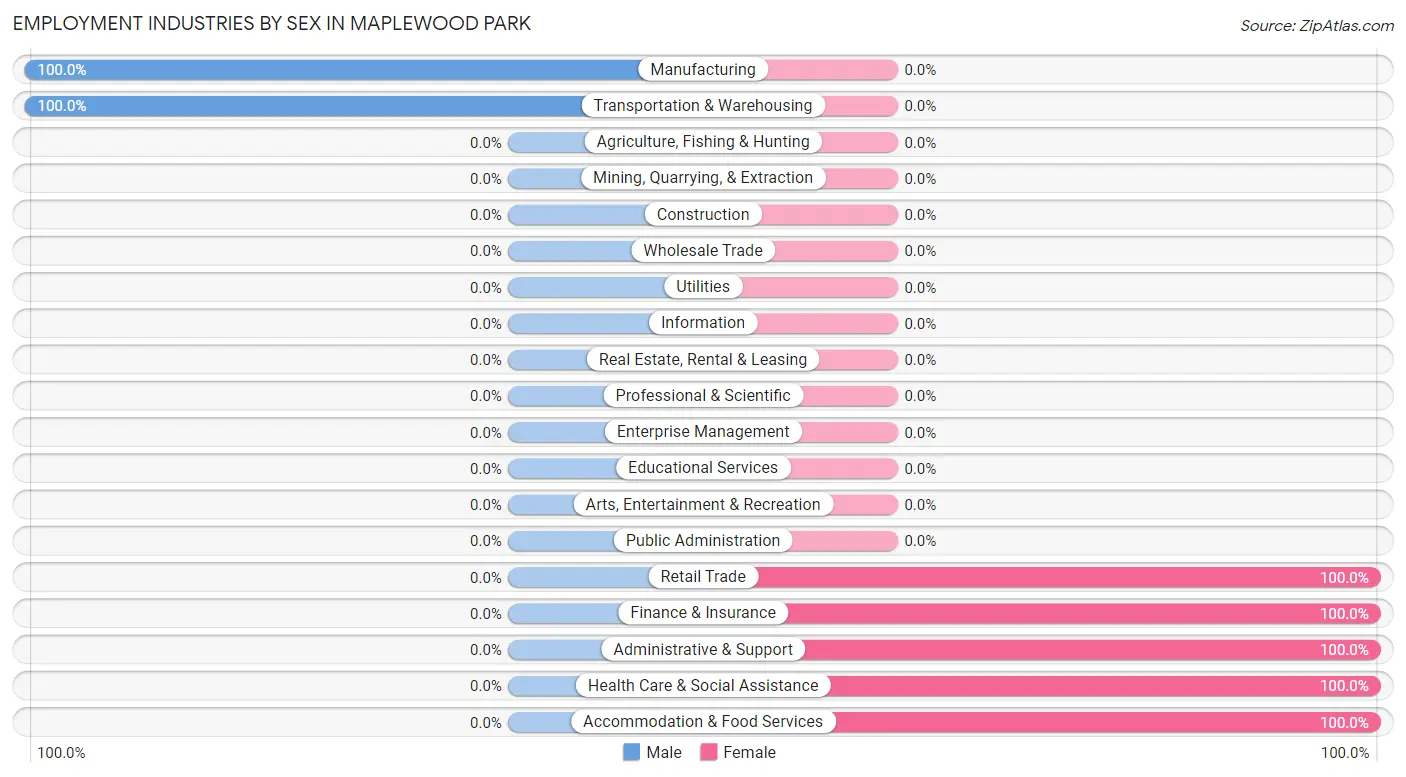
Employment Industries by Sex in Maplewood Park
The Maplewood Park industries that see more men than women are Manufacturing (100.0%), and Transportation & Warehousing (100.0%), whereas the industries that tend to have a higher number of women are Retail Trade (100.0%), Finance & Insurance (100.0%), and Administrative & Support (100.0%).
| Industry | Male | Female |
| Agriculture, Fishing & Hunting | 0 (0.0%) | 0 (0.0%) |
| Mining, Quarrying, & Extraction | 0 (0.0%) | 0 (0.0%) |
| Construction | 0 (0.0%) | 0 (0.0%) |
| Manufacturing | 3 (100.0%) | 0 (0.0%) |
| Wholesale Trade | 0 (0.0%) | 0 (0.0%) |
| Retail Trade | 0 (0.0%) | 6 (100.0%) |
| Transportation & Warehousing | 15 (100.0%) | 0 (0.0%) |
| Utilities | 0 (0.0%) | 0 (0.0%) |
| Information | 0 (0.0%) | 0 (0.0%) |
| Finance & Insurance | 0 (0.0%) | 5 (100.0%) |
| Real Estate, Rental & Leasing | 0 (0.0%) | 0 (0.0%) |
| Professional & Scientific | 0 (0.0%) | 0 (0.0%) |
| Enterprise Management | 0 (0.0%) | 0 (0.0%) |
| Administrative & Support | 0 (0.0%) | 8 (100.0%) |
| Educational Services | 0 (0.0%) | 0 (0.0%) |
| Health Care & Social Assistance | 0 (0.0%) | 64 (100.0%) |
| Arts, Entertainment & Recreation | 0 (0.0%) | 0 (0.0%) |
| Accommodation & Food Services | 0 (0.0%) | 6 (100.0%) |
| Public Administration | 0 (0.0%) | 0 (0.0%) |
| Total | 18 (16.8%) | 89 (83.2%) |
Education in Maplewood Park
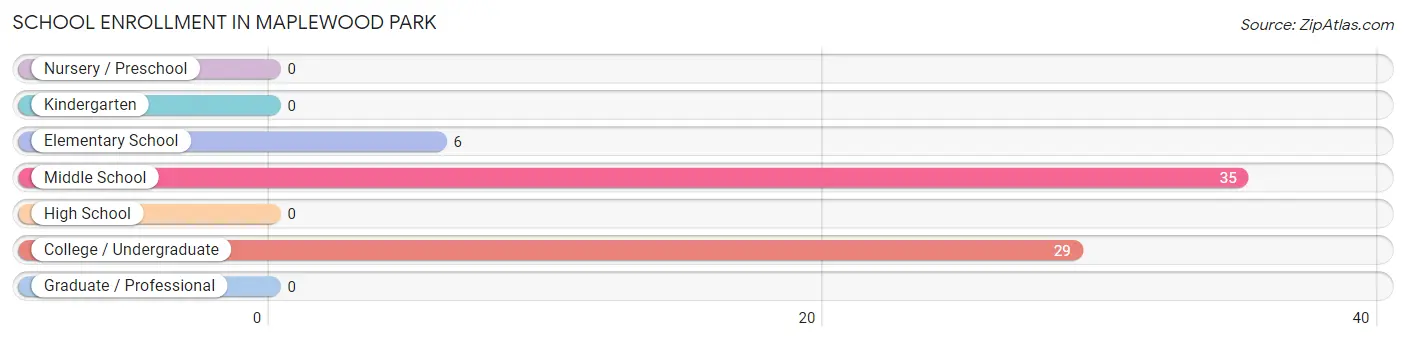
School Enrollment in Maplewood Park
The most common levels of schooling among the 70 students in Maplewood Park are middle school (35 | 50.0%), college / undergraduate (29 | 41.4%), and elementary school (6 | 8.6%).
| School Level | # Students | % Students |
| Nursery / Preschool | 0 | 0.0% |
| Kindergarten | 0 | 0.0% |
| Elementary School | 6 | 8.6% |
| Middle School | 35 | 50.0% |
| High School | 0 | 0.0% |
| College / Undergraduate | 29 | 41.4% |
| Graduate / Professional | 0 | 0.0% |
| Total | 70 | 100.0% |
School Enrollment by Age by Funding Source in Maplewood Park
Out of a total of 70 students who are enrolled in schools in Maplewood Park, 29 (41.4%) attend a private institution, while the remaining 41 (58.6%) are enrolled in public schools. The age group of 20 to 24 year olds has the highest likelihood of being enrolled in private schools, with 29 (100.0% in the age bracket) enrolled. Conversely, the age group of 5 to 9 year old has the lowest likelihood of being enrolled in a private school, with 6 (100.0% in the age bracket) attending a public institution.
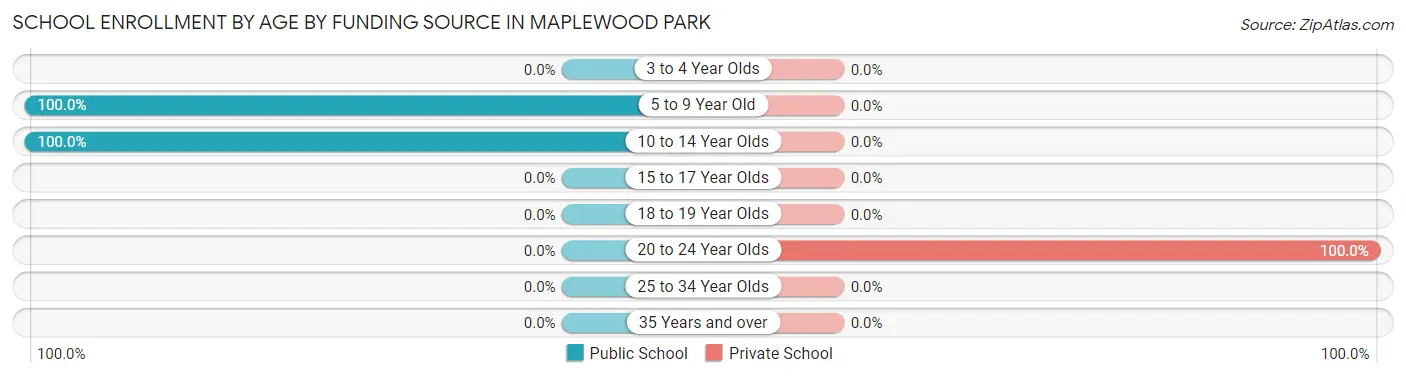
| Age Bracket | Public School | Private School |
| 3 to 4 Year Olds | 0 (0.0%) | 0 (0.0%) |
| 5 to 9 Year Old | 6 (100.0%) | 0 (0.0%) |
| 10 to 14 Year Olds | 35 (100.0%) | 0 (0.0%) |
| 15 to 17 Year Olds | 0 (0.0%) | 0 (0.0%) |
| 18 to 19 Year Olds | 0 (0.0%) | 0 (0.0%) |
| 20 to 24 Year Olds | 0 (0.0%) | 29 (100.0%) |
| 25 to 34 Year Olds | 0 (0.0%) | 0 (0.0%) |
| 35 Years and over | 0 (0.0%) | 0 (0.0%) |
| Total | 41 (58.6%) | 29 (41.4%) |
Educational Attainment by Field of Study in Maplewood Park
Business (12 | 42.9%), science & technology (11 | 39.3%), and education (5 | 17.9%) are the most common fields of study among 28 individuals in Maplewood Park who have obtained a bachelor's degree or higher.
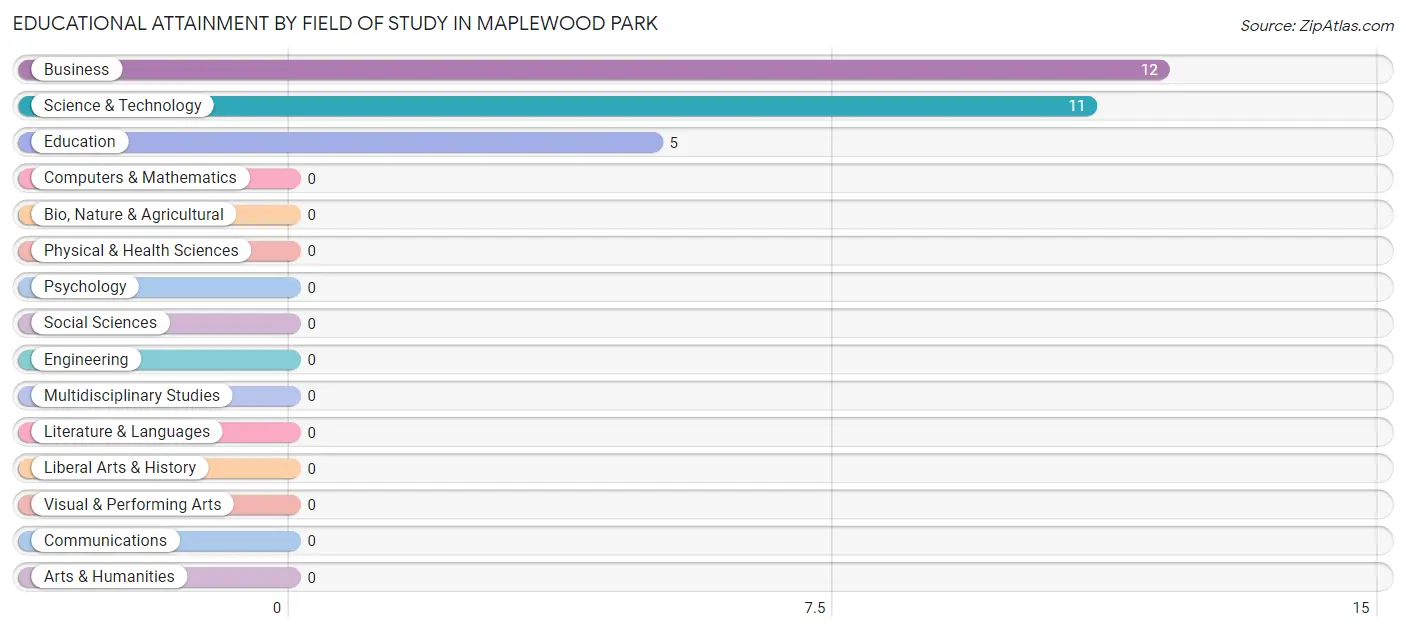
| Field of Study | # Graduates | % Graduates |
| Computers & Mathematics | 0 | 0.0% |
| Bio, Nature & Agricultural | 0 | 0.0% |
| Physical & Health Sciences | 0 | 0.0% |
| Psychology | 0 | 0.0% |
| Social Sciences | 0 | 0.0% |
| Engineering | 0 | 0.0% |
| Multidisciplinary Studies | 0 | 0.0% |
| Science & Technology | 11 | 39.3% |
| Business | 12 | 42.9% |
| Education | 5 | 17.9% |
| Literature & Languages | 0 | 0.0% |
| Liberal Arts & History | 0 | 0.0% |
| Visual & Performing Arts | 0 | 0.0% |
| Communications | 0 | 0.0% |
| Arts & Humanities | 0 | 0.0% |
| Total | 28 | 100.0% |
Transportation & Commute in Maplewood Park
Vehicle Availability by Sex in Maplewood Park
The most prevalent vehicle ownership categories in Maplewood Park are males with 2 vehicles (15, accounting for 83.3%) and females with 2 vehicles (40, making up 16.9%).
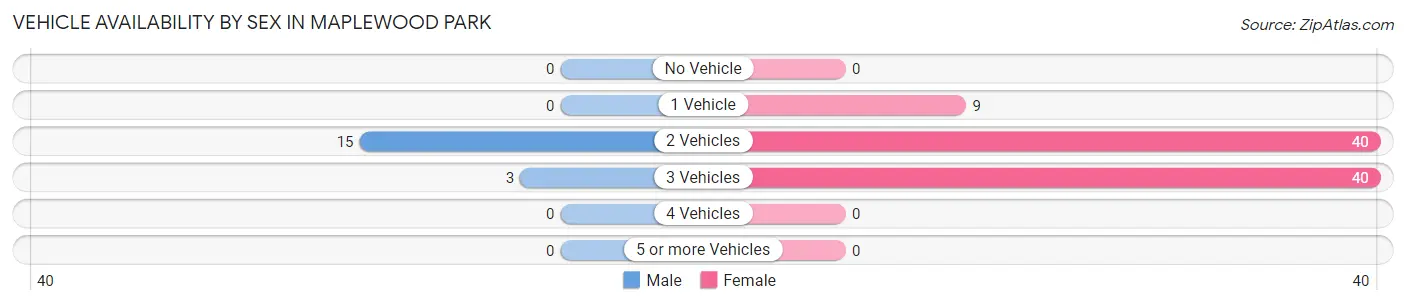
| Vehicles Available | Male | Female |
| No Vehicle | 0 (0.0%) | 0 (0.0%) |
| 1 Vehicle | 0 (0.0%) | 9 (10.1%) |
| 2 Vehicles | 15 (83.3%) | 40 (44.9%) |
| 3 Vehicles | 3 (16.7%) | 40 (44.9%) |
| 4 Vehicles | 0 (0.0%) | 0 (0.0%) |
| 5 or more Vehicles | 0 (0.0%) | 0 (0.0%) |
| Total | 18 (100.0%) | 89 (100.0%) |
Commute Time in Maplewood Park
The most frequently occuring commute durations in Maplewood Park are 20 to 24 minutes (32 commuters, 29.9%), 25 to 29 minutes (32 commuters, 29.9%), and 45 to 59 minutes (15 commuters, 14.0%).
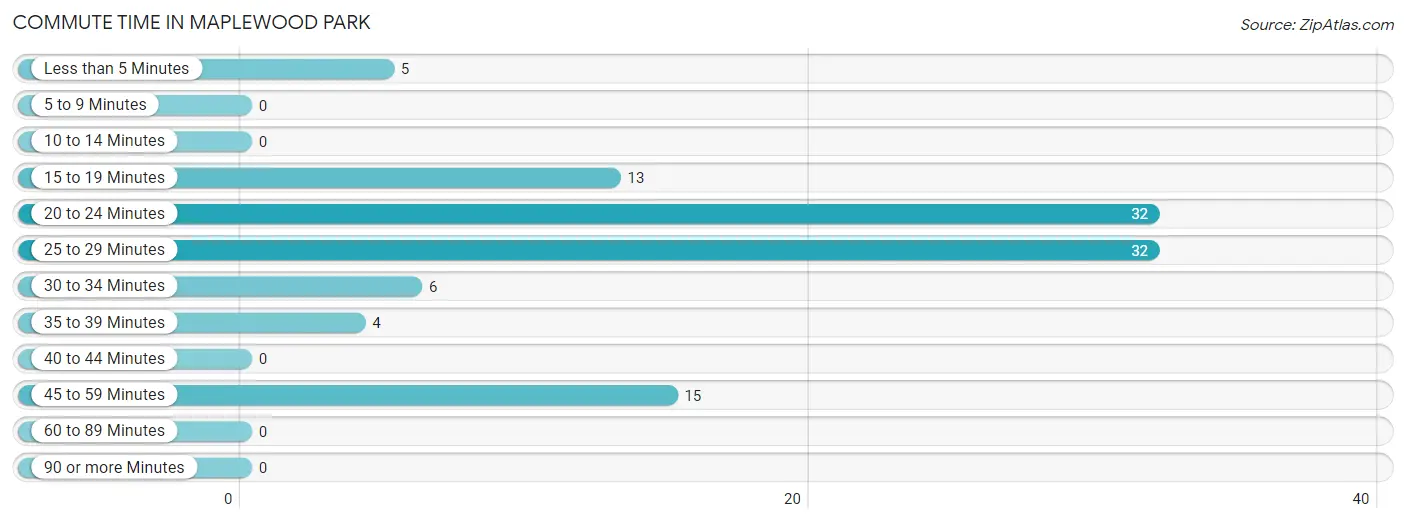
| Commute Time | # Commuters | % Commuters |
| Less than 5 Minutes | 5 | 4.7% |
| 5 to 9 Minutes | 0 | 0.0% |
| 10 to 14 Minutes | 0 | 0.0% |
| 15 to 19 Minutes | 13 | 12.1% |
| 20 to 24 Minutes | 32 | 29.9% |
| 25 to 29 Minutes | 32 | 29.9% |
| 30 to 34 Minutes | 6 | 5.6% |
| 35 to 39 Minutes | 4 | 3.7% |
| 40 to 44 Minutes | 0 | 0.0% |
| 45 to 59 Minutes | 15 | 14.0% |
| 60 to 89 Minutes | 0 | 0.0% |
| 90 or more Minutes | 0 | 0.0% |
Commute Time by Sex in Maplewood Park
The most common commute times in Maplewood Park are 45 to 59 minutes (15 commuters, 83.3%) for males and 25 to 29 minutes (32 commuters, 36.0%) for females.
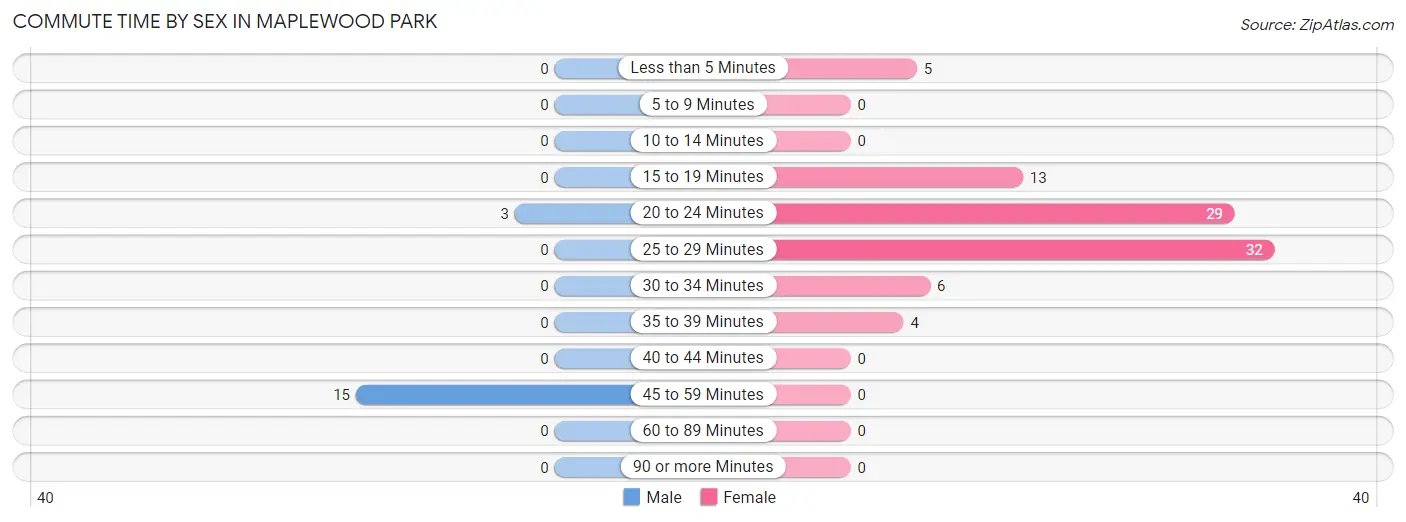
| Commute Time | Male | Female |
| Less than 5 Minutes | 0 (0.0%) | 5 (5.6%) |
| 5 to 9 Minutes | 0 (0.0%) | 0 (0.0%) |
| 10 to 14 Minutes | 0 (0.0%) | 0 (0.0%) |
| 15 to 19 Minutes | 0 (0.0%) | 13 (14.6%) |
| 20 to 24 Minutes | 3 (16.7%) | 29 (32.6%) |
| 25 to 29 Minutes | 0 (0.0%) | 32 (36.0%) |
| 30 to 34 Minutes | 0 (0.0%) | 6 (6.7%) |
| 35 to 39 Minutes | 0 (0.0%) | 4 (4.5%) |
| 40 to 44 Minutes | 0 (0.0%) | 0 (0.0%) |
| 45 to 59 Minutes | 15 (83.3%) | 0 (0.0%) |
| 60 to 89 Minutes | 0 (0.0%) | 0 (0.0%) |
| 90 or more Minutes | 0 (0.0%) | 0 (0.0%) |
Time of Departure to Work by Sex in Maplewood Park
The most frequent times of departure to work in Maplewood Park are 12:00 AM to 4:59 AM (15, 83.3%) for males and 7:30 AM to 7:59 AM (41, 46.1%) for females.
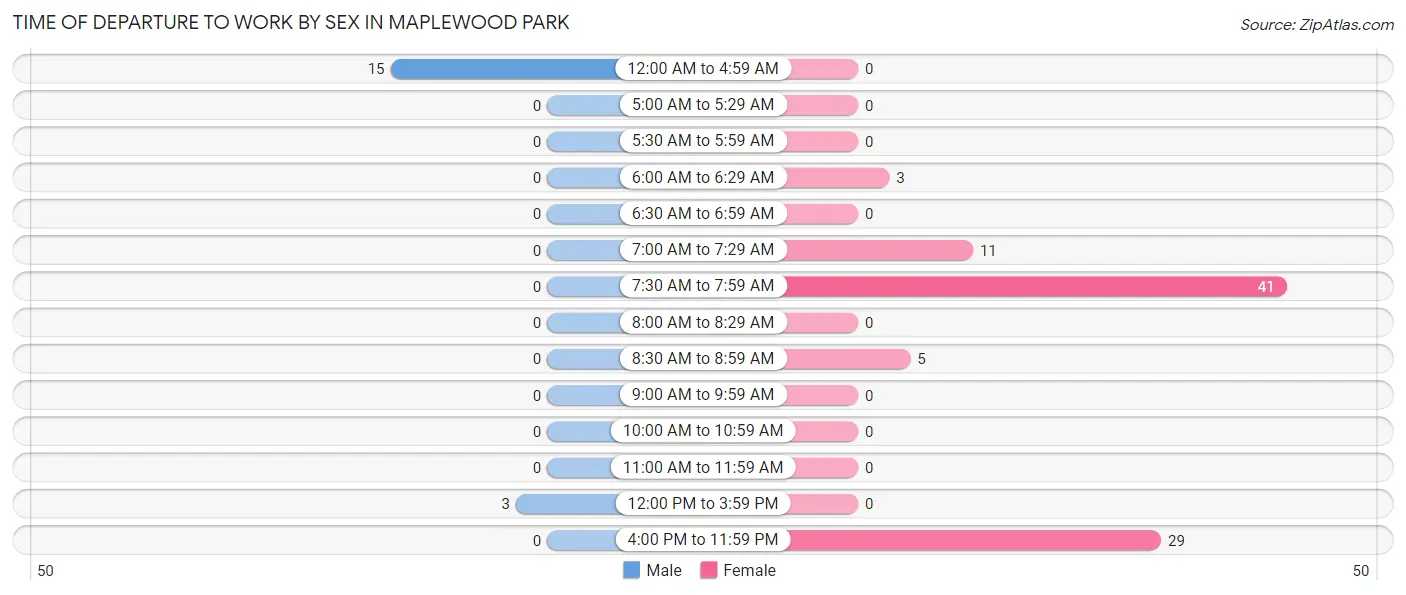
| Time of Departure | Male | Female |
| 12:00 AM to 4:59 AM | 15 (83.3%) | 0 (0.0%) |
| 5:00 AM to 5:29 AM | 0 (0.0%) | 0 (0.0%) |
| 5:30 AM to 5:59 AM | 0 (0.0%) | 0 (0.0%) |
| 6:00 AM to 6:29 AM | 0 (0.0%) | 3 (3.4%) |
| 6:30 AM to 6:59 AM | 0 (0.0%) | 0 (0.0%) |
| 7:00 AM to 7:29 AM | 0 (0.0%) | 11 (12.4%) |
| 7:30 AM to 7:59 AM | 0 (0.0%) | 41 (46.1%) |
| 8:00 AM to 8:29 AM | 0 (0.0%) | 0 (0.0%) |
| 8:30 AM to 8:59 AM | 0 (0.0%) | 5 (5.6%) |
| 9:00 AM to 9:59 AM | 0 (0.0%) | 0 (0.0%) |
| 10:00 AM to 10:59 AM | 0 (0.0%) | 0 (0.0%) |
| 11:00 AM to 11:59 AM | 0 (0.0%) | 0 (0.0%) |
| 12:00 PM to 3:59 PM | 3 (16.7%) | 0 (0.0%) |
| 4:00 PM to 11:59 PM | 0 (0.0%) | 29 (32.6%) |
| Total | 18 (100.0%) | 89 (100.0%) |
Housing Occupancy in Maplewood Park
Occupancy by Ownership in Maplewood Park
Of the total 97 dwellings in Maplewood Park, owner-occupied units account for 97 (100.0%), while renter-occupied units make up 0 (0.0%).
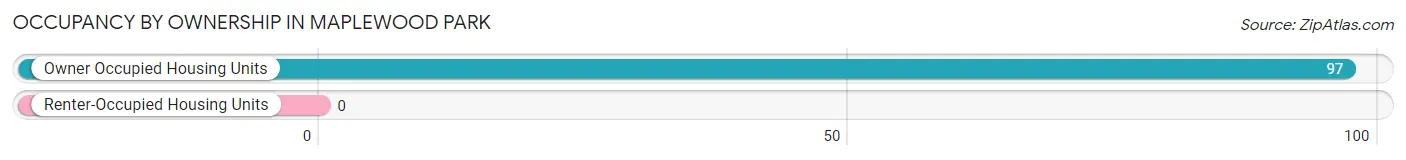
| Occupancy | # Housing Units | % Housing Units |
| Owner Occupied Housing Units | 97 | 100.0% |
| Renter-Occupied Housing Units | 0 | 0.0% |
| Total Occupied Housing Units | 97 | 100.0% |
Occupancy by Household Size in Maplewood Park
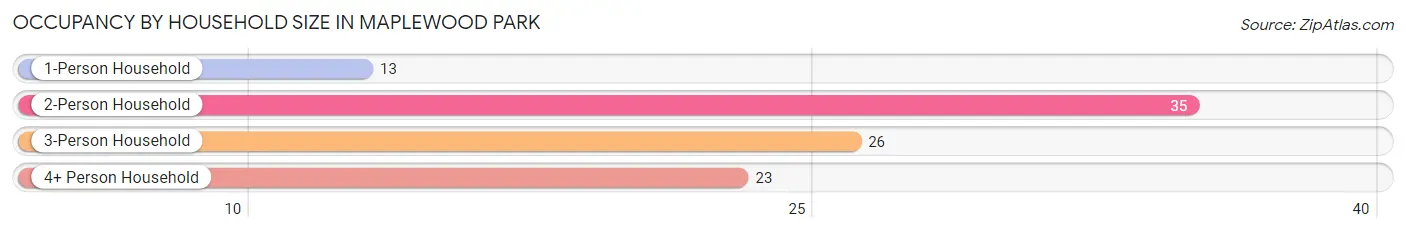
| Household Size | # Housing Units | % Housing Units |
| 1-Person Household | 13 | 13.4% |
| 2-Person Household | 35 | 36.1% |
| 3-Person Household | 26 | 26.8% |
| 4+ Person Household | 23 | 23.7% |
| Total Housing Units | 97 | 100.0% |
Occupancy by Ownership by Household Size in Maplewood Park
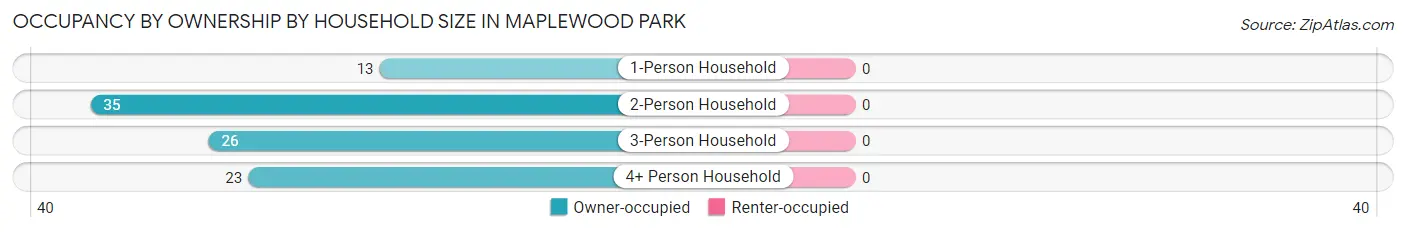
| Household Size | Owner-occupied | Renter-occupied |
| 1-Person Household | 13 (100.0%) | 0 (0.0%) |
| 2-Person Household | 35 (100.0%) | 0 (0.0%) |
| 3-Person Household | 26 (100.0%) | 0 (0.0%) |
| 4+ Person Household | 23 (100.0%) | 0 (0.0%) |
| Total Housing Units | 97 (100.0%) | 0 (0.0%) |
Occupancy by Educational Attainment in Maplewood Park
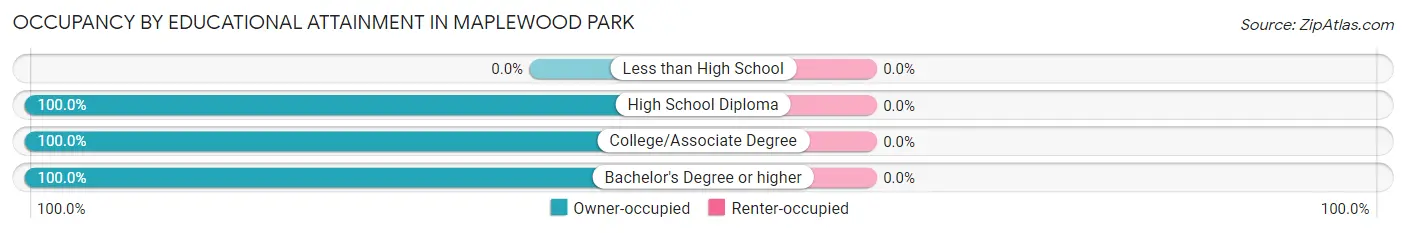
| Household Size | Owner-occupied | Renter-occupied |
| Less than High School | 0 (0.0%) | 0 (0.0%) |
| High School Diploma | 24 (100.0%) | 0 (0.0%) |
| College/Associate Degree | 48 (100.0%) | 0 (0.0%) |
| Bachelor's Degree or higher | 25 (100.0%) | 0 (0.0%) |
Occupancy by Age of Householder in Maplewood Park
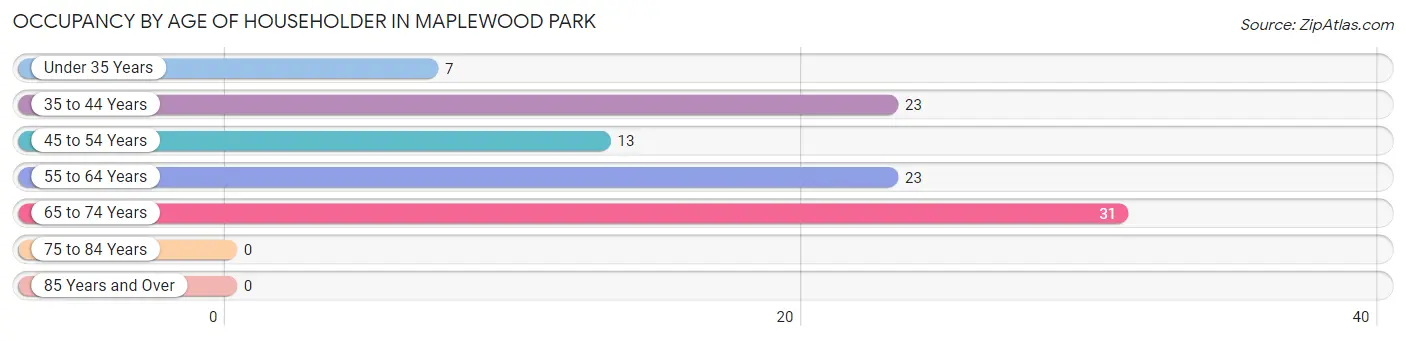
| Age Bracket | # Households | % Households |
| Under 35 Years | 7 | 7.2% |
| 35 to 44 Years | 23 | 23.7% |
| 45 to 54 Years | 13 | 13.4% |
| 55 to 64 Years | 23 | 23.7% |
| 65 to 74 Years | 31 | 32.0% |
| 75 to 84 Years | 0 | 0.0% |
| 85 Years and Over | 0 | 0.0% |
| Total | 97 | 100.0% |
Housing Finances in Maplewood Park
Median Income by Occupancy in Maplewood Park
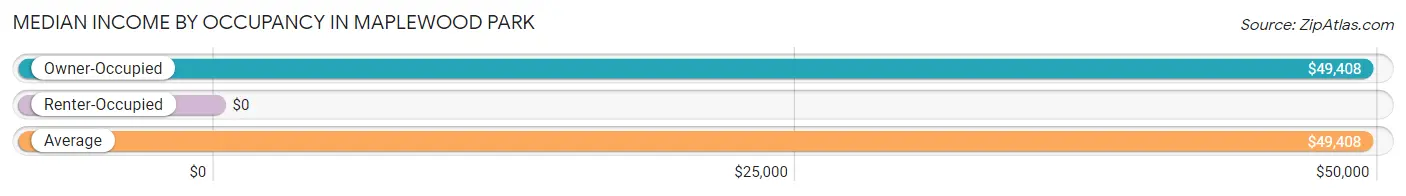
| Occupancy Type | # Households | Median Income |
| Owner-Occupied | 97 (100.0%) | $49,408 |
| Renter-Occupied | 0 (0.0%) | $0 |
| Average | 97 (100.0%) | $49,408 |
Occupancy by Householder Income Bracket in Maplewood Park
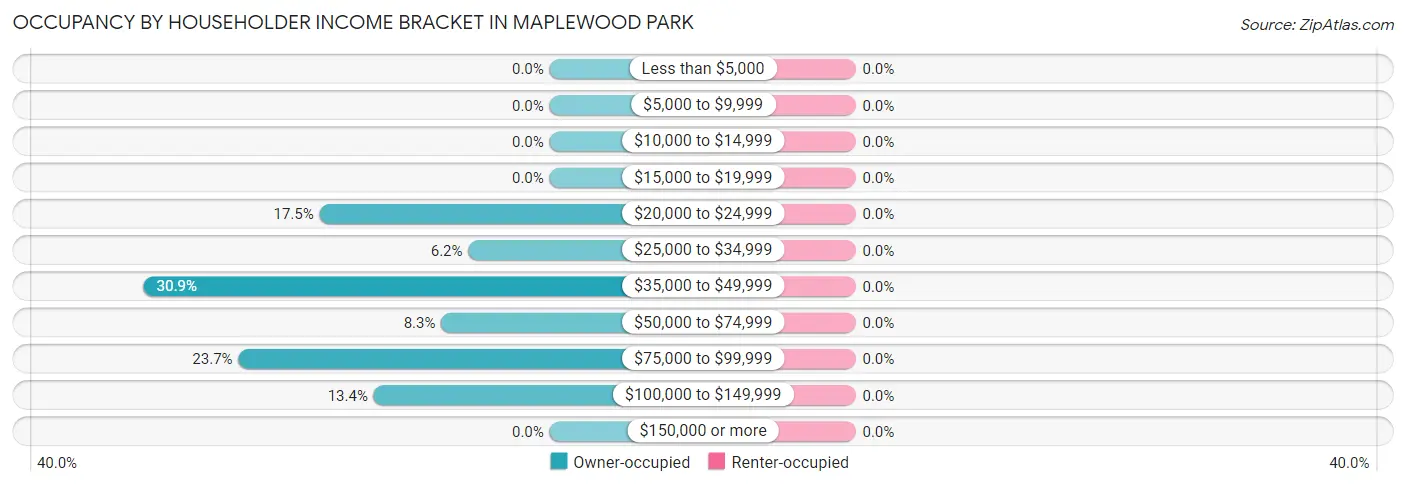
| Income Bracket | Owner-occupied | Renter-occupied |
| Less than $5,000 | 0 (0.0%) | 0 (0.0%) |
| $5,000 to $9,999 | 0 (0.0%) | 0 (0.0%) |
| $10,000 to $14,999 | 0 (0.0%) | 0 (0.0%) |
| $15,000 to $19,999 | 0 (0.0%) | 0 (0.0%) |
| $20,000 to $24,999 | 17 (17.5%) | 0 (0.0%) |
| $25,000 to $34,999 | 6 (6.2%) | 0 (0.0%) |
| $35,000 to $49,999 | 30 (30.9%) | 0 (0.0%) |
| $50,000 to $74,999 | 8 (8.3%) | 0 (0.0%) |
| $75,000 to $99,999 | 23 (23.7%) | 0 (0.0%) |
| $100,000 to $149,999 | 13 (13.4%) | 0 (0.0%) |
| $150,000 or more | 0 (0.0%) | 0 (0.0%) |
| Total | 97 (100.0%) | 0 (0.0%) |
Monthly Housing Cost Tiers in Maplewood Park
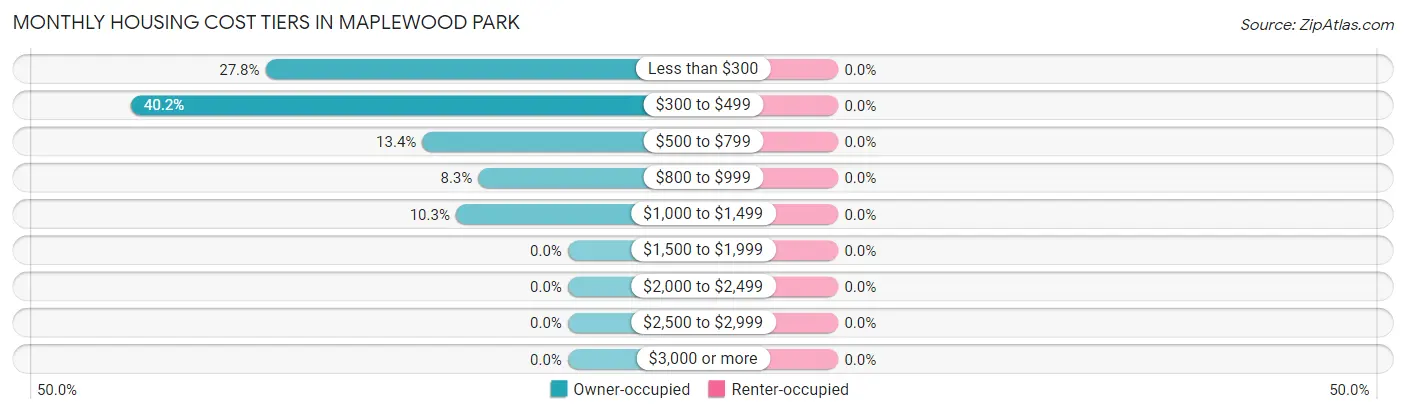
| Monthly Cost | Owner-occupied | Renter-occupied |
| Less than $300 | 27 (27.8%) | 0 (0.0%) |
| $300 to $499 | 39 (40.2%) | 0 (0.0%) |
| $500 to $799 | 13 (13.4%) | 0 (0.0%) |
| $800 to $999 | 8 (8.3%) | 0 (0.0%) |
| $1,000 to $1,499 | 10 (10.3%) | 0 (0.0%) |
| $1,500 to $1,999 | 0 (0.0%) | 0 (0.0%) |
| $2,000 to $2,499 | 0 (0.0%) | 0 (0.0%) |
| $2,500 to $2,999 | 0 (0.0%) | 0 (0.0%) |
| $3,000 or more | 0 (0.0%) | 0 (0.0%) |
| Total | 97 (100.0%) | 0 (0.0%) |
Physical Housing Characteristics in Maplewood Park
Housing Structures in Maplewood Park
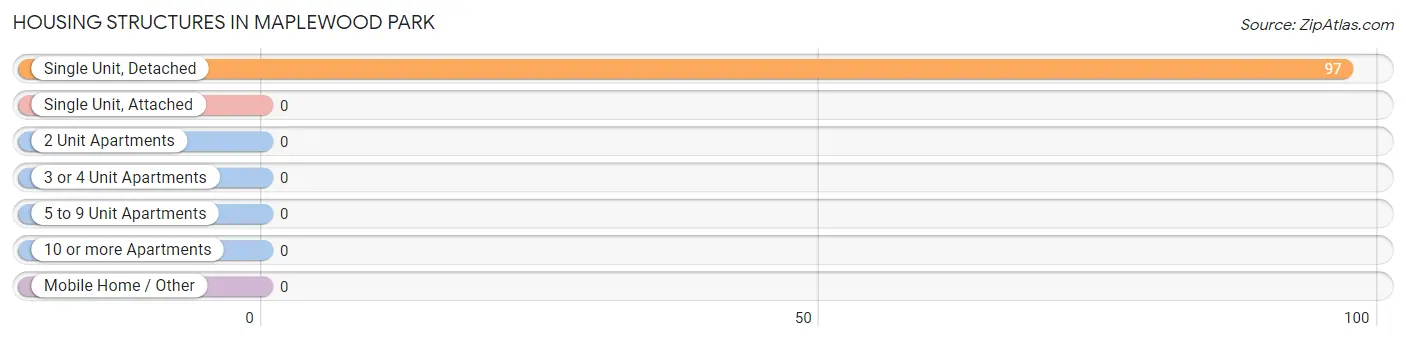
| Structure Type | # Housing Units | % Housing Units |
| Single Unit, Detached | 97 | 100.0% |
| Single Unit, Attached | 0 | 0.0% |
| 2 Unit Apartments | 0 | 0.0% |
| 3 or 4 Unit Apartments | 0 | 0.0% |
| 5 to 9 Unit Apartments | 0 | 0.0% |
| 10 or more Apartments | 0 | 0.0% |
| Mobile Home / Other | 0 | 0.0% |
| Total | 97 | 100.0% |
Housing Structures by Occupancy in Maplewood Park
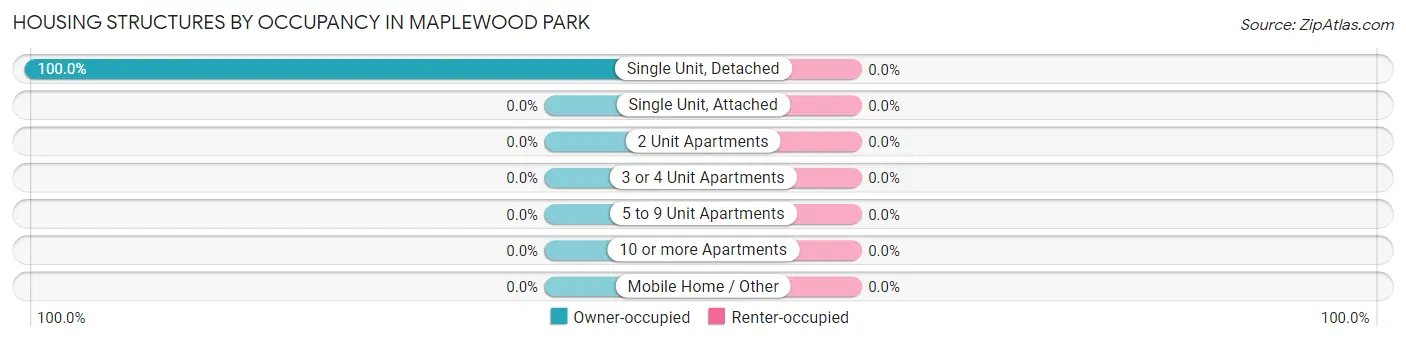
| Structure Type | Owner-occupied | Renter-occupied |
| Single Unit, Detached | 97 (100.0%) | 0 (0.0%) |
| Single Unit, Attached | 0 (0.0%) | 0 (0.0%) |
| 2 Unit Apartments | 0 (0.0%) | 0 (0.0%) |
| 3 or 4 Unit Apartments | 0 (0.0%) | 0 (0.0%) |
| 5 to 9 Unit Apartments | 0 (0.0%) | 0 (0.0%) |
| 10 or more Apartments | 0 (0.0%) | 0 (0.0%) |
| Mobile Home / Other | 0 (0.0%) | 0 (0.0%) |
| Total | 97 (100.0%) | 0 (0.0%) |
Housing Structures by Number of Rooms in Maplewood Park
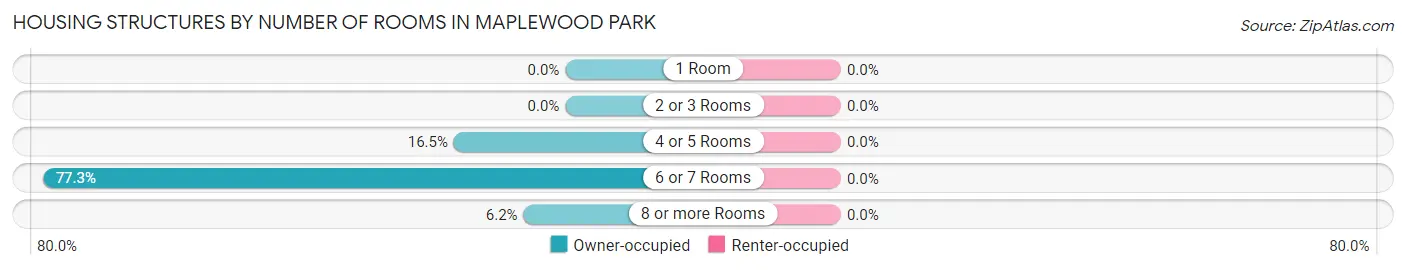
| Number of Rooms | Owner-occupied | Renter-occupied |
| 1 Room | 0 (0.0%) | 0 (0.0%) |
| 2 or 3 Rooms | 0 (0.0%) | 0 (0.0%) |
| 4 or 5 Rooms | 16 (16.5%) | 0 (0.0%) |
| 6 or 7 Rooms | 75 (77.3%) | 0 (0.0%) |
| 8 or more Rooms | 6 (6.2%) | 0 (0.0%) |
| Total | 97 (100.0%) | 0 (0.0%) |
Housing Structure by Heating Type in Maplewood Park
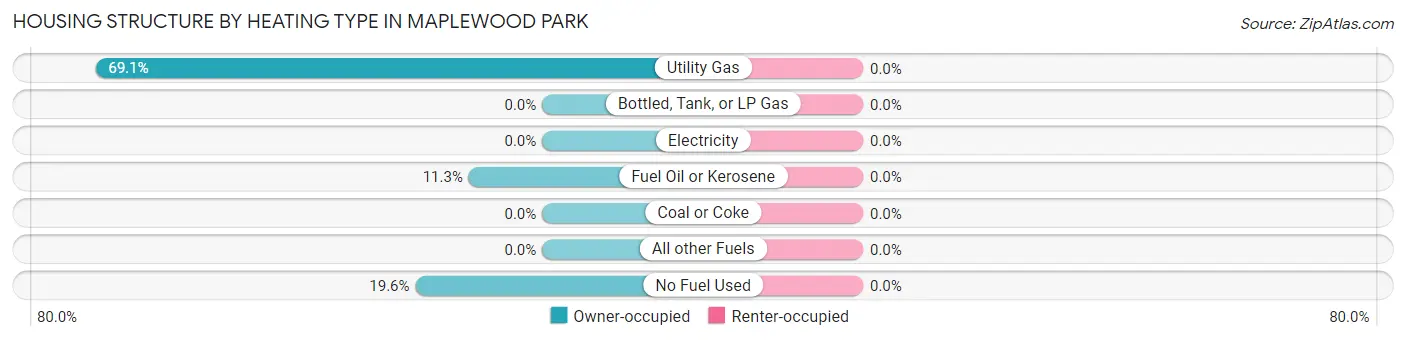
| Heating Type | Owner-occupied | Renter-occupied |
| Utility Gas | 67 (69.1%) | 0 (0.0%) |
| Bottled, Tank, or LP Gas | 0 (0.0%) | 0 (0.0%) |
| Electricity | 0 (0.0%) | 0 (0.0%) |
| Fuel Oil or Kerosene | 11 (11.3%) | 0 (0.0%) |
| Coal or Coke | 0 (0.0%) | 0 (0.0%) |
| All other Fuels | 0 (0.0%) | 0 (0.0%) |
| No Fuel Used | 19 (19.6%) | 0 (0.0%) |
| Total | 97 (100.0%) | 0 (0.0%) |
Household Vehicle Usage in Maplewood Park
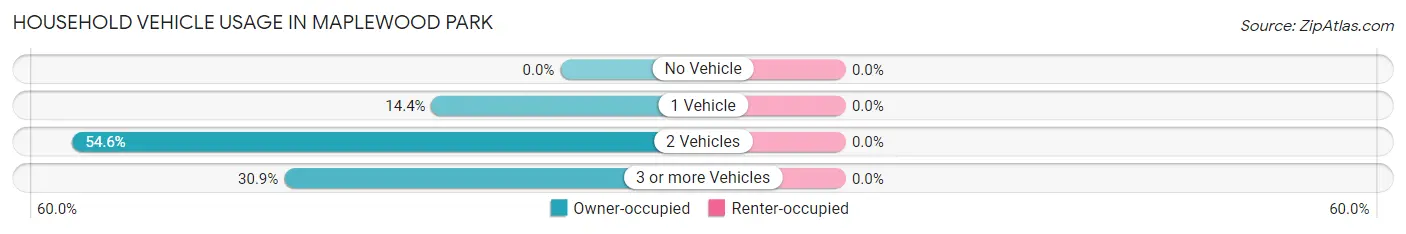
| Vehicles per Household | Owner-occupied | Renter-occupied |
| No Vehicle | 0 (0.0%) | 0 (0.0%) |
| 1 Vehicle | 14 (14.4%) | 0 (0.0%) |
| 2 Vehicles | 53 (54.6%) | 0 (0.0%) |
| 3 or more Vehicles | 30 (30.9%) | 0 (0.0%) |
| Total | 97 (100.0%) | 0 (0.0%) |
Real Estate & Mortgages in Maplewood Park
Real Estate and Mortgage Overview in Maplewood Park
| Characteristic | Without Mortgage | With Mortgage |
| Housing Units | 71 | 26 |
| Median Property Value | - | - |
| Median Household Income | $67,656 | $0 |
| Monthly Housing Costs | $321 | $0 |
| Real Estate Taxes | - | - |
Property Value by Mortgage Status in Maplewood Park
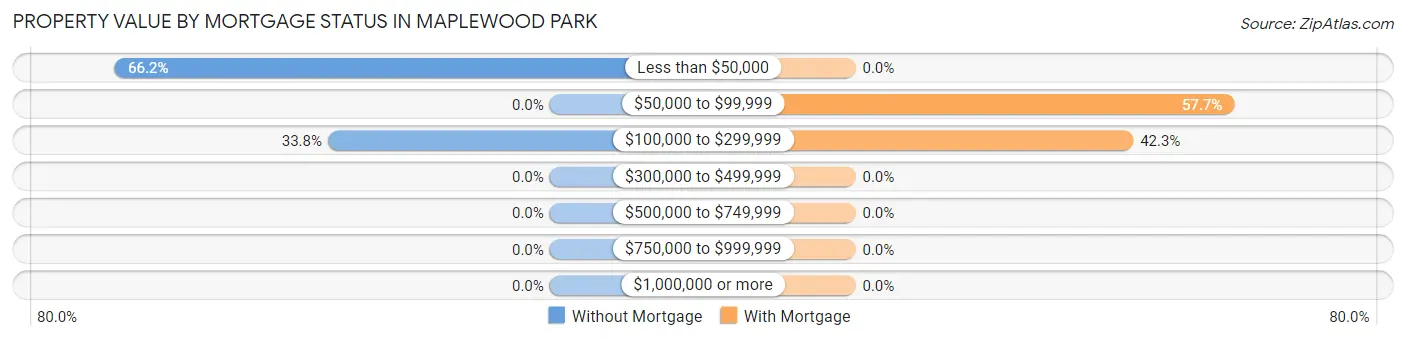
| Property Value | Without Mortgage | With Mortgage |
| Less than $50,000 | 47 (66.2%) | 0 (0.0%) |
| $50,000 to $99,999 | 0 (0.0%) | 15 (57.7%) |
| $100,000 to $299,999 | 24 (33.8%) | 11 (42.3%) |
| $300,000 to $499,999 | 0 (0.0%) | 0 (0.0%) |
| $500,000 to $749,999 | 0 (0.0%) | 0 (0.0%) |
| $750,000 to $999,999 | 0 (0.0%) | 0 (0.0%) |
| $1,000,000 or more | 0 (0.0%) | 0 (0.0%) |
| Total | 71 (100.0%) | 26 (100.0%) |
Household Income by Mortgage Status in Maplewood Park
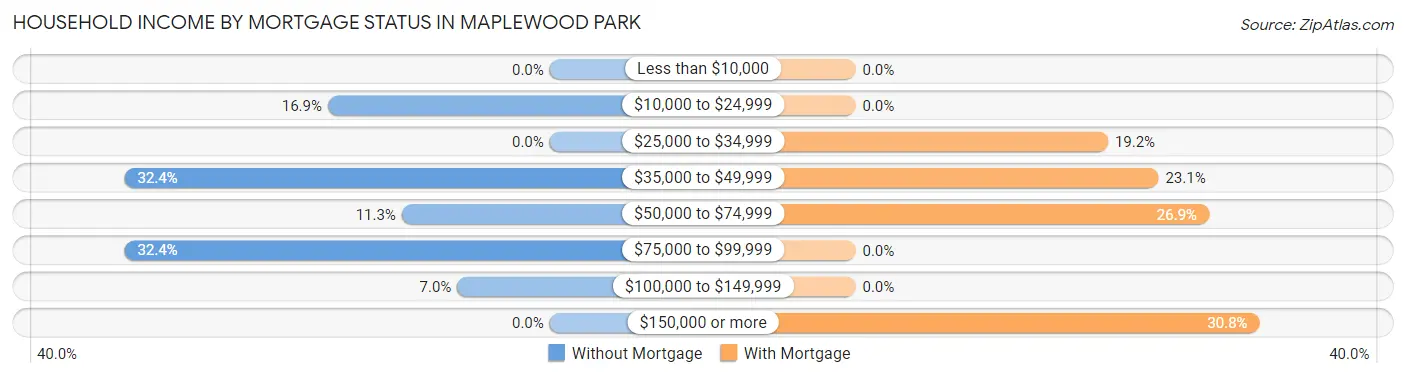
| Household Income | Without Mortgage | With Mortgage |
| Less than $10,000 | 0 (0.0%) | 0 (0.0%) |
| $10,000 to $24,999 | 12 (16.9%) | 0 (0.0%) |
| $25,000 to $34,999 | 0 (0.0%) | 5 (19.2%) |
| $35,000 to $49,999 | 23 (32.4%) | 6 (23.1%) |
| $50,000 to $74,999 | 8 (11.3%) | 7 (26.9%) |
| $75,000 to $99,999 | 23 (32.4%) | 0 (0.0%) |
| $100,000 to $149,999 | 5 (7.0%) | 0 (0.0%) |
| $150,000 or more | 0 (0.0%) | 8 (30.8%) |
| Total | 71 (100.0%) | 26 (100.0%) |
Property Value to Household Income Ratio in Maplewood Park
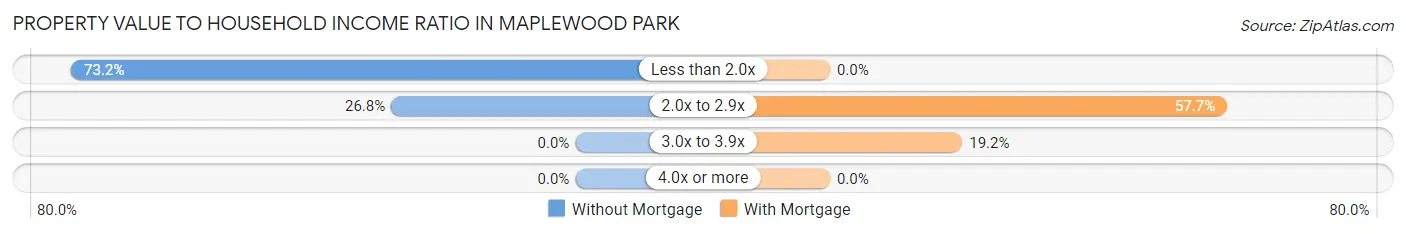
| Value-to-Income Ratio | Without Mortgage | With Mortgage |
| Less than 2.0x | 52 (73.2%) | 0 (0.0%) |
| 2.0x to 2.9x | 19 (26.8%) | 15 (57.7%) |
| 3.0x to 3.9x | 0 (0.0%) | 5 (19.2%) |
| 4.0x or more | 0 (0.0%) | 0 (0.0%) |
| Total | 71 (100.0%) | 26 (100.0%) |
Real Estate Taxes by Mortgage Status in Maplewood Park
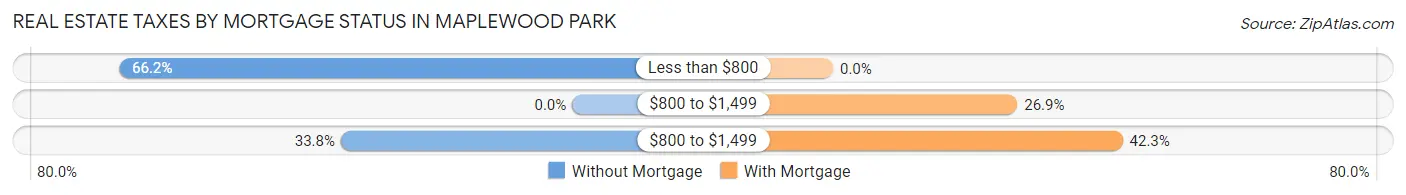
| Property Taxes | Without Mortgage | With Mortgage |
| Less than $800 | 47 (66.2%) | 0 (0.0%) |
| $800 to $1,499 | 0 (0.0%) | 7 (26.9%) |
| $800 to $1,499 | 24 (33.8%) | 11 (42.3%) |
| Total | 71 (100.0%) | 26 (100.0%) |
Health & Disability in Maplewood Park
Health Insurance Coverage by Age in Maplewood Park
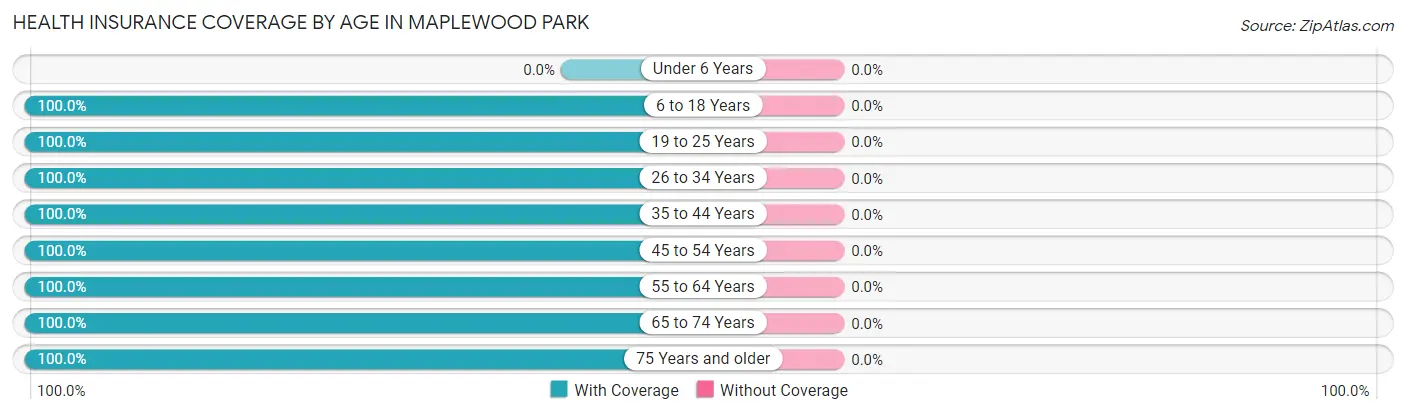
| Age Bracket | With Coverage | Without Coverage |
| Under 6 Years | 0 (0.0%) | 0 (0.0%) |
| 6 to 18 Years | 41 (100.0%) | 0 (0.0%) |
| 19 to 25 Years | 63 (100.0%) | 0 (0.0%) |
| 26 to 34 Years | 16 (100.0%) | 0 (0.0%) |
| 35 to 44 Years | 38 (100.0%) | 0 (0.0%) |
| 45 to 54 Years | 23 (100.0%) | 0 (0.0%) |
| 55 to 64 Years | 43 (100.0%) | 0 (0.0%) |
| 65 to 74 Years | 41 (100.0%) | 0 (0.0%) |
| 75 Years and older | 10 (100.0%) | 0 (0.0%) |
| Total | 275 (100.0%) | 0 (0.0%) |
Health Insurance Coverage by Citizenship Status in Maplewood Park
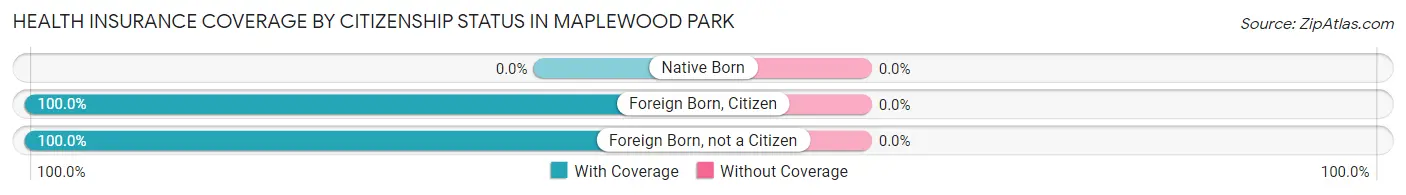
| Citizenship Status | With Coverage | Without Coverage |
| Native Born | 0 (0.0%) | 0 (0.0%) |
| Foreign Born, Citizen | 41 (100.0%) | 0 (0.0%) |
| Foreign Born, not a Citizen | 63 (100.0%) | 0 (0.0%) |
Health Insurance Coverage by Household Income in Maplewood Park
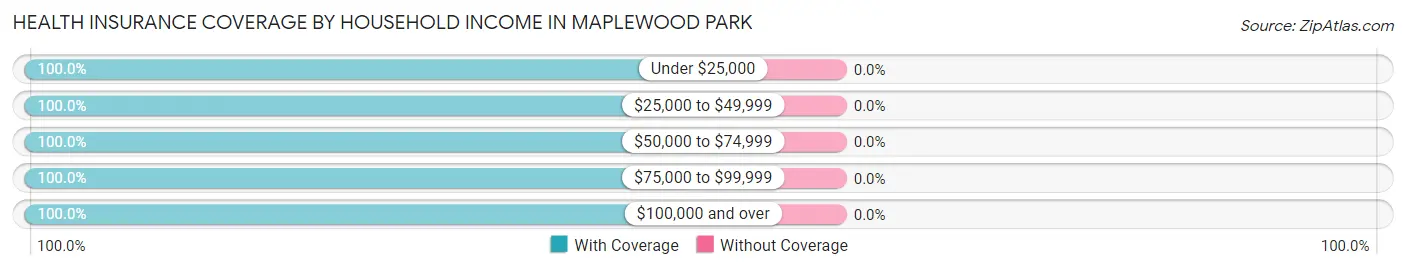
| Household Income | With Coverage | Without Coverage |
| Under $25,000 | 32 (100.0%) | 0 (0.0%) |
| $25,000 to $49,999 | 107 (100.0%) | 0 (0.0%) |
| $50,000 to $74,999 | 8 (100.0%) | 0 (0.0%) |
| $75,000 to $99,999 | 107 (100.0%) | 0 (0.0%) |
| $100,000 and over | 21 (100.0%) | 0 (0.0%) |
Public vs Private Health Insurance Coverage by Age in Maplewood Park
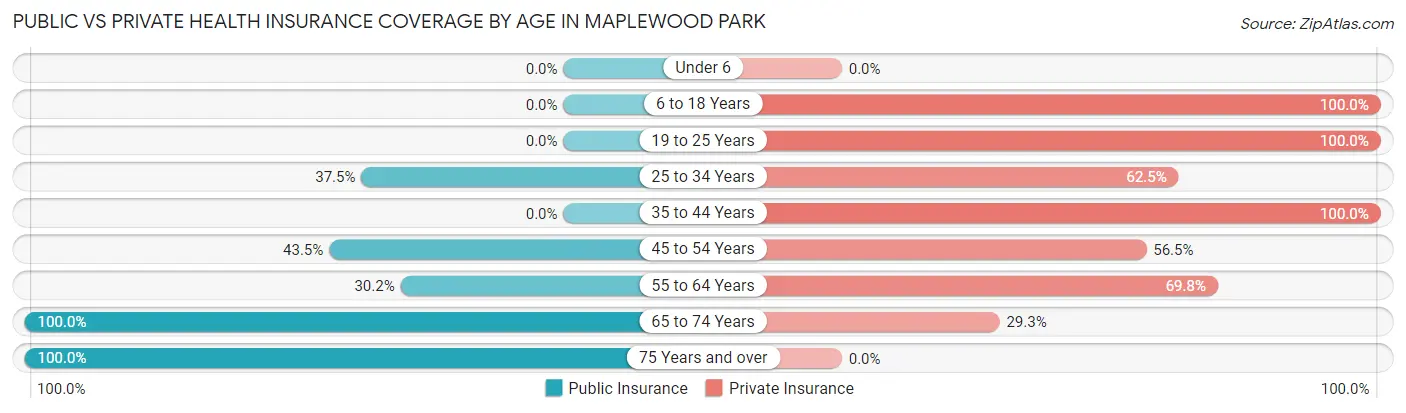
| Age Bracket | Public Insurance | Private Insurance |
| Under 6 | 0 (0.0%) | 0 (0.0%) |
| 6 to 18 Years | 0 (0.0%) | 41 (100.0%) |
| 19 to 25 Years | 0 (0.0%) | 63 (100.0%) |
| 25 to 34 Years | 6 (37.5%) | 10 (62.5%) |
| 35 to 44 Years | 0 (0.0%) | 38 (100.0%) |
| 45 to 54 Years | 10 (43.5%) | 13 (56.5%) |
| 55 to 64 Years | 13 (30.2%) | 30 (69.8%) |
| 65 to 74 Years | 41 (100.0%) | 12 (29.3%) |
| 75 Years and over | 10 (100.0%) | 0 (0.0%) |
| Total | 80 (29.1%) | 207 (75.3%) |
Disability Status by Sex by Age in Maplewood Park
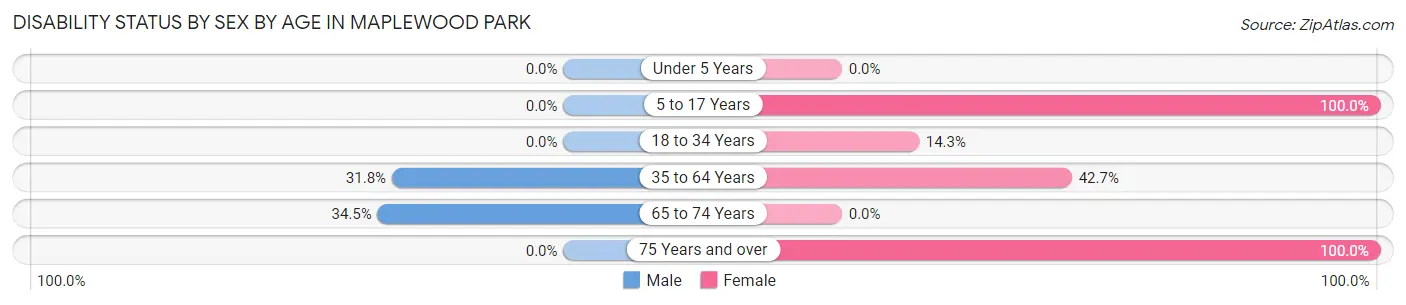
| Age Bracket | Male | Female |
| Under 5 Years | 0 (0.0%) | 0 (0.0%) |
| 5 to 17 Years | 0 (0.0%) | 6 (100.0%) |
| 18 to 34 Years | 0 (0.0%) | 6 (14.3%) |
| 35 to 64 Years | 7 (31.8%) | 35 (42.7%) |
| 65 to 74 Years | 10 (34.5%) | 0 (0.0%) |
| 75 Years and over | 0 (0.0%) | 10 (100.0%) |
Disability Class by Sex by Age in Maplewood Park
Disability Class: Hearing Difficulty
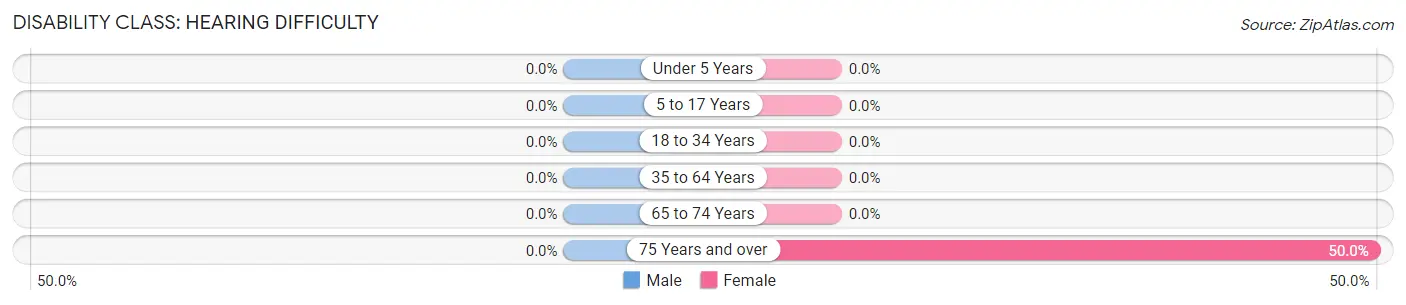
| Age Bracket | Male | Female |
| Under 5 Years | 0 (0.0%) | 0 (0.0%) |
| 5 to 17 Years | 0 (0.0%) | 0 (0.0%) |
| 18 to 34 Years | 0 (0.0%) | 0 (0.0%) |
| 35 to 64 Years | 0 (0.0%) | 0 (0.0%) |
| 65 to 74 Years | 0 (0.0%) | 0 (0.0%) |
| 75 Years and over | 0 (0.0%) | 5 (50.0%) |
Disability Class: Vision Difficulty
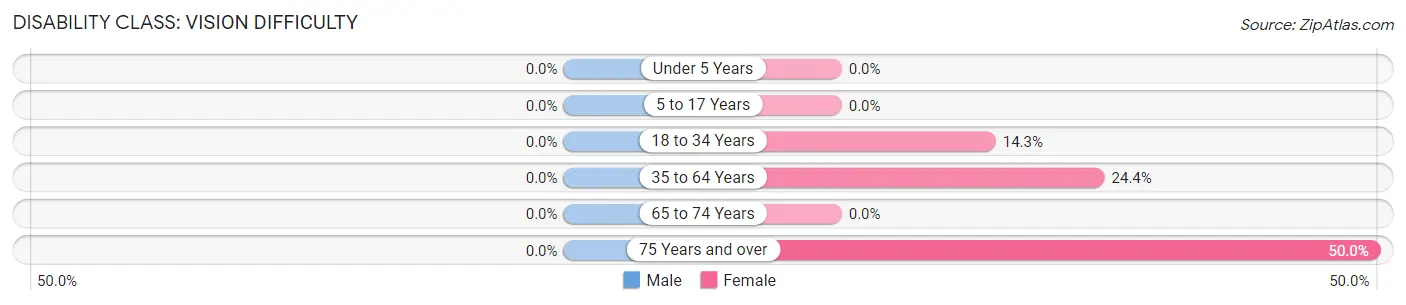
| Age Bracket | Male | Female |
| Under 5 Years | 0 (0.0%) | 0 (0.0%) |
| 5 to 17 Years | 0 (0.0%) | 0 (0.0%) |
| 18 to 34 Years | 0 (0.0%) | 6 (14.3%) |
| 35 to 64 Years | 0 (0.0%) | 20 (24.4%) |
| 65 to 74 Years | 0 (0.0%) | 0 (0.0%) |
| 75 Years and over | 0 (0.0%) | 5 (50.0%) |
Disability Class: Cognitive Difficulty
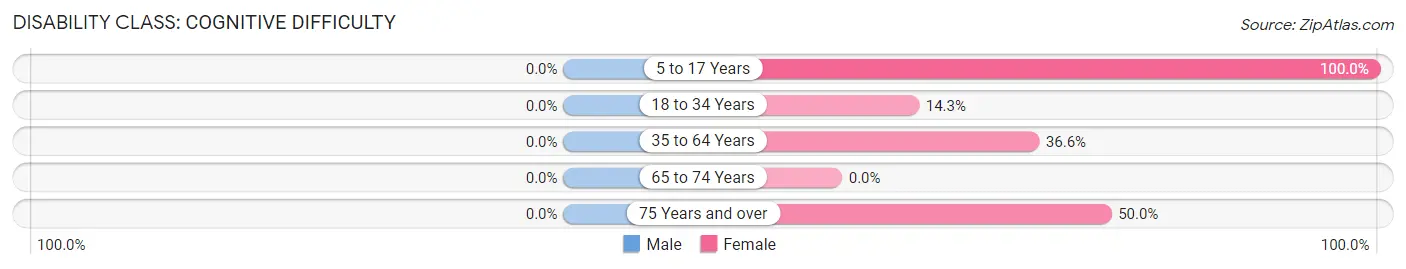
| Age Bracket | Male | Female |
| 5 to 17 Years | 0 (0.0%) | 6 (100.0%) |
| 18 to 34 Years | 0 (0.0%) | 6 (14.3%) |
| 35 to 64 Years | 0 (0.0%) | 30 (36.6%) |
| 65 to 74 Years | 0 (0.0%) | 0 (0.0%) |
| 75 Years and over | 0 (0.0%) | 5 (50.0%) |
Disability Class: Ambulatory Difficulty
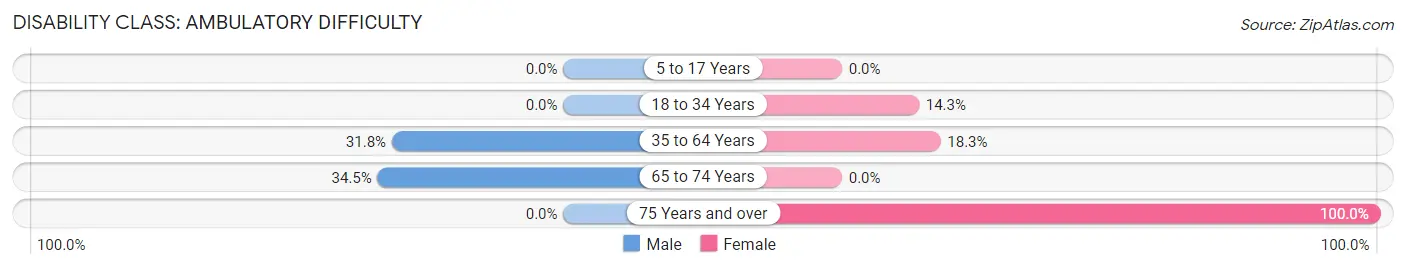
| Age Bracket | Male | Female |
| 5 to 17 Years | 0 (0.0%) | 0 (0.0%) |
| 18 to 34 Years | 0 (0.0%) | 6 (14.3%) |
| 35 to 64 Years | 7 (31.8%) | 15 (18.3%) |
| 65 to 74 Years | 10 (34.5%) | 0 (0.0%) |
| 75 Years and over | 0 (0.0%) | 10 (100.0%) |
Disability Class: Self-Care Difficulty
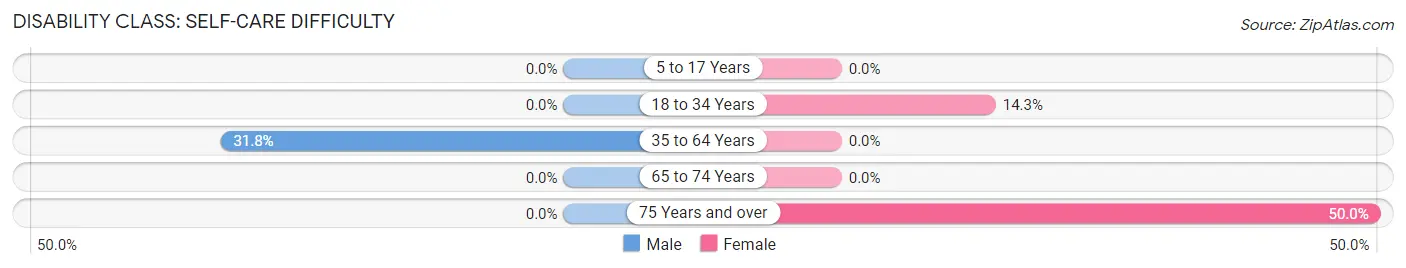
| Age Bracket | Male | Female |
| 5 to 17 Years | 0 (0.0%) | 0 (0.0%) |
| 18 to 34 Years | 0 (0.0%) | 6 (14.3%) |
| 35 to 64 Years | 7 (31.8%) | 0 (0.0%) |
| 65 to 74 Years | 0 (0.0%) | 0 (0.0%) |
| 75 Years and over | 0 (0.0%) | 5 (50.0%) |
Technology Access in Maplewood Park
Computing Device Access in Maplewood Park
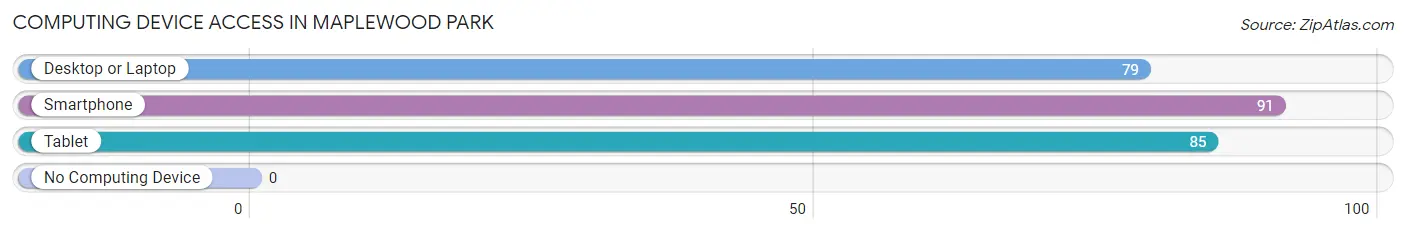
| Device Type | # Households | % Households |
| Desktop or Laptop | 79 | 81.4% |
| Smartphone | 91 | 93.8% |
| Tablet | 85 | 87.6% |
| No Computing Device | 0 | 0.0% |
| Total | 97 | 100.0% |
Internet Access in Maplewood Park
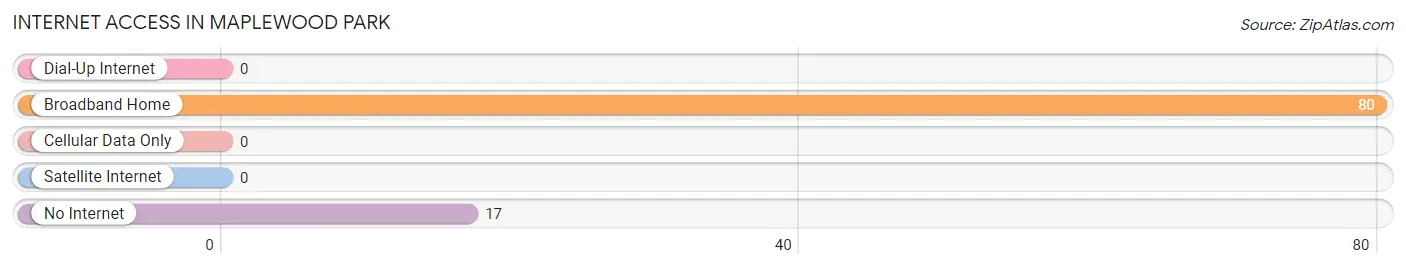
| Internet Type | # Households | % Households |
| Dial-Up Internet | 0 | 0.0% |
| Broadband Home | 80 | 82.5% |
| Cellular Data Only | 0 | 0.0% |
| Satellite Internet | 0 | 0.0% |
| No Internet | 17 | 17.5% |
| Total | 97 | 100.0% |
Maplewood Park Summary
Maplewood Park is a small village located in the state of Ohio, United States. It is situated in the county of Cuyahoga, and is part of the Greater Cleveland metropolitan area. The village has a population of approximately 1,000 people, and is located about 20 miles south of Cleveland.
History
Maplewood Park was founded in 1820 by a group of settlers from Connecticut. The village was originally known as “Maplewood”, and was named after the abundance of maple trees in the area. The village was incorporated in 1871, and was officially renamed “Maplewood Park” in 1873.
In the late 19th century, Maplewood Park was a popular destination for wealthy Clevelanders looking to escape the hustle and bustle of the city. The village was home to several large estates, and was known for its picturesque views of the surrounding countryside.
In the early 20th century, Maplewood Park began to experience a decline in population as many of the wealthy residents moved away. The village was also affected by the Great Depression, and many of the businesses in the area closed.
Geography
Maplewood Park is located in the western part of Cuyahoga County, Ohio. The village is situated on the banks of the Cuyahoga River, and is surrounded by rolling hills and wooded areas. The village is located about 20 miles south of Cleveland, and is accessible via Interstate 77.
The climate in Maplewood Park is typical of the Midwest, with hot summers and cold winters. The average temperature in the summer is around 75 degrees Fahrenheit, and the average temperature in the winter is around 25 degrees Fahrenheit.
Economy
The economy of Maplewood Park is largely based on agriculture and tourism. The village is home to several small farms, and the surrounding area is known for its production of corn, soybeans, and other crops.
Tourism is also an important part of the local economy. The village is home to several historic sites, including the Maplewood Park Historic District, which is listed on the National Register of Historic Places. The village also hosts several annual festivals and events, including the Maplewood Park Summer Festival and the Maplewood Park Fall Festival.
Demographics
As of the 2010 census, the population of Maplewood Park was 1,000 people. The racial makeup of the village was 97.2% White, 0.7% African American, 0.3% Native American, 0.3% Asian, and 1.5% from other races. The median household income was $45,000, and the median age was 43.
Conclusion
Maplewood Park is a small village located in the state of Ohio, United States. It is situated in the county of Cuyahoga, and is part of the Greater Cleveland metropolitan area. The village has a population of approximately 1,000 people, and is located about 20 miles south of Cleveland. The economy of Maplewood Park is largely based on agriculture and tourism, and the village is home to several historic sites and annual festivals. The population of Maplewood Park is predominantly White, with a median household income of $45,000 and a median age of 43.
Common Questions
What is the Total Population of Maplewood Park?
Total Population of Maplewood Park is 275.
What is the Total Male Population of Maplewood Park?
Total Male Population of Maplewood Park is 123.
What is the Total Female Population of Maplewood Park?
Total Female Population of Maplewood Park is 152.
What is the Ratio of Males per 100 Females in Maplewood Park?
There are 80.92 Males per 100 Females in Maplewood Park.
What is the Ratio of Females per 100 Males in Maplewood Park?
There are 123.58 Females per 100 Males in Maplewood Park.
What is the Median Population Age in Maplewood Park?
Median Population Age in Maplewood Park is 42.5 Years.
What is the Average Family Size in Maplewood Park
Average Family Size in Maplewood Park is 3.2 People.
What is the Average Household Size in Maplewood Park
Average Household Size in Maplewood Park is 2.8 People.
What is Per Capita Income in Maplewood Park?
Per Capita income in Maplewood Park is $21,319.
What is the Median Family Income in Maplewood Park?
Median Family Income in Maplewood Park is $48,224.
What is the Median Household income in Maplewood Park?
Median Household Income in Maplewood Park is $49,408.
What is Inequality or Gini Index in Maplewood Park?
Inequality or Gini Index in Maplewood Park is 0.29.
How Large is the Labor Force in Maplewood Park?
There are 107 People in the Labor Forcein in Maplewood Park.
What is the Percentage of People in the Labor Force in Maplewood Park?
45.7% of People are in the Labor Force in Maplewood Park.