Zip Codes with the Lowest Poverty Level in Dayton, OH

RELATED REPORTS & OPTIONS

Lowest Poverty
Population
Families and Households
Female Fertility
Female Fertility (Unmarried)
Race (Community Size)
Race (Percentage)
Ancestry (Community Size)
AfricanAlbanianAlsatianAmericanApacheArabArgentineanArmenianAustralianAustrianBasqueBelgianBhutaneseBlackfeetBolivianBrazilianBritishBulgarianBurmeseCajunCanadianCape VerdeanCelticCentral AmericanCentral American IndianCherokeeChileanChippewaChoctawColombianCosta RicanCreekCroatianCubanCzechCzechoslovakianDanishDominicanDutchEastern EuropeanEcuadorianEgyptianEnglishEstonianEthiopianEuropeanFilipinoFinnishFrenchFrench CanadianGermanGhanaianGreekGuamanian / ChamorroGuatemalanHaitianHonduranHungarianIcelanderIndian (Asian)InupiatIranianIraqiIrishIroquoisItalianJamaicanJapaneseKenyanKoreanLaotianLatvianLebaneseLiberianLithuanianLuxembourgerMacedonianMalteseMexicanMexican American IndianMoroccanNative HawaiianNavajoNicaraguanNigerianNorthern EuropeanNorwegianOkinawanPakistaniPalestinianPanamanianPennsylvania GermanPeruvianPolishPortuguesePotawatomiPuerto RicanRomanianRussianSalvadoranSamoanScandinavianScotch-IrishScottishSeminoleSenegaleseSerbianSiouxSlavicSlovakSloveneSouth AfricanSouth AmericanSpaniardSpanishSri LankanSubsaharan AfricanSudaneseSwedishSwissSyrianThaiTrinidadian and TobagonianTurkishUkrainianVenezuelanWelshWest IndianYugoslavian
Ancestry (Percentage)
AfricanAlbanianAlsatianAmericanApacheArabArgentineanArmenianAustralianAustrianBasqueBelgianBhutaneseBlackfeetBolivianBrazilianBritishBulgarianBurmeseCajunCanadianCape VerdeanCelticCentral AmericanCentral American IndianCherokeeChileanChippewaChoctawColombianCosta RicanCreekCroatianCubanCzechCzechoslovakianDanishDominicanDutchEastern EuropeanEcuadorianEgyptianEnglishEstonianEthiopianEuropeanFilipinoFinnishFrenchFrench CanadianGermanGhanaianGreekGuamanian / ChamorroGuatemalanHaitianHonduranHungarianIcelanderIndian (Asian)InupiatIranianIraqiIrishIroquoisItalianJamaicanJapaneseKenyanKoreanLaotianLatvianLebaneseLiberianLithuanianLuxembourgerMacedonianMalteseMexicanMexican American IndianMoroccanNative HawaiianNavajoNicaraguanNigerianNorthern EuropeanNorwegianOkinawanPakistaniPalestinianPanamanianPennsylvania GermanPeruvianPolishPortuguesePotawatomiPuerto RicanRomanianRussianSalvadoranSamoanScandinavianScotch-IrishScottishSeminoleSenegaleseSerbianSiouxSlavicSlovakSloveneSouth AfricanSouth AmericanSpaniardSpanishSri LankanSubsaharan AfricanSudaneseSwedishSwissSyrianThaiTrinidadian and TobagonianTurkishUkrainianVenezuelanWelshWest IndianYugoslavian
Immigrant Origin (Total)
AfricaArgentinaAsiaAustraliaBelarusBosnia and HerzegovinaBrazilBulgariaCambodiaCameroonCanadaCaribbeanCentral AmericaChinaColombiaCongoCosta RicaCubaDominican RepublicEastern AfricaEastern AsiaEastern EuropeEcuadorEgyptEl SalvadorEnglandEthiopiaEuropeFranceGermanyGhanaGreeceGuatemalaGuyanaHaitiHondurasHong KongHungaryIndiaIndonesiaIranIraqIrelandIsraelItalyJamaicaJapanJordanKenyaKoreaKuwaitLatin AmericaLebanonLiberiaMalaysiaMexicoMiddle AfricaMoldovaMoroccoNetherlandsNigeriaNorthern AfricaNorthern EuropeNorwayOceaniaPakistanPanamaPeruPhilippinesPolandPortugalRomaniaRussiaSaudi ArabiaScotlandSenegalSingaporeSouth AfricaSouth AmericaSouth Central AsiaSouth Eastern AsiaSouthern EuropeSpainSudanTaiwanThailandTrinidad and TobagoTurkeyUkraineUzbekistanVenezuelaVietnamWestern AfricaWestern AsiaWestern EuropeZaire
Immigrant Origin (Percentage)
AfricaArgentinaAsiaAustraliaBelarusBosnia and HerzegovinaBrazilBulgariaCambodiaCameroonCanadaCaribbeanCentral AmericaChinaColombiaCongoCosta RicaCubaDominican RepublicEastern AfricaEastern AsiaEastern EuropeEcuadorEgyptEl SalvadorEnglandEthiopiaEuropeFranceGermanyGhanaGreeceGuatemalaGuyanaHaitiHondurasHong KongHungaryIndiaIndonesiaIranIraqIrelandIsraelItalyJamaicaJapanJordanKenyaKoreaKuwaitLatin AmericaLebanonLiberiaMalaysiaMexicoMiddle AfricaMoldovaMoroccoNetherlandsNigeriaNorthern AfricaNorthern EuropeNorwayOceaniaPakistanPanamaPeruPhilippinesPolandPortugalRomaniaRussiaSaudi ArabiaScotlandSenegalSingaporeSouth AfricaSouth AmericaSouth Central AsiaSouth Eastern AsiaSouthern EuropeSpainSudanTaiwanThailandTrinidad and TobagoTurkeyUkraineUzbekistanVenezuelaVietnamWestern AfricaWestern AsiaWestern EuropeZaire
Income
Income (Families)
Income (Households)
Poverty
Poverty (Families)
Unemployment
Employment Occupations
Employment Industries
Employer Class
Commute Time
Commute Means
School Enrollment
Education by Degree Field
Occupancy
Finances
Physical Characteristics
Dayton
Compare Zip Codes
Comparison Subject

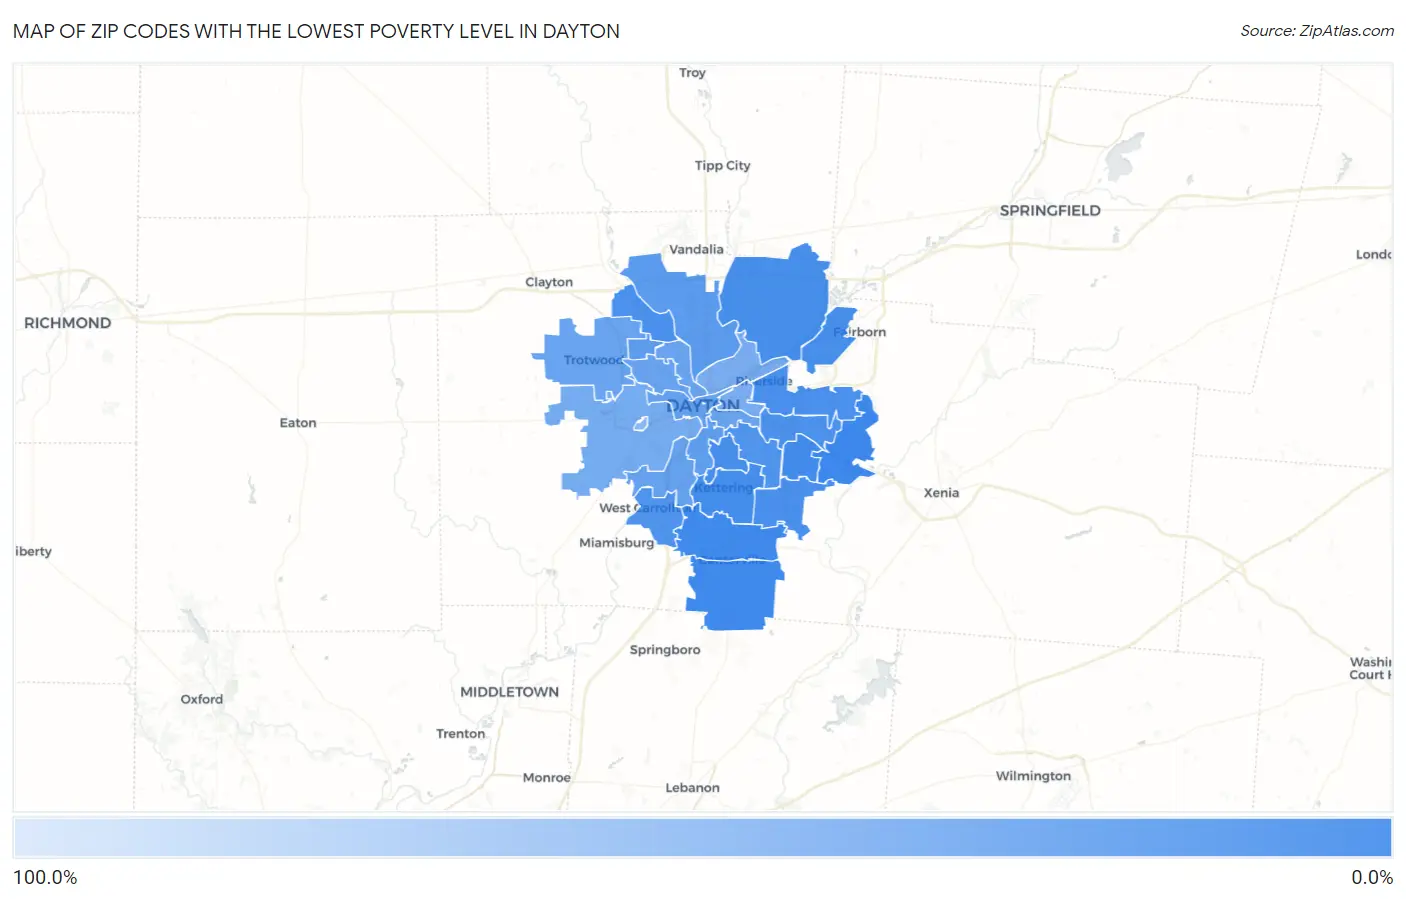
Map of Zip Codes with the Lowest Poverty Level in Dayton

100.0%
0.0%
Zip Codes with the Lowest Poverty Level in Dayton Map

Zip Codes with the Lowest Poverty Level in Dayton, OH

Zip Code Poverty vs State vs National
1.454343.4%13.3%(-9.88)#7612.5%(-9.11)#2,372
2.454595.1%13.3%(-8.22)#17812.5%(-7.45)#4,973
3.454585.8%13.3%(-7.54)#22712.5%(-6.77)#6,121
4.454307.1%13.3%(-6.24)#32812.5%(-5.47)#8,452
5.454297.4%13.3%(-5.87)#35812.5%(-5.10)#9,161
6.454198.3%13.3%(-5.02)#41612.5%(-4.25)#10,724
7.454248.5%13.3%(-4.85)#42612.5%(-4.08)#11,032
8.454338.7%13.3%(-4.56)#43912.5%(-3.79)#11,567
9.454319.6%13.3%(-3.69)#49812.5%(-2.92)#13,089
10.4541510.2%13.3%(-3.13)#53612.5%(-2.36)#14,028
11.4544010.3%13.3%(-3.03)#54412.5%(-2.26)#14,194
12.4543211.4%13.3%(-1.92)#61112.5%(-1.15)#15,973
13.4542012.6%13.3%(-0.663)#66412.5%(+0.108)#17,828
14.4544913.6%13.3%(+0.321)#72812.5%(+1.09)#19,129
15.4541419.3%13.3%(+5.97)#91312.5%(+6.74)#24,619
16.4541620.8%13.3%(+7.53)#94612.5%(+8.30)#25,627
17.4540922.2%13.3%(+8.92)#97612.5%(+9.69)#26,414
18.4543924.0%13.3%(+10.7)#1,00612.5%(+11.4)#27,142
19.4540224.1%13.3%(+10.8)#1,00912.5%(+11.6)#27,200
20.4540624.8%13.3%(+11.5)#1,01912.5%(+12.3)#27,463
21.4541026.3%13.3%(+13.0)#1,03512.5%(+13.8)#27,938
22.4540526.4%13.3%(+13.1)#1,04112.5%(+13.8)#27,968
23.4542626.5%13.3%(+13.2)#1,04512.5%(+14.0)#27,998
24.4541733.6%13.3%(+20.3)#1,08612.5%(+21.1)#29,461
25.4540335.4%13.3%(+22.1)#1,08912.5%(+22.9)#29,690
26.4540436.5%13.3%(+23.2)#1,09412.5%(+23.9)#29,816
27.4542845.5%13.3%(+32.1)#1,12412.5%(+32.9)#30,418
28.45469100.0%13.3%(+86.7)#1,15612.5%(+87.5)#31,111

Common Questions

What are the Top 10 Zip Codes with the Lowest Poverty Level in Dayton, OH?
Top 10 Zip Codes with the Lowest Poverty Level in Dayton, OH are:
#1
3.4%
#2
5.1%
#3
5.8%
#4
7.1%
#5
7.4%
#6
8.3%
#7
8.5%
#8
8.7%
#9
9.6%
#10
10.2%
What zip code has the Lowest Poverty Level in Dayton, OH?
45434 has the Lowest Poverty Level in Dayton, OH with 3.4%.
What is the Poverty Level in Dayton, OH?
Poverty Level in Dayton is 27.5%.
What is the Poverty Level in Ohio?
Poverty Level in Ohio is 13.3%.
What is the Poverty Level in the United States?
Poverty Level in the United States is 12.5%.