New California, OH
New California Map
New California Overview
1,909
TOTAL POPULATION
915
MALE POPULATION
994
FEMALE POPULATION
92.05
MALES / 100 FEMALES
108.63
FEMALES / 100 MALES
39.7
MEDIAN AGE
3.6
AVG FAMILY SIZE
3.4
AVG HOUSEHOLD SIZE
$59,381
PER CAPITA INCOME
$180,855
AVG FAMILY INCOME
$167,946
AVG HOUSEHOLD INCOME
49.1%
WAGE / INCOME GAP [ % ]
50.9¢/ $1
WAGE / INCOME GAP [ $ ]
0.29
INEQUALITY / GINI INDEX
996
LABOR FORCE [ PEOPLE ]
77.6%
PERCENT IN LABOR FORCE
1.6%
UNEMPLOYMENT RATE
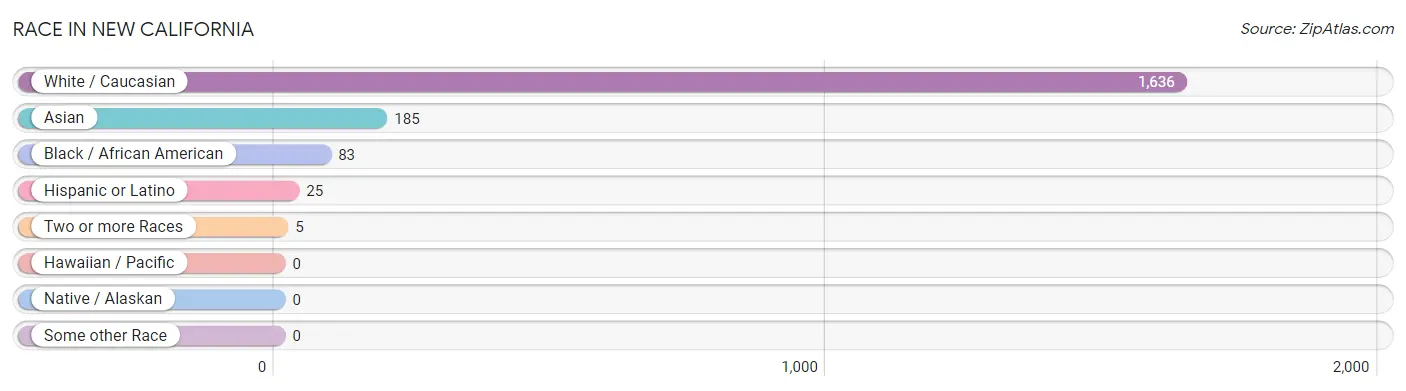
Race in New California
The most populous races in New California are White / Caucasian (1,636 | 85.7%), Asian (185 | 9.7%), and Black / African American (83 | 4.3%).
| Race | # Population | % Population |
| Asian | 185 | 9.7% |
| Black / African American | 83 | 4.3% |
| Hawaiian / Pacific | 0 | 0.0% |
| Hispanic or Latino | 25 | 1.3% |
| Native / Alaskan | 0 | 0.0% |
| White / Caucasian | 1,636 | 85.7% |
| Two or more Races | 5 | 0.3% |
| Some other Race | 0 | 0.0% |
| Total | 1,909 | 100.0% |
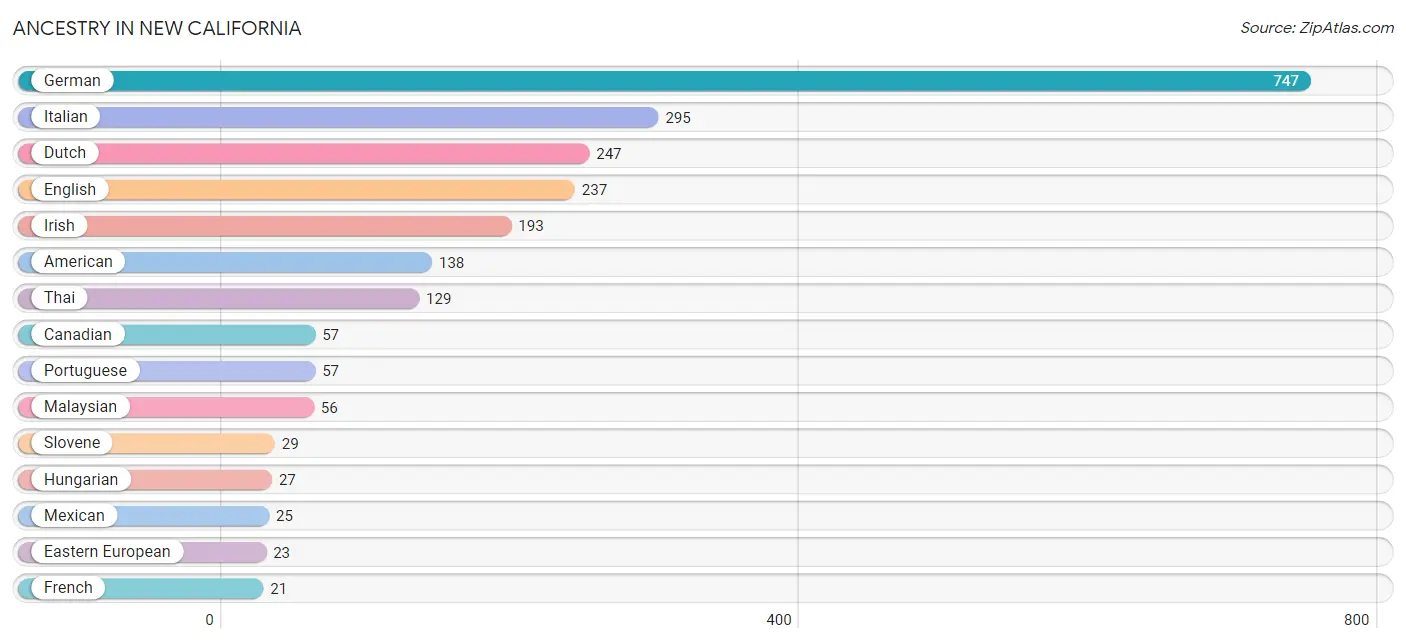
Ancestry in New California
The most populous ancestries reported in New California are German (747 | 39.1%), Italian (295 | 15.4%), Dutch (247 | 12.9%), English (237 | 12.4%), and Irish (193 | 10.1%), together accounting for 90.0% of all New California residents.
| Ancestry | # Population | % Population |
| American | 138 | 7.2% |
| Basque | 12 | 0.6% |
| Canadian | 57 | 3.0% |
| Cherokee | 5 | 0.3% |
| Dutch | 247 | 12.9% |
| Eastern European | 23 | 1.2% |
| English | 237 | 12.4% |
| Finnish | 10 | 0.5% |
| French | 21 | 1.1% |
| German | 747 | 39.1% |
| Hungarian | 27 | 1.4% |
| Irish | 193 | 10.1% |
| Italian | 295 | 15.4% |
| Malaysian | 56 | 2.9% |
| Mexican | 25 | 1.3% |
| Polish | 9 | 0.5% |
| Portuguese | 57 | 3.0% |
| Scottish | 13 | 0.7% |
| Slovene | 29 | 1.5% |
| Thai | 129 | 6.8% |
| Welsh | 5 | 0.3% | View All 21 Rows |
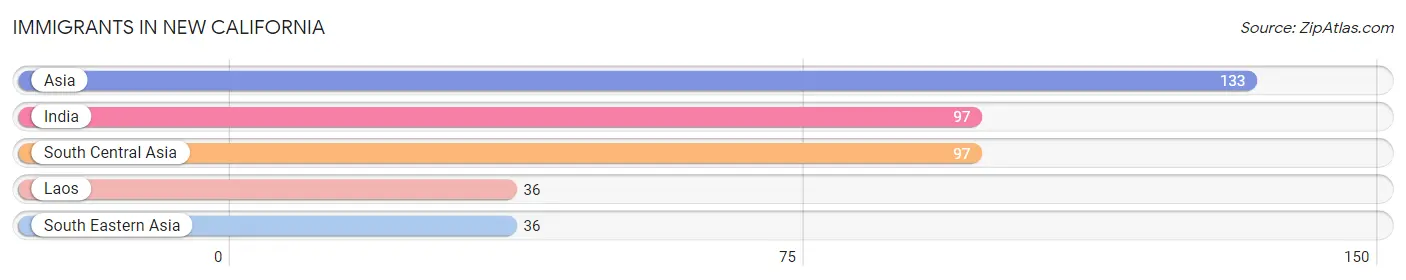
Immigrants in New California
The most numerous immigrant groups reported in New California came from Asia (133 | 7.0%), India (97 | 5.1%), South Central Asia (97 | 5.1%), Laos (36 | 1.9%), and South Eastern Asia (36 | 1.9%), together accounting for 20.9% of all New California residents.
| Immigration Origin | # Population | % Population |
| Asia | 133 | 7.0% |
| India | 97 | 5.1% |
| Laos | 36 | 1.9% |
| South Central Asia | 97 | 5.1% |
| South Eastern Asia | 36 | 1.9% | View All 5 Rows |
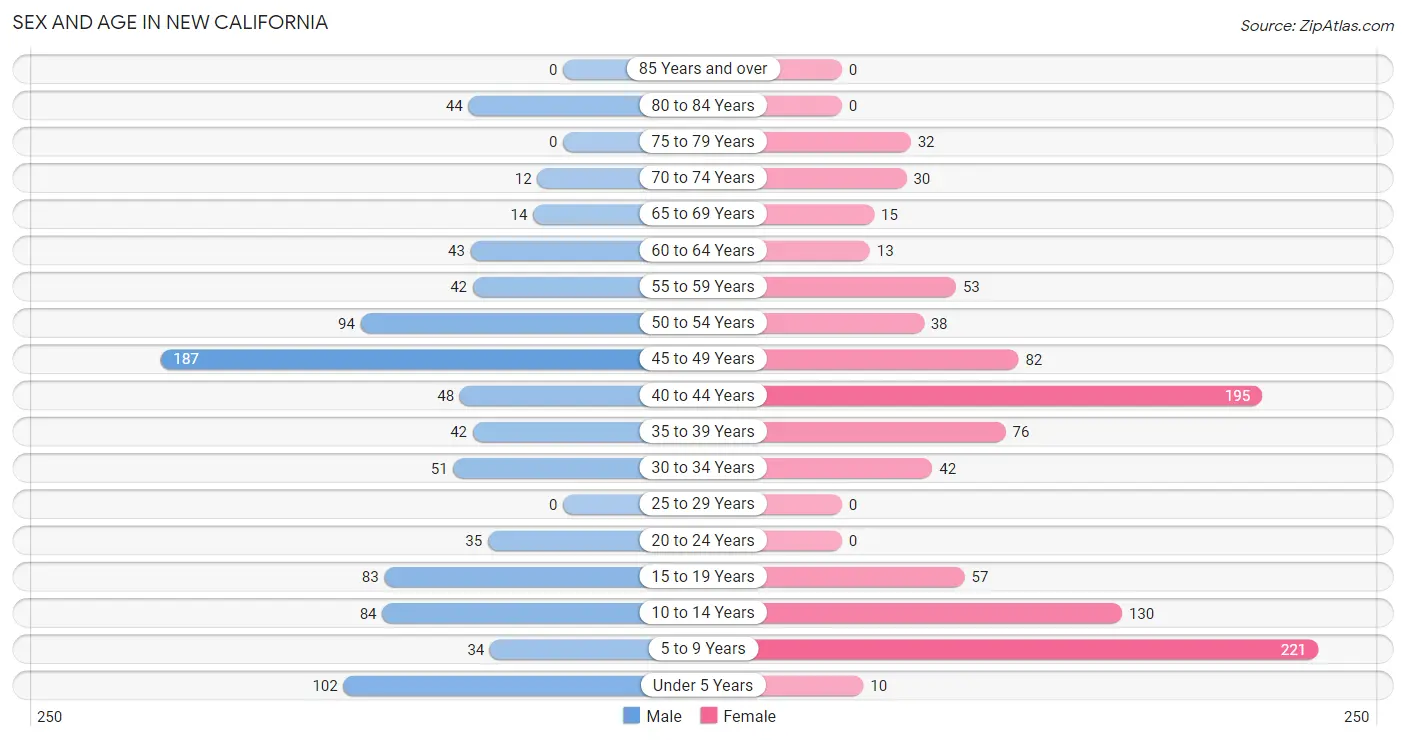
Sex and Age in New California
Sex and Age in New California
The most populous age groups in New California are 45 to 49 Years (187 | 20.4%) for men and 5 to 9 Years (221 | 22.2%) for women.
| Age Bracket | Male | Female |
| Under 5 Years | 102 (11.2%) | 10 (1.0%) |
| 5 to 9 Years | 34 (3.7%) | 221 (22.2%) |
| 10 to 14 Years | 84 (9.2%) | 130 (13.1%) |
| 15 to 19 Years | 83 (9.1%) | 57 (5.7%) |
| 20 to 24 Years | 35 (3.8%) | 0 (0.0%) |
| 25 to 29 Years | 0 (0.0%) | 0 (0.0%) |
| 30 to 34 Years | 51 (5.6%) | 42 (4.2%) |
| 35 to 39 Years | 42 (4.6%) | 76 (7.6%) |
| 40 to 44 Years | 48 (5.2%) | 195 (19.6%) |
| 45 to 49 Years | 187 (20.4%) | 82 (8.3%) |
| 50 to 54 Years | 94 (10.3%) | 38 (3.8%) |
| 55 to 59 Years | 42 (4.6%) | 53 (5.3%) |
| 60 to 64 Years | 43 (4.7%) | 13 (1.3%) |
| 65 to 69 Years | 14 (1.5%) | 15 (1.5%) |
| 70 to 74 Years | 12 (1.3%) | 30 (3.0%) |
| 75 to 79 Years | 0 (0.0%) | 32 (3.2%) |
| 80 to 84 Years | 44 (4.8%) | 0 (0.0%) |
| 85 Years and over | 0 (0.0%) | 0 (0.0%) |
| Total | 915 (100.0%) | 994 (100.0%) |
Families and Households in New California
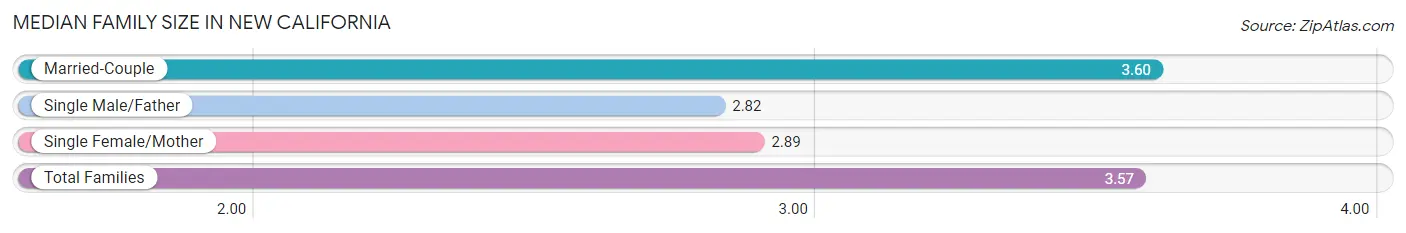
Median Family Size in New California
The median family size in New California is 3.57 persons per family, with married-couple families (487 | 96.1%) accounting for the largest median family size of 3.6 persons per family. On the other hand, single male/father families (11 | 2.2%) represent the smallest median family size with 2.82 persons per family.
| Family Type | # Families | Family Size |
| Married-Couple | 487 (96.1%) | 3.60 |
| Single Male/Father | 11 (2.2%) | 2.82 |
| Single Female/Mother | 9 (1.8%) | 2.89 |
| Total Families | 507 (100.0%) | 3.57 |
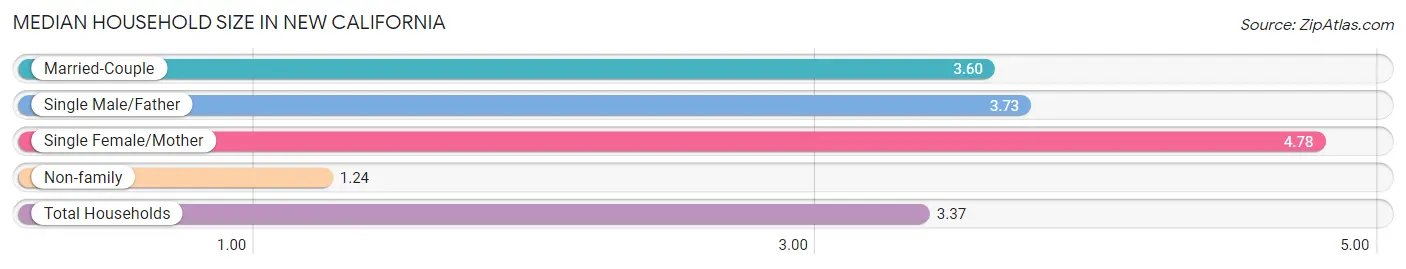
Median Household Size in New California
The median household size in New California is 3.37 persons per household, with single female/mother households (9 | 1.6%) accounting for the largest median household size of 4.78 persons per household. non-family households (59 | 10.4%) represent the smallest median household size with 1.24 persons per household.
| Household Type | # Households | Household Size |
| Married-Couple | 487 (86.0%) | 3.60 |
| Single Male/Father | 11 (1.9%) | 3.73 |
| Single Female/Mother | 9 (1.6%) | 4.78 |
| Non-family | 59 (10.4%) | 1.24 |
| Total Households | 566 (100.0%) | 3.37 |
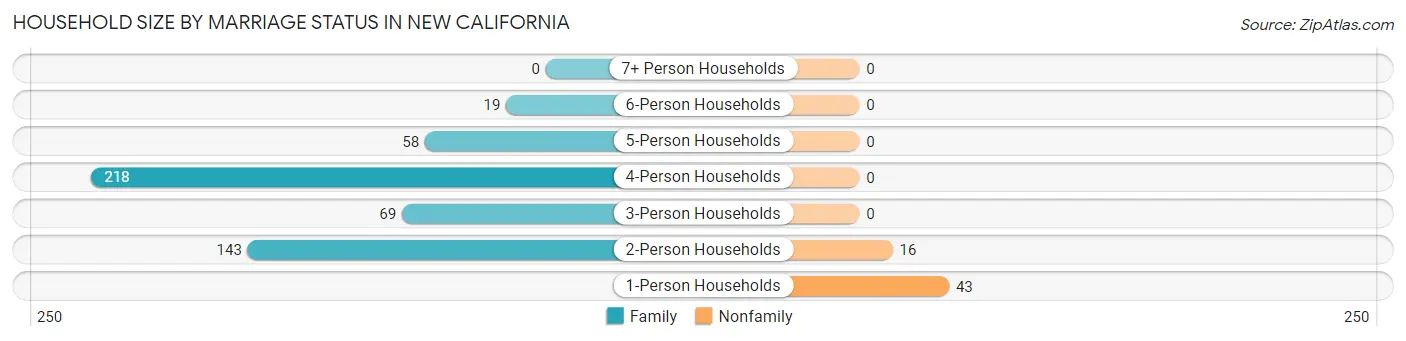
Household Size by Marriage Status in New California
Out of a total of 566 households in New California, 507 (89.6%) are family households, while 59 (10.4%) are nonfamily households. The most numerous type of family households are 4-person households, comprising 218, and the most common type of nonfamily households are 1-person households, comprising 43.
| Household Size | Family Households | Nonfamily Households |
| 1-Person Households | - | 43 (7.6%) |
| 2-Person Households | 143 (25.3%) | 16 (2.8%) |
| 3-Person Households | 69 (12.2%) | 0 (0.0%) |
| 4-Person Households | 218 (38.5%) | 0 (0.0%) |
| 5-Person Households | 58 (10.2%) | 0 (0.0%) |
| 6-Person Households | 19 (3.4%) | 0 (0.0%) |
| 7+ Person Households | 0 (0.0%) | 0 (0.0%) |
| Total | 507 (89.6%) | 59 (10.4%) |
Female Fertility in New California
Fertility by Age in New California
Average fertility rate in New California is 96.0 births per 1,000 women. Women in the age bracket of 20 to 34 years have the highest fertility rate with 333.0 births per 1,000 women. Women in the age bracket of 35 to 50 years acount for 68.9% of all women with births.
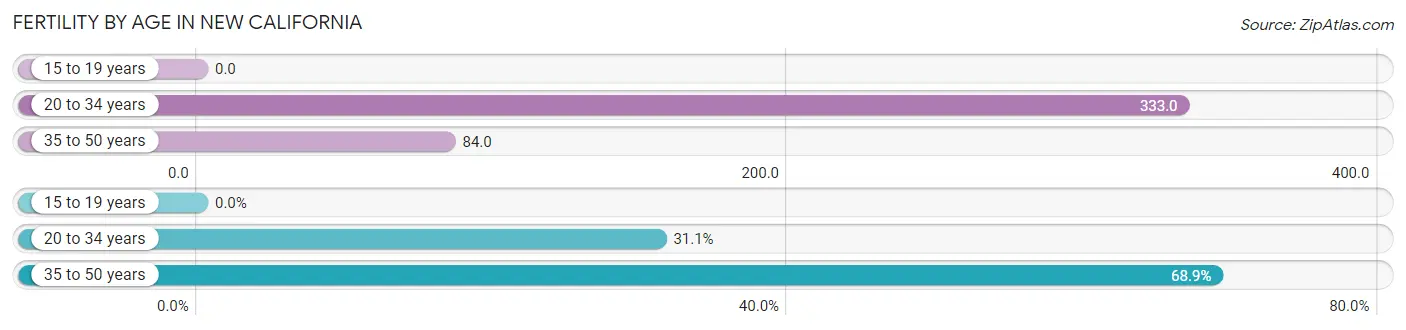
| Age Bracket | Women with Births | Births / 1,000 Women |
| 15 to 19 years | 0 (0.0%) | 0.0 |
| 20 to 34 years | 14 (31.1%) | 333.0 |
| 35 to 50 years | 31 (68.9%) | 84.0 |
| Total | 45 (100.0%) | 96.0 |
Fertility by Age by Marriage Status in New California
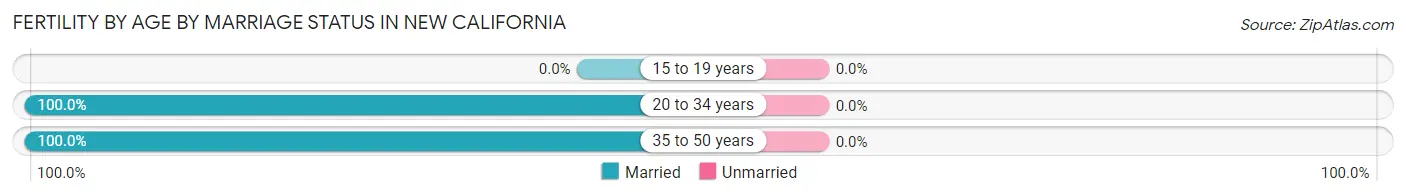
| Age Bracket | Married | Unmarried |
| 15 to 19 years | 0 (0.0%) | 0 (0.0%) |
| 20 to 34 years | 14 (100.0%) | 0 (0.0%) |
| 35 to 50 years | 31 (100.0%) | 0 (0.0%) |
| Total | 45 (100.0%) | 0 (0.0%) |
Fertility by Education in New California
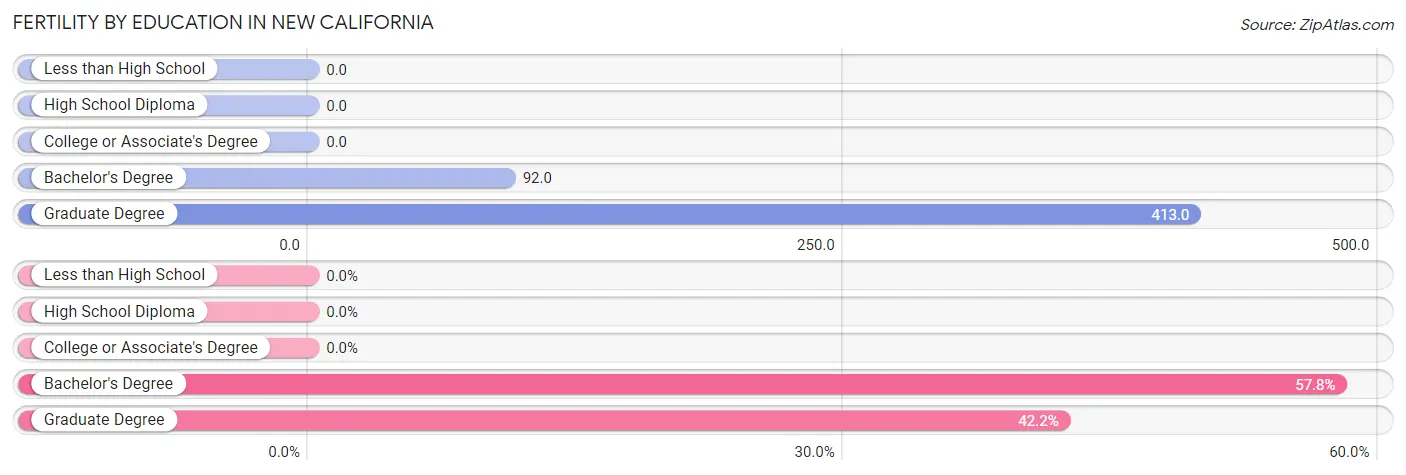
| Educational Attainment | Women with Births | Births / 1,000 Women |
| Less than High School | 0 (0.0%) | 0.0 |
| High School Diploma | 0 (0.0%) | 0.0 |
| College or Associate's Degree | 0 (0.0%) | 0.0 |
| Bachelor's Degree | 26 (57.8%) | 92.0 |
| Graduate Degree | 19 (42.2%) | 413.0 |
| Total | 45 (100.0%) | 96.0 |
Fertility by Education by Marriage Status in New California
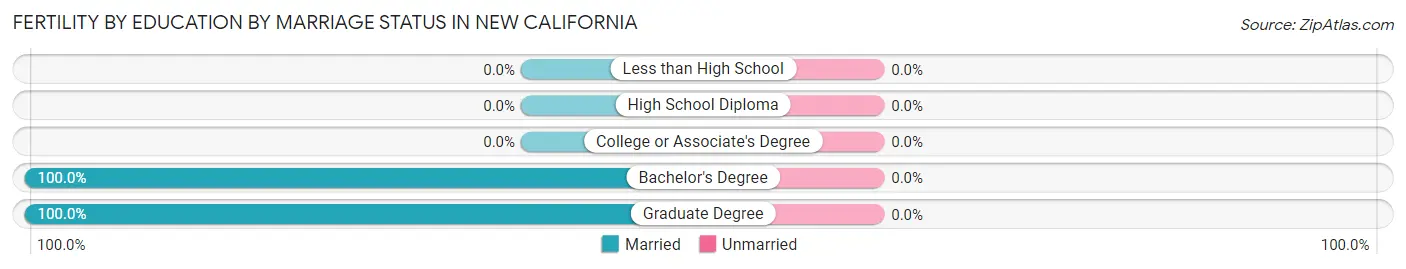
| Educational Attainment | Married | Unmarried |
| Less than High School | 0 (0.0%) | 0 (0.0%) |
| High School Diploma | 0 (0.0%) | 0 (0.0%) |
| College or Associate's Degree | 0 (0.0%) | 0 (0.0%) |
| Bachelor's Degree | 26 (100.0%) | 0 (0.0%) |
| Graduate Degree | 19 (100.0%) | 0 (0.0%) |
| Total | 45 (100.0%) | 0 (0.0%) |
Income in New California
Income Overview in New California
Per Capita Income in New California is $59,381, while median incomes of families and households are $180,855 and $167,946 respectively.
| Characteristic | Number | Measure |
| Per Capita Income | 1,909 | $59,381 |
| Median Family Income | 507 | $180,855 |
| Mean Family Income | 507 | $198,470 |
| Median Household Income | 566 | $167,946 |
| Mean Household Income | 566 | $191,932 |
| Income Deficit | 507 | $0 |
| Wage / Income Gap (%) | 1,909 | 49.12% |
| Wage / Income Gap ($) | 1,909 | 50.88¢ per $1 |
| Gini / Inequality Index | 1,909 | 0.29 |
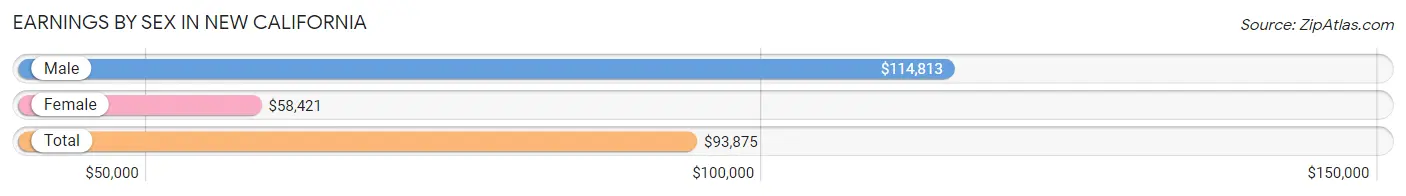
Earnings by Sex in New California
Average Earnings in New California are $93,875, $114,813 for men and $58,421 for women, a difference of 49.1%.
| Sex | Number | Average Earnings |
| Male | 493 (47.2%) | $114,813 |
| Female | 552 (52.8%) | $58,421 |
| Total | 1,045 (100.0%) | $93,875 |
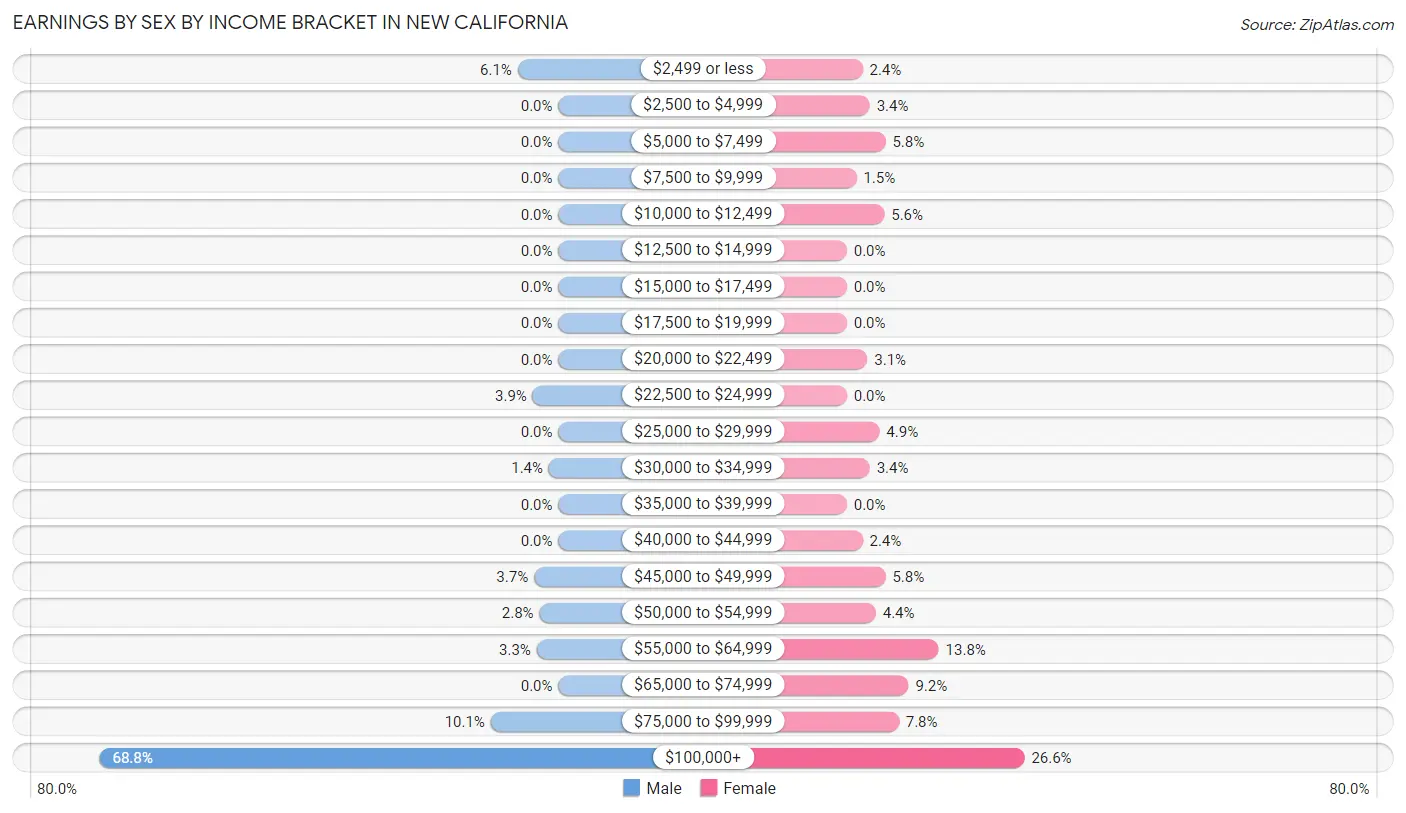
Earnings by Sex by Income Bracket in New California
The most common earnings brackets in New California are $100,000+ for men (339 | 68.8%) and $100,000+ for women (147 | 26.6%).
| Income | Male | Female |
| $2,499 or less | 30 (6.1%) | 13 (2.4%) |
| $2,500 to $4,999 | 0 (0.0%) | 19 (3.4%) |
| $5,000 to $7,499 | 0 (0.0%) | 32 (5.8%) |
| $7,500 to $9,999 | 0 (0.0%) | 8 (1.5%) |
| $10,000 to $12,499 | 0 (0.0%) | 31 (5.6%) |
| $12,500 to $14,999 | 0 (0.0%) | 0 (0.0%) |
| $15,000 to $17,499 | 0 (0.0%) | 0 (0.0%) |
| $17,500 to $19,999 | 0 (0.0%) | 0 (0.0%) |
| $20,000 to $22,499 | 0 (0.0%) | 17 (3.1%) |
| $22,500 to $24,999 | 19 (3.8%) | 0 (0.0%) |
| $25,000 to $29,999 | 0 (0.0%) | 27 (4.9%) |
| $30,000 to $34,999 | 7 (1.4%) | 19 (3.4%) |
| $35,000 to $39,999 | 0 (0.0%) | 0 (0.0%) |
| $40,000 to $44,999 | 0 (0.0%) | 13 (2.4%) |
| $45,000 to $49,999 | 18 (3.6%) | 32 (5.8%) |
| $50,000 to $54,999 | 14 (2.8%) | 24 (4.3%) |
| $55,000 to $64,999 | 16 (3.3%) | 76 (13.8%) |
| $65,000 to $74,999 | 0 (0.0%) | 51 (9.2%) |
| $75,000 to $99,999 | 50 (10.1%) | 43 (7.8%) |
| $100,000+ | 339 (68.8%) | 147 (26.6%) |
| Total | 493 (100.0%) | 552 (100.0%) |
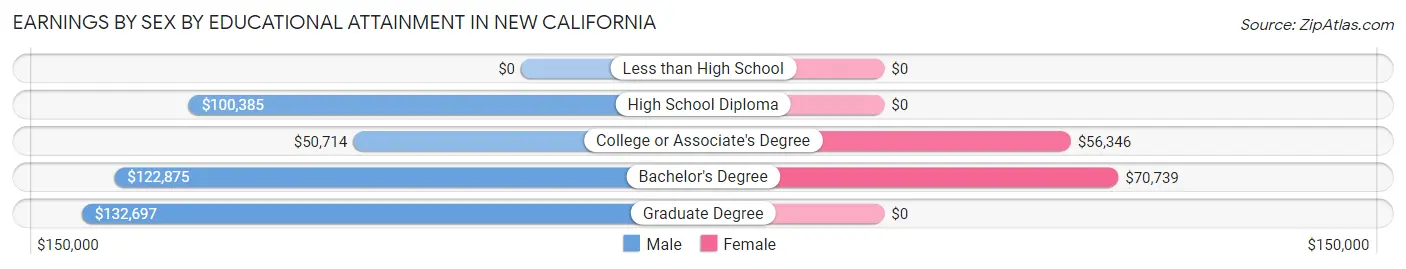
Earnings by Sex by Educational Attainment in New California
Average earnings in New California are $123,750 for men and $61,023 for women, a difference of 50.7%. Men with an educational attainment of graduate degree enjoy the highest average annual earnings of $132,697, while those with college or associate's degree education earn the least with $50,714. Women with an educational attainment of bachelor's degree earn the most with the average annual earnings of $70,739, while those with college or associate's degree education have the smallest earnings of $56,346.
| Educational Attainment | Male Income | Female Income |
| Less than High School | - | - |
| High School Diploma | $100,385 | $0 |
| College or Associate's Degree | $50,714 | $56,346 |
| Bachelor's Degree | $122,875 | $70,739 |
| Graduate Degree | $132,697 | $0 |
| Total | $123,750 | $61,023 |
Family Income in New California
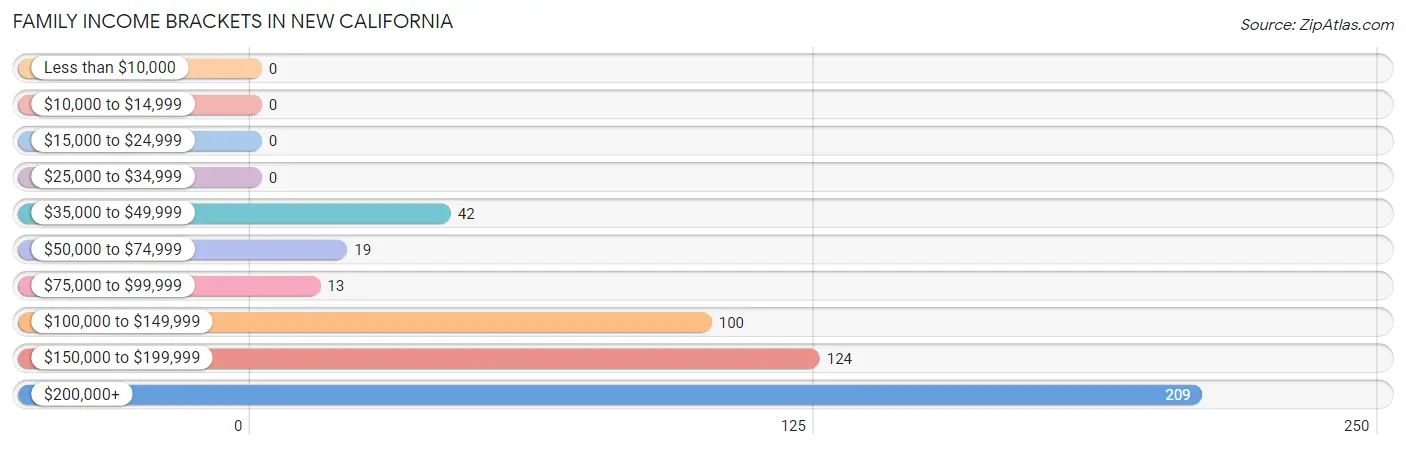
Family Income Brackets in New California
According to the New California family income data, there are 209 families falling into the $200,000+ income range, which is the most common income bracket and makes up 41.2% of all families.
| Income Bracket | # Families | % Families |
| Less than $10,000 | 0 | 0.0% |
| $10,000 to $14,999 | 0 | 0.0% |
| $15,000 to $24,999 | 0 | 0.0% |
| $25,000 to $34,999 | 0 | 0.0% |
| $35,000 to $49,999 | 42 | 8.3% |
| $50,000 to $74,999 | 19 | 3.7% |
| $75,000 to $99,999 | 13 | 2.6% |
| $100,000 to $149,999 | 100 | 19.7% |
| $150,000 to $199,999 | 124 | 24.5% |
| $200,000+ | 209 | 41.2% |
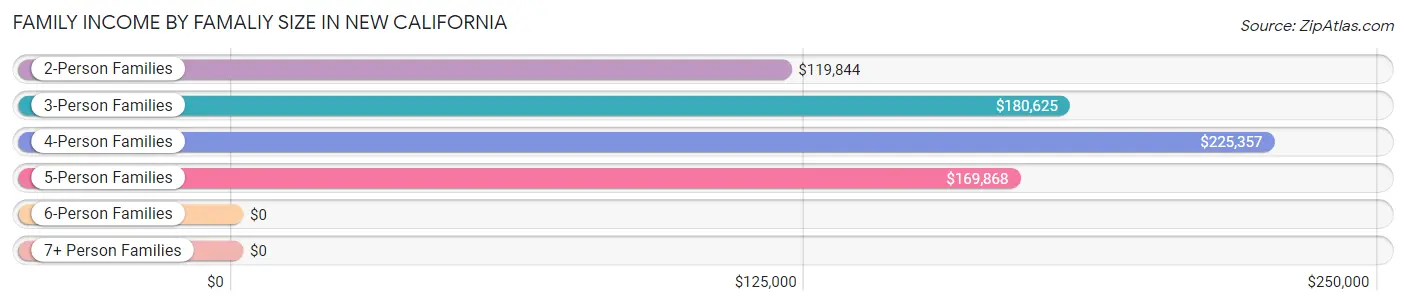
Family Income by Famaliy Size in New California
4-person families (198 | 39.1%) account for the highest median family income in New California with $225,357 per family, while 3-person families (89 | 17.5%) have the highest median income of $60,208 per family member.
| Income Bracket | # Families | Median Income |
| 2-Person Families | 143 (28.2%) | $119,844 |
| 3-Person Families | 89 (17.5%) | $180,625 |
| 4-Person Families | 198 (39.1%) | $225,357 |
| 5-Person Families | 58 (11.4%) | $169,868 |
| 6-Person Families | 19 (3.7%) | $0 |
| 7+ Person Families | 0 (0.0%) | $0 |
| Total | 507 (100.0%) | $180,855 |
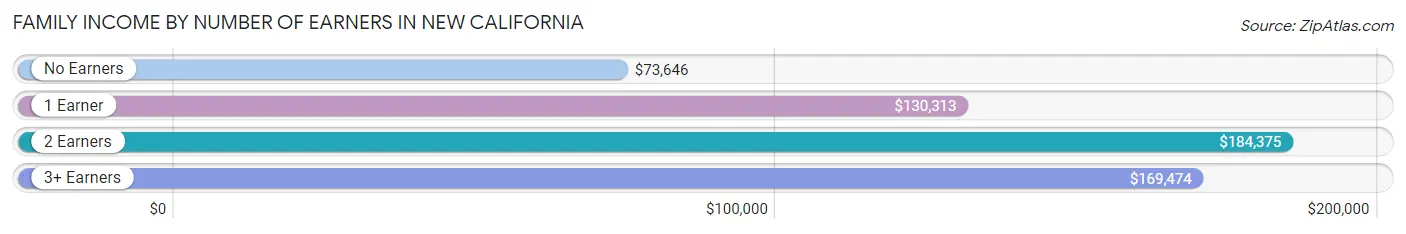
Family Income by Number of Earners in New California
The median family income in New California is $180,855, with families comprising 2 earners (344) having the highest median family income of $184,375, while families with no earners (37) have the lowest median family income of $73,646, accounting for 67.8% and 7.3% of families, respectively.
| Number of Earners | # Families | Median Income |
| No Earners | 37 (7.3%) | $73,646 |
| 1 Earner | 72 (14.2%) | $130,313 |
| 2 Earners | 344 (67.8%) | $184,375 |
| 3+ Earners | 54 (10.6%) | $169,474 |
| Total | 507 (100.0%) | $180,855 |
Household Income in New California
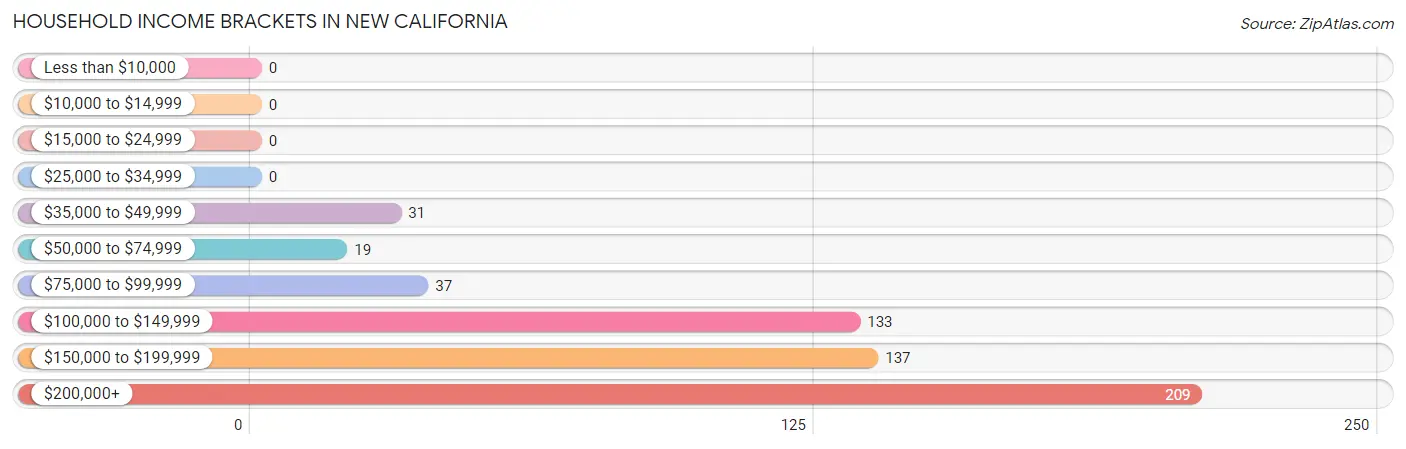
Household Income Brackets in New California
With 209 households falling in the category, the $200,000+ income range is the most frequent in New California, accounting for 36.9% of all households.
| Income Bracket | # Households | % Households |
| Less than $10,000 | 0 | 0.0% |
| $10,000 to $14,999 | 0 | 0.0% |
| $15,000 to $24,999 | 0 | 0.0% |
| $25,000 to $34,999 | 0 | 0.0% |
| $35,000 to $49,999 | 31 | 5.5% |
| $50,000 to $74,999 | 19 | 3.4% |
| $75,000 to $99,999 | 37 | 6.5% |
| $100,000 to $149,999 | 133 | 23.5% |
| $150,000 to $199,999 | 137 | 24.2% |
| $200,000+ | 209 | 36.9% |
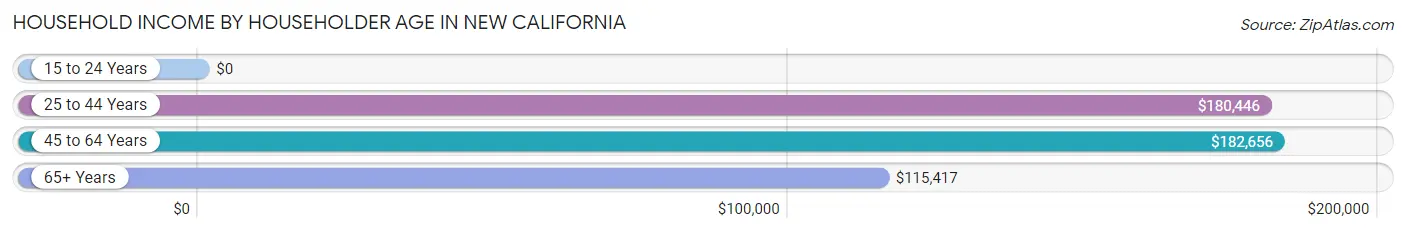
Household Income by Householder Age in New California
The median household income in New California is $167,946, with the highest median household income of $182,656 found in the 45 to 64 years age bracket for the primary householder. A total of 352 households (62.2%) fall into this category.
| Income Bracket | # Households | Median Income |
| 15 to 24 Years | 0 (0.0%) | $0 |
| 25 to 44 Years | 149 (26.3%) | $180,446 |
| 45 to 64 Years | 352 (62.2%) | $182,656 |
| 65+ Years | 65 (11.5%) | $115,417 |
| Total | 566 (100.0%) | $167,946 |
Poverty in New California
Income Below Poverty by Sex and Age in New California
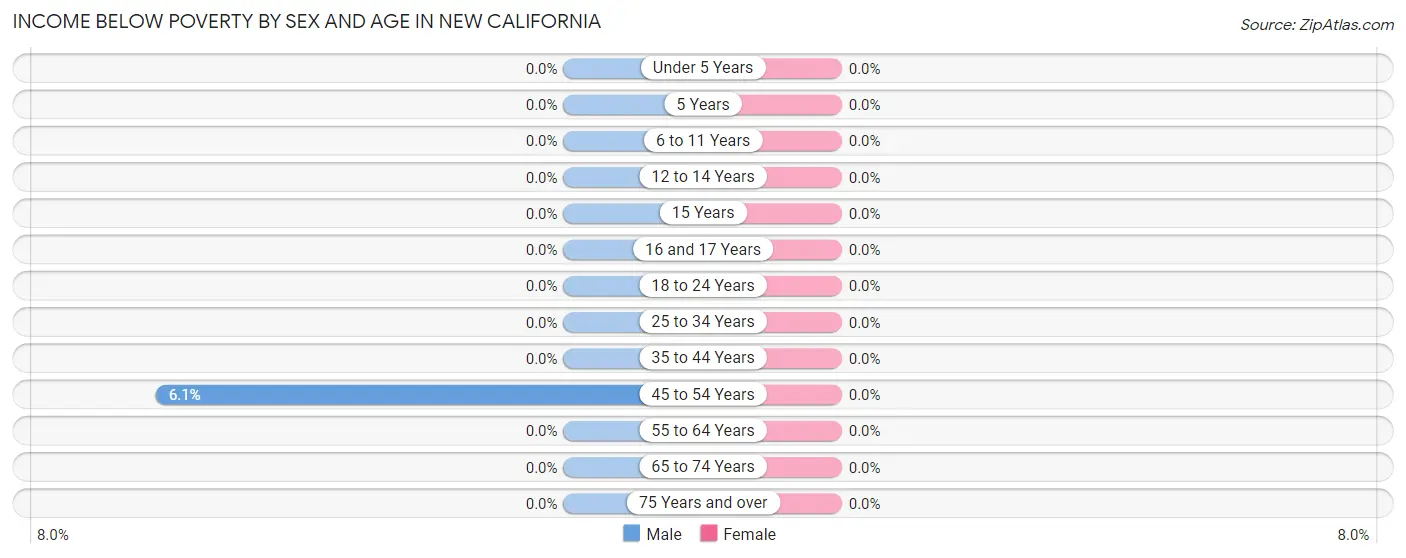
| Age Bracket | Male | Female |
| Under 5 Years | 0 (0.0%) | 0 (0.0%) |
| 5 Years | 0 (0.0%) | 0 (0.0%) |
| 6 to 11 Years | 0 (0.0%) | 0 (0.0%) |
| 12 to 14 Years | 0 (0.0%) | 0 (0.0%) |
| 15 Years | 0 (0.0%) | 0 (0.0%) |
| 16 and 17 Years | 0 (0.0%) | 0 (0.0%) |
| 18 to 24 Years | 0 (0.0%) | 0 (0.0%) |
| 25 to 34 Years | 0 (0.0%) | 0 (0.0%) |
| 35 to 44 Years | 0 (0.0%) | 0 (0.0%) |
| 45 to 54 Years | 17 (6.0%) | 0 (0.0%) |
| 55 to 64 Years | 0 (0.0%) | 0 (0.0%) |
| 65 to 74 Years | 0 (0.0%) | 0 (0.0%) |
| 75 Years and over | 0 (0.0%) | 0 (0.0%) |
| Total | 17 (1.9%) | 0 (0.0%) |
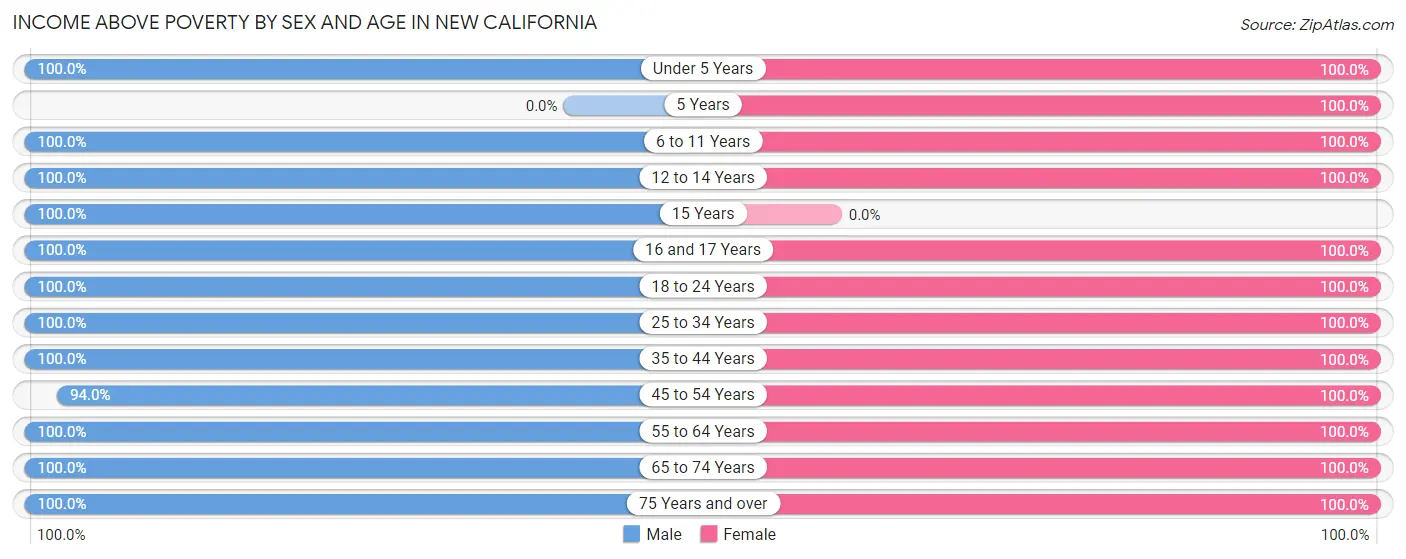
Income Above Poverty by Sex and Age in New California
According to the poverty statistics in New California, males aged under 5 years and females aged under 5 years are the age groups that are most secure financially, with 100.0% of males and 100.0% of females in these age groups living above the poverty line.
| Age Bracket | Male | Female |
| Under 5 Years | 102 (100.0%) | 10 (100.0%) |
| 5 Years | 0 (0.0%) | 23 (100.0%) |
| 6 to 11 Years | 79 (100.0%) | 205 (100.0%) |
| 12 to 14 Years | 39 (100.0%) | 123 (100.0%) |
| 15 Years | 44 (100.0%) | 0 (0.0%) |
| 16 and 17 Years | 8 (100.0%) | 7 (100.0%) |
| 18 to 24 Years | 66 (100.0%) | 50 (100.0%) |
| 25 to 34 Years | 51 (100.0%) | 42 (100.0%) |
| 35 to 44 Years | 90 (100.0%) | 271 (100.0%) |
| 45 to 54 Years | 264 (94.0%) | 120 (100.0%) |
| 55 to 64 Years | 85 (100.0%) | 66 (100.0%) |
| 65 to 74 Years | 26 (100.0%) | 45 (100.0%) |
| 75 Years and over | 44 (100.0%) | 32 (100.0%) |
| Total | 898 (98.1%) | 994 (100.0%) |
Income Below Poverty Among Married-Couple Families in New California
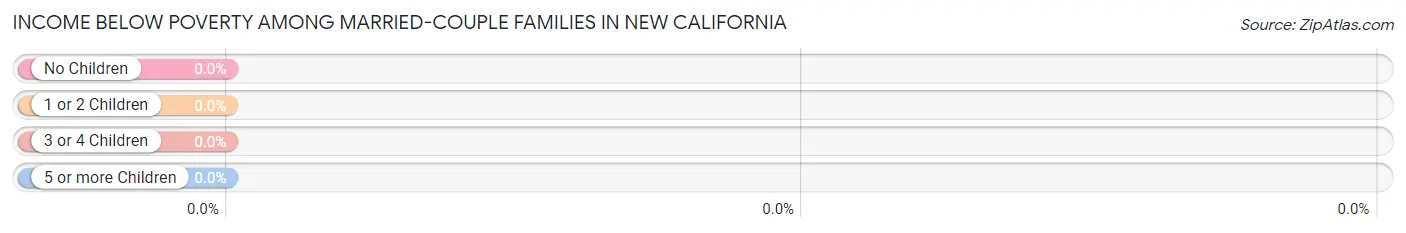
| Children | Above Poverty | Below Poverty |
| No Children | 186 (100.0%) | 0 (0.0%) |
| 1 or 2 Children | 277 (100.0%) | 0 (0.0%) |
| 3 or 4 Children | 24 (100.0%) | 0 (0.0%) |
| 5 or more Children | 0 (0.0%) | 0 (0.0%) |
| Total | 487 (100.0%) | 0 (0.0%) |
Income Below Poverty Among Single-Parent Households in New California
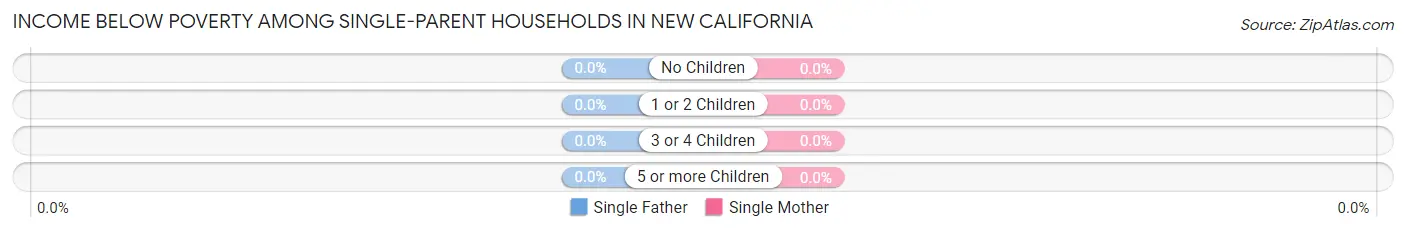
| Children | Single Father | Single Mother |
| No Children | 0 (0.0%) | 0 (0.0%) |
| 1 or 2 Children | 0 (0.0%) | 0 (0.0%) |
| 3 or 4 Children | 0 (0.0%) | 0 (0.0%) |
| 5 or more Children | 0 (0.0%) | 0 (0.0%) |
| Total | 0 (0.0%) | 0 (0.0%) |
Income Below Poverty Among Married-Couple vs Single-Parent Households in New California
| Children | Married-Couple Families | Single-Parent Households |
| No Children | 0 (0.0%) | 0 (0.0%) |
| 1 or 2 Children | 0 (0.0%) | 0 (0.0%) |
| 3 or 4 Children | 0 (0.0%) | 0 (0.0%) |
| 5 or more Children | 0 (0.0%) | 0 (0.0%) |
| Total | 0 (0.0%) | 0 (0.0%) |
Employment Characteristics in New California
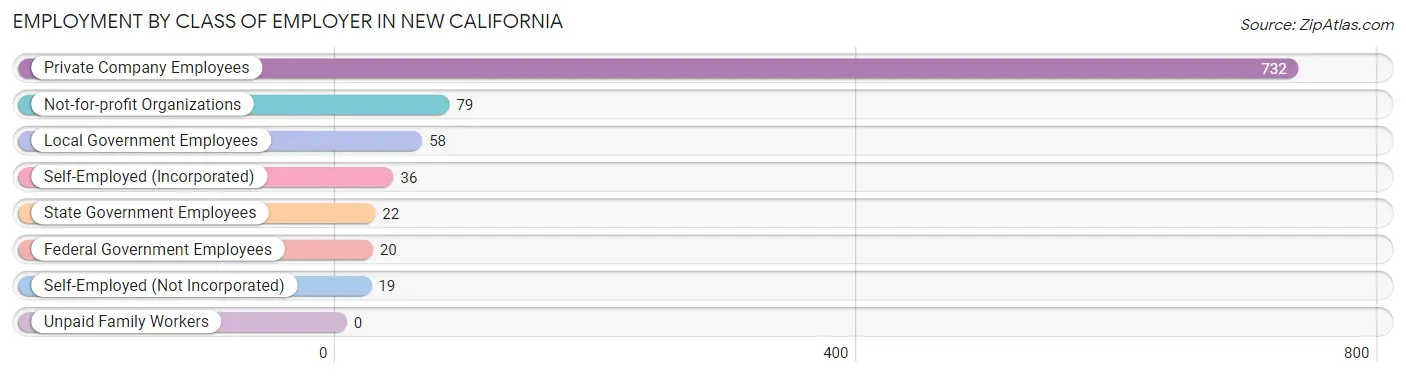
Employment by Class of Employer in New California
Among the 966 employed individuals in New California, private company employees (732 | 75.8%), not-for-profit organizations (79 | 8.2%), and local government employees (58 | 6.0%) make up the most common classes of employment.
| Employer Class | # Employees | % Employees |
| Private Company Employees | 732 | 75.8% |
| Self-Employed (Incorporated) | 36 | 3.7% |
| Self-Employed (Not Incorporated) | 19 | 2.0% |
| Not-for-profit Organizations | 79 | 8.2% |
| Local Government Employees | 58 | 6.0% |
| State Government Employees | 22 | 2.3% |
| Federal Government Employees | 20 | 2.1% |
| Unpaid Family Workers | 0 | 0.0% |
| Total | 966 | 100.0% |
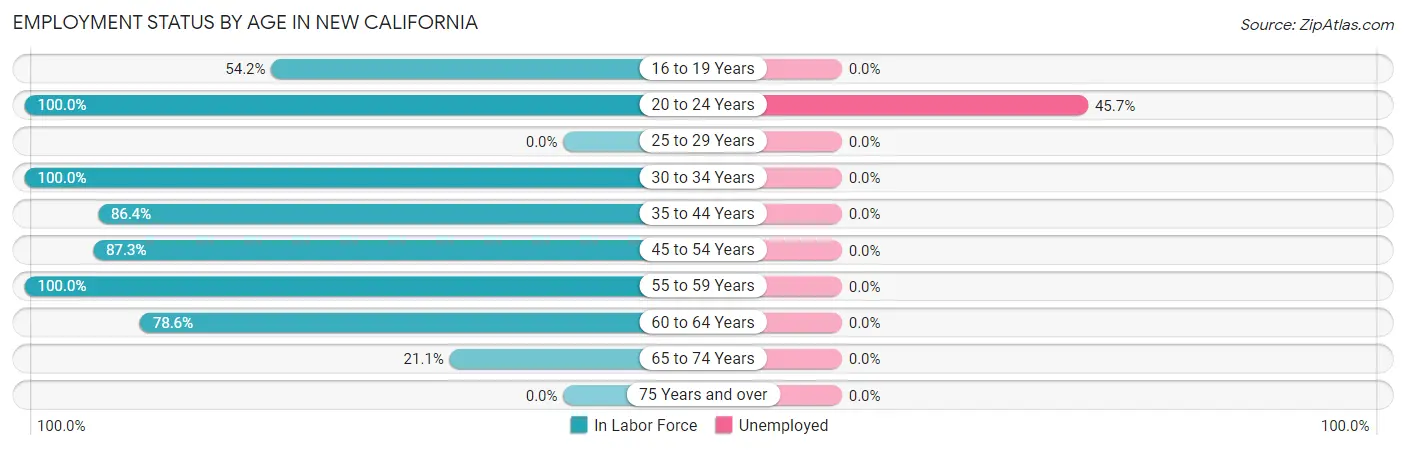
Employment Status by Age in New California
According to the labor force statistics for New California, out of the total population over 16 years of age (1,284), 77.6% or 996 individuals are in the labor force, with 1.6% or 16 of them unemployed. The age group with the highest labor force participation rate is 20 to 24 years, with 100.0% or 35 individuals in the labor force. Within the labor force, the 20 to 24 years age range has the highest percentage of unemployed individuals, with 45.7% or 16 of them being unemployed.
| Age Bracket | In Labor Force | Unemployed |
| 16 to 19 Years | 52 (54.2%) | 0 (0.0%) |
| 20 to 24 Years | 35 (100.0%) | 16 (45.7%) |
| 25 to 29 Years | 0 (0.0%) | 0 (0.0%) |
| 30 to 34 Years | 93 (100.0%) | 0 (0.0%) |
| 35 to 44 Years | 312 (86.4%) | 0 (0.0%) |
| 45 to 54 Years | 350 (87.3%) | 0 (0.0%) |
| 55 to 59 Years | 95 (100.0%) | 0 (0.0%) |
| 60 to 64 Years | 44 (78.6%) | 0 (0.0%) |
| 65 to 74 Years | 15 (21.1%) | 0 (0.0%) |
| 75 Years and over | 0 (0.0%) | 0 (0.0%) |
| Total | 996 (77.6%) | 16 (1.6%) |
Employment Status by Educational Attainment in New California
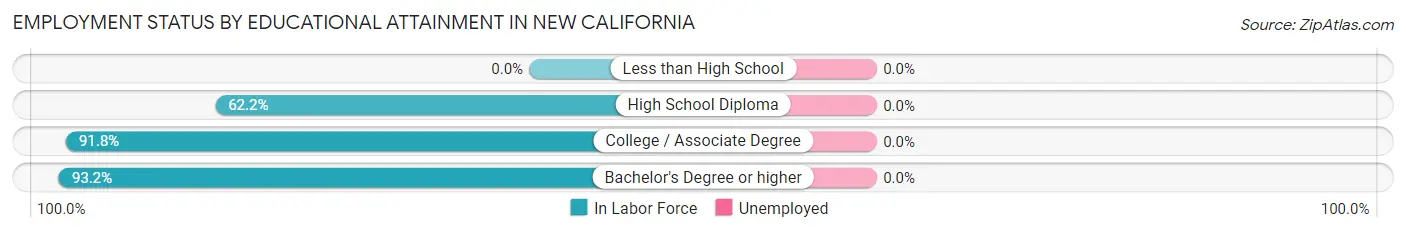
| Educational Attainment | In Labor Force | Unemployed |
| Less than High School | 0 (0.0%) | 0 (0.0%) |
| High School Diploma | 84 (62.2%) | 0 (0.0%) |
| College / Associate Degree | 112 (91.8%) | 0 (0.0%) |
| Bachelor's Degree or higher | 698 (93.2%) | 0 (0.0%) |
| Total | 894 (88.9%) | 0 (0.0%) |
Employment Occupations by Sex in New California
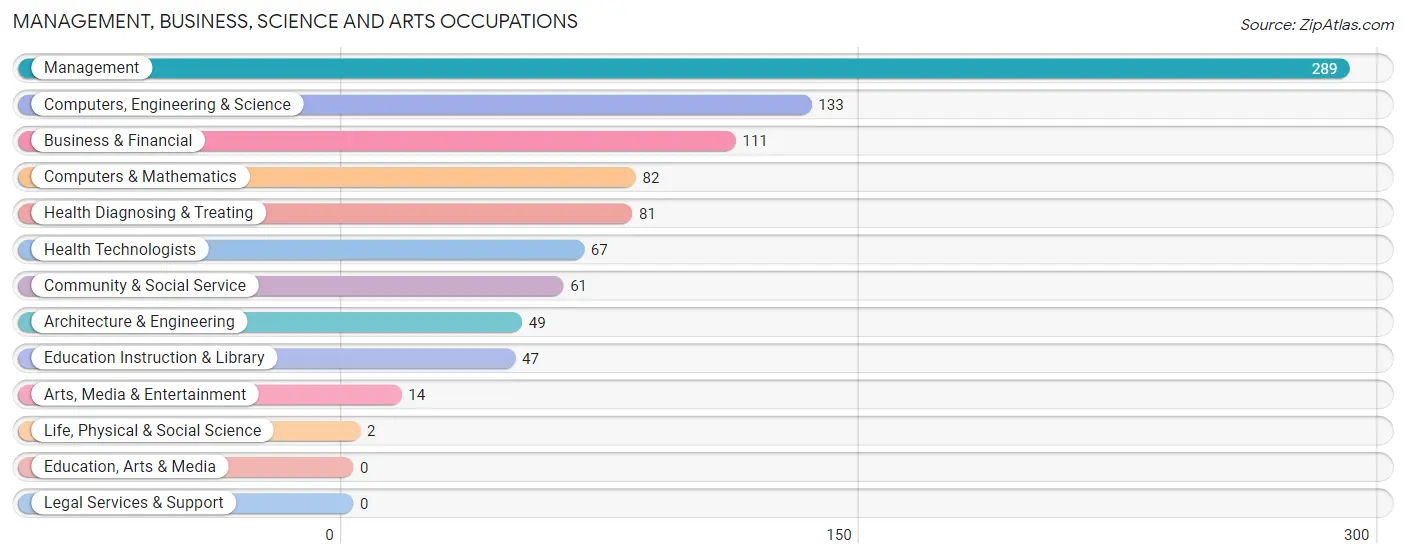
Management, Business, Science and Arts Occupations
The most common Management, Business, Science and Arts occupations in New California are Management (289 | 29.5%), Computers, Engineering & Science (133 | 13.6%), Business & Financial (111 | 11.3%), Computers & Mathematics (82 | 8.4%), and Health Diagnosing & Treating (81 | 8.3%).
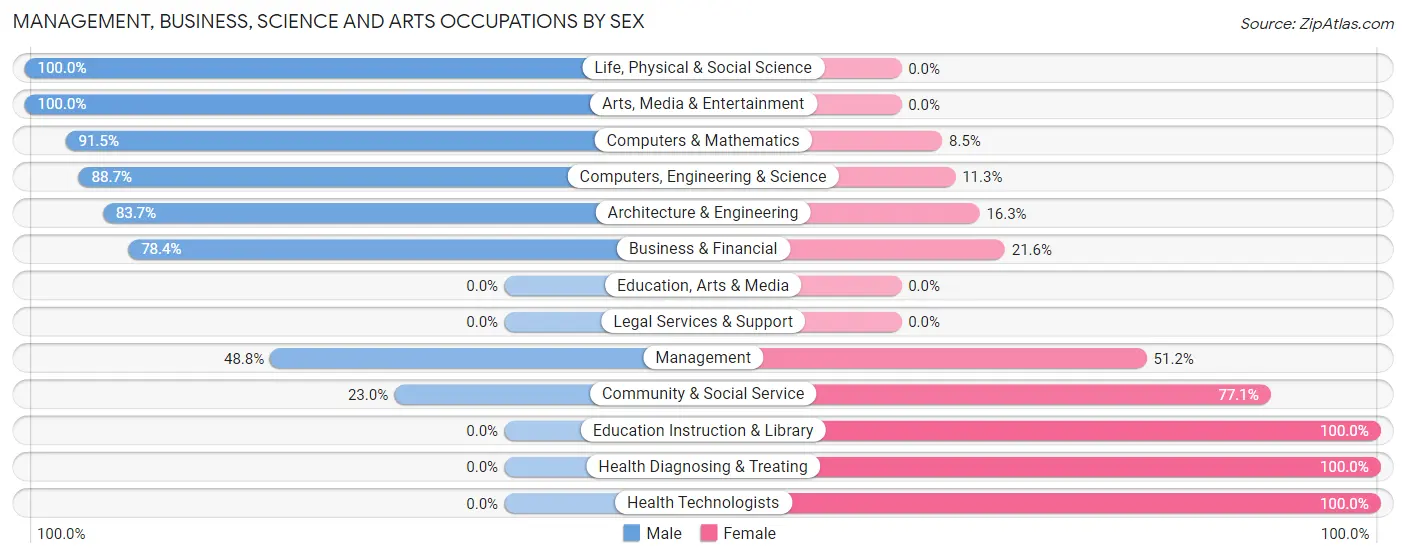
Management, Business, Science and Arts Occupations by Sex
Within the Management, Business, Science and Arts occupations in New California, the most male-oriented occupations are Life, Physical & Social Science (100.0%), Arts, Media & Entertainment (100.0%), and Computers & Mathematics (91.5%), while the most female-oriented occupations are Education Instruction & Library (100.0%), Health Diagnosing & Treating (100.0%), and Health Technologists (100.0%).
| Occupation | Male | Female |
| Management | 141 (48.8%) | 148 (51.2%) |
| Business & Financial | 87 (78.4%) | 24 (21.6%) |
| Computers, Engineering & Science | 118 (88.7%) | 15 (11.3%) |
| Computers & Mathematics | 75 (91.5%) | 7 (8.5%) |
| Architecture & Engineering | 41 (83.7%) | 8 (16.3%) |
| Life, Physical & Social Science | 2 (100.0%) | 0 (0.0%) |
| Community & Social Service | 14 (23.0%) | 47 (77.0%) |
| Education, Arts & Media | 0 (0.0%) | 0 (0.0%) |
| Legal Services & Support | 0 (0.0%) | 0 (0.0%) |
| Education Instruction & Library | 0 (0.0%) | 47 (100.0%) |
| Arts, Media & Entertainment | 14 (100.0%) | 0 (0.0%) |
| Health Diagnosing & Treating | 0 (0.0%) | 81 (100.0%) |
| Health Technologists | 0 (0.0%) | 67 (100.0%) |
| Total (Category) | 360 (53.3%) | 315 (46.7%) |
| Total (Overall) | 477 (48.7%) | 503 (51.3%) |
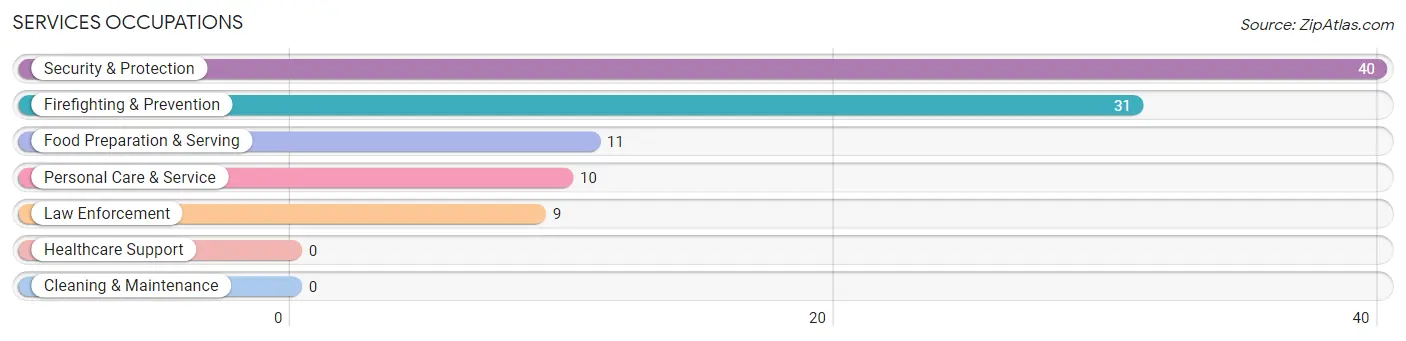
Services Occupations
The most common Services occupations in New California are Security & Protection (40 | 4.1%), Firefighting & Prevention (31 | 3.2%), Food Preparation & Serving (11 | 1.1%), Personal Care & Service (10 | 1.0%), and Law Enforcement (9 | 0.9%).
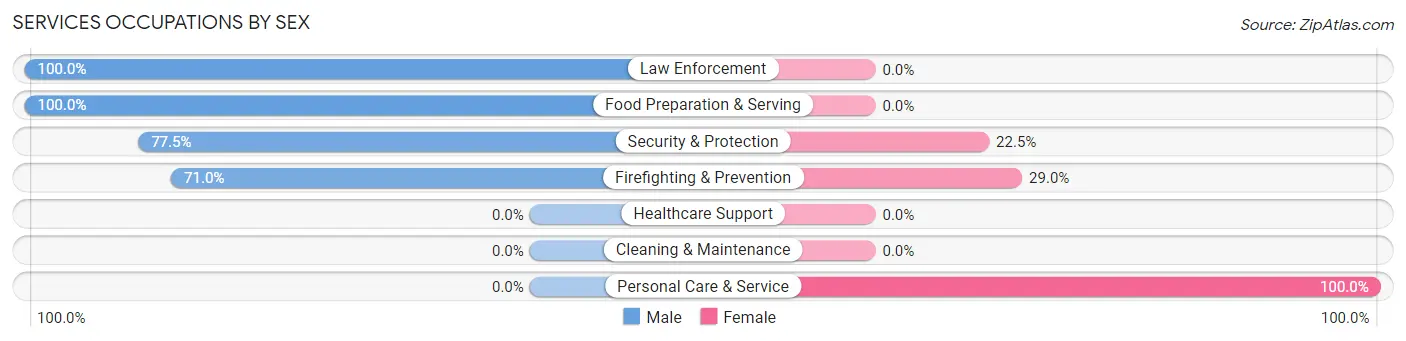
Services Occupations by Sex
Within the Services occupations in New California, the most male-oriented occupations are Law Enforcement (100.0%), Food Preparation & Serving (100.0%), and Security & Protection (77.5%), while the most female-oriented occupations are Personal Care & Service (100.0%), Firefighting & Prevention (29.0%), and Security & Protection (22.5%).
| Occupation | Male | Female |
| Healthcare Support | 0 (0.0%) | 0 (0.0%) |
| Security & Protection | 31 (77.5%) | 9 (22.5%) |
| Firefighting & Prevention | 22 (71.0%) | 9 (29.0%) |
| Law Enforcement | 9 (100.0%) | 0 (0.0%) |
| Food Preparation & Serving | 11 (100.0%) | 0 (0.0%) |
| Cleaning & Maintenance | 0 (0.0%) | 0 (0.0%) |
| Personal Care & Service | 0 (0.0%) | 10 (100.0%) |
| Total (Category) | 42 (68.9%) | 19 (31.1%) |
| Total (Overall) | 477 (48.7%) | 503 (51.3%) |
Sales and Office Occupations
The most common Sales and Office occupations in New California are Sales & Related (123 | 12.6%), and Office & Administration (65 | 6.6%).
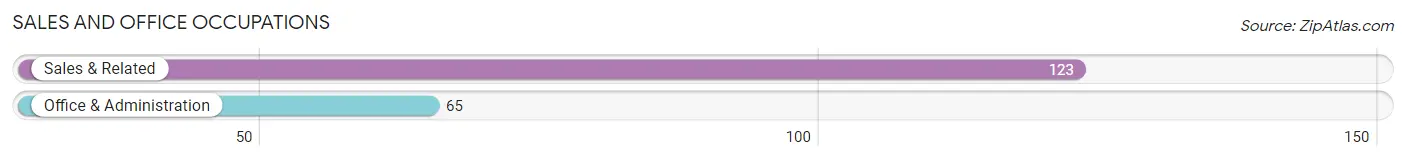
Sales and Office Occupations by Sex

| Occupation | Male | Female |
| Sales & Related | 29 (23.6%) | 94 (76.4%) |
| Office & Administration | 0 (0.0%) | 65 (100.0%) |
| Total (Category) | 29 (15.4%) | 159 (84.6%) |
| Total (Overall) | 477 (48.7%) | 503 (51.3%) |
Natural Resources, Construction and Maintenance Occupations
The most common Natural Resources, Construction and Maintenance occupations in New California are , and Installation, Maintenance & Repair (12 | 1.2%).
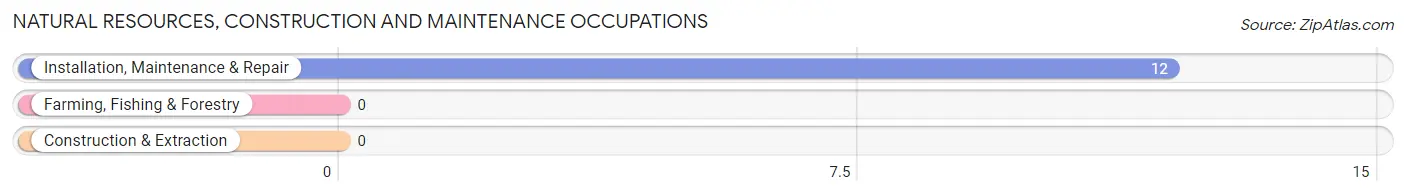
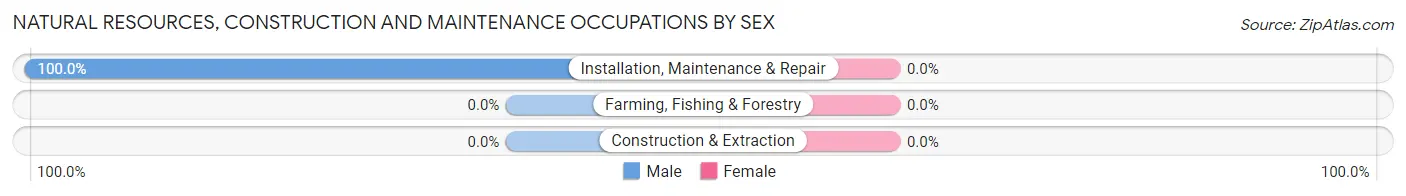
Natural Resources, Construction and Maintenance Occupations by Sex
| Occupation | Male | Female |
| Farming, Fishing & Forestry | 0 (0.0%) | 0 (0.0%) |
| Construction & Extraction | 0 (0.0%) | 0 (0.0%) |
| Installation, Maintenance & Repair | 12 (100.0%) | 0 (0.0%) |
| Total (Category) | 12 (100.0%) | 0 (0.0%) |
| Total (Overall) | 477 (48.7%) | 503 (51.3%) |
Production, Transportation and Moving Occupations
The most common Production, Transportation and Moving occupations in New California are Production (23 | 2.4%), and Material Moving (21 | 2.1%).
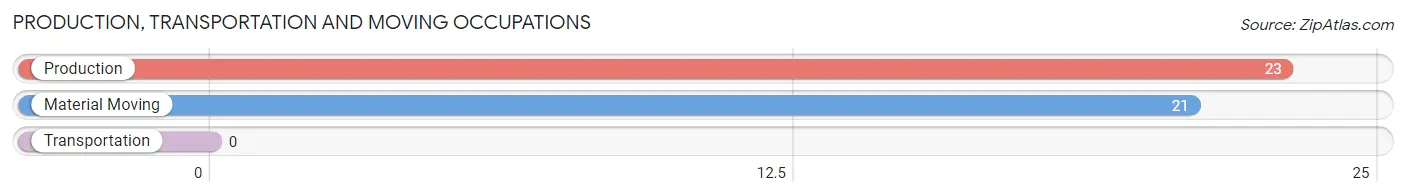
Production, Transportation and Moving Occupations by Sex
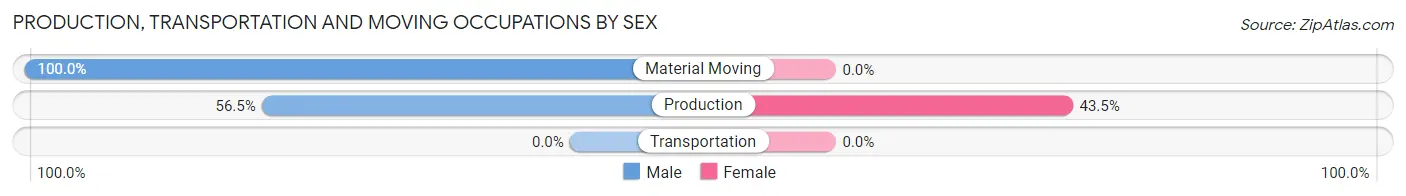
| Occupation | Male | Female |
| Production | 13 (56.5%) | 10 (43.5%) |
| Transportation | 0 (0.0%) | 0 (0.0%) |
| Material Moving | 21 (100.0%) | 0 (0.0%) |
| Total (Category) | 34 (77.3%) | 10 (22.7%) |
| Total (Overall) | 477 (48.7%) | 503 (51.3%) |
Employment Industries by Sex in New California
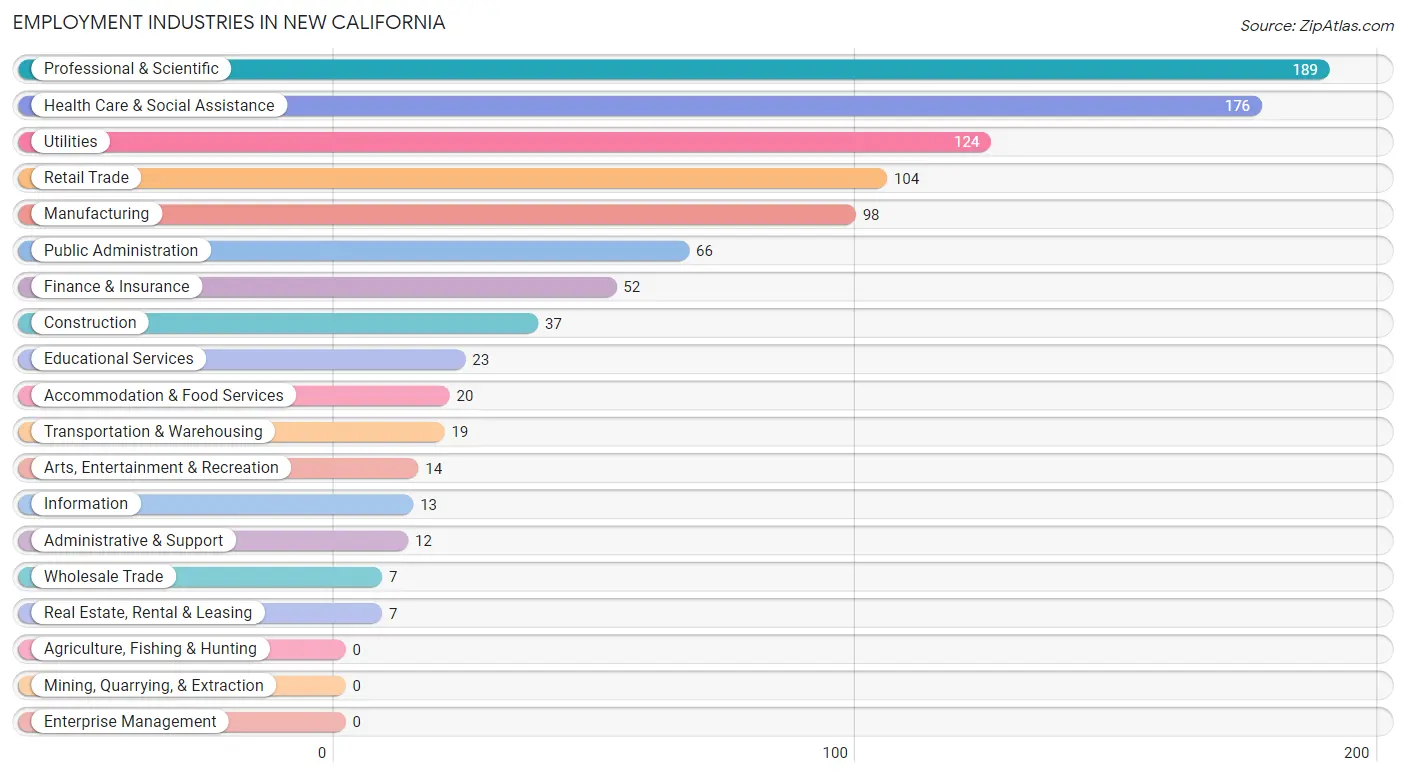
Employment Industries in New California
The major employment industries in New California include Professional & Scientific (189 | 19.3%), Health Care & Social Assistance (176 | 18.0%), Utilities (124 | 12.7%), Retail Trade (104 | 10.6%), and Manufacturing (98 | 10.0%).
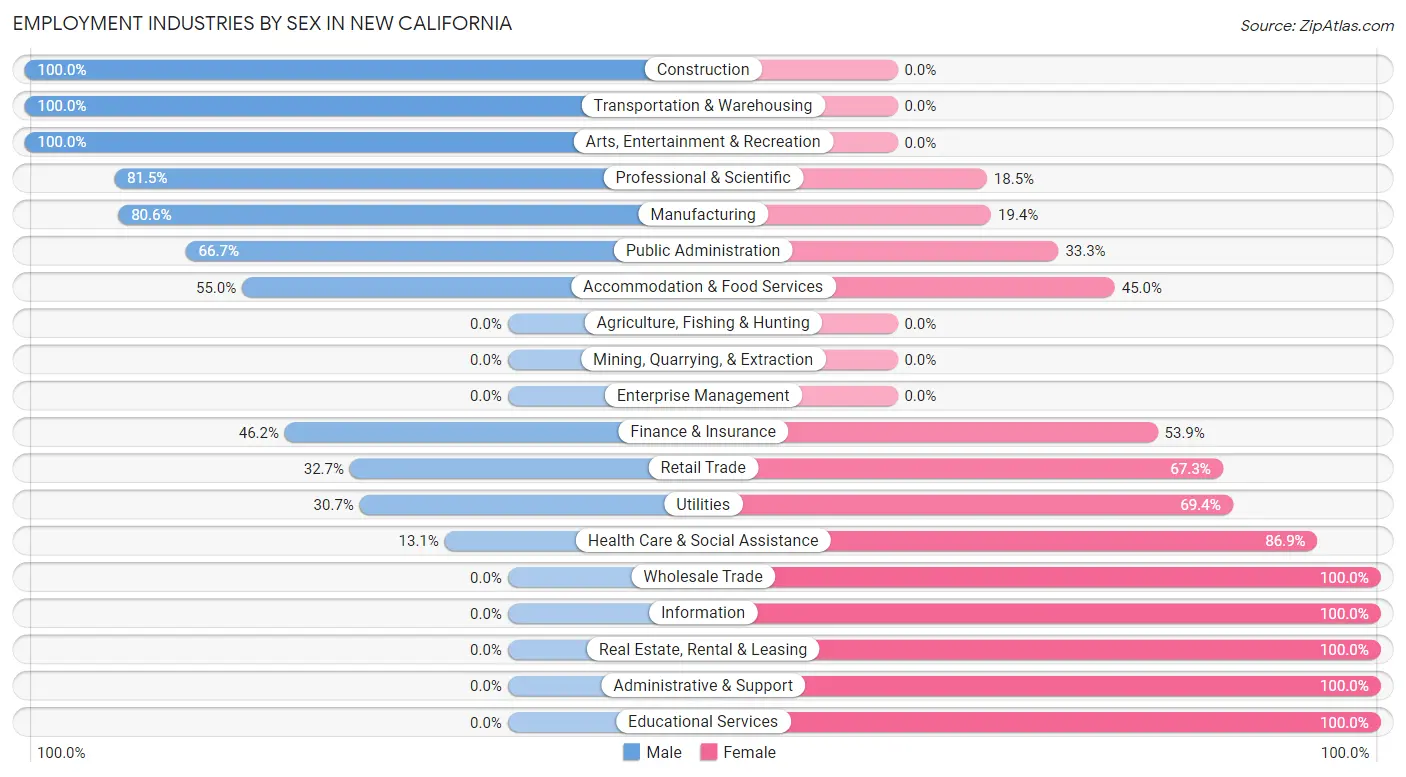
Employment Industries by Sex in New California
The New California industries that see more men than women are Construction (100.0%), Transportation & Warehousing (100.0%), and Arts, Entertainment & Recreation (100.0%), whereas the industries that tend to have a higher number of women are Wholesale Trade (100.0%), Information (100.0%), and Real Estate, Rental & Leasing (100.0%).
| Industry | Male | Female |
| Agriculture, Fishing & Hunting | 0 (0.0%) | 0 (0.0%) |
| Mining, Quarrying, & Extraction | 0 (0.0%) | 0 (0.0%) |
| Construction | 37 (100.0%) | 0 (0.0%) |
| Manufacturing | 79 (80.6%) | 19 (19.4%) |
| Wholesale Trade | 0 (0.0%) | 7 (100.0%) |
| Retail Trade | 34 (32.7%) | 70 (67.3%) |
| Transportation & Warehousing | 19 (100.0%) | 0 (0.0%) |
| Utilities | 38 (30.6%) | 86 (69.4%) |
| Information | 0 (0.0%) | 13 (100.0%) |
| Finance & Insurance | 24 (46.2%) | 28 (53.8%) |
| Real Estate, Rental & Leasing | 0 (0.0%) | 7 (100.0%) |
| Professional & Scientific | 154 (81.5%) | 35 (18.5%) |
| Enterprise Management | 0 (0.0%) | 0 (0.0%) |
| Administrative & Support | 0 (0.0%) | 12 (100.0%) |
| Educational Services | 0 (0.0%) | 23 (100.0%) |
| Health Care & Social Assistance | 23 (13.1%) | 153 (86.9%) |
| Arts, Entertainment & Recreation | 14 (100.0%) | 0 (0.0%) |
| Accommodation & Food Services | 11 (55.0%) | 9 (45.0%) |
| Public Administration | 44 (66.7%) | 22 (33.3%) |
| Total | 477 (48.7%) | 503 (51.3%) |
Education in New California
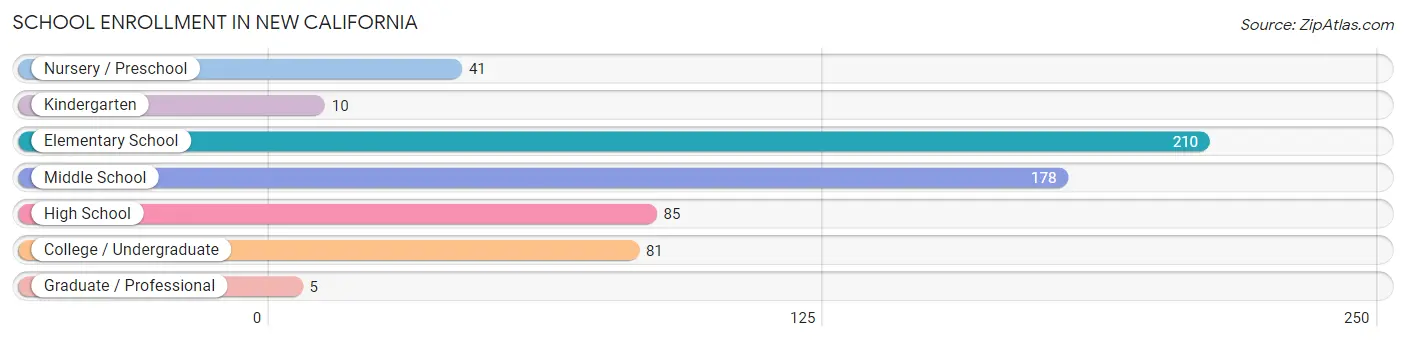
School Enrollment in New California
The most common levels of schooling among the 610 students in New California are elementary school (210 | 34.4%), middle school (178 | 29.2%), and high school (85 | 13.9%).
| School Level | # Students | % Students |
| Nursery / Preschool | 41 | 6.7% |
| Kindergarten | 10 | 1.6% |
| Elementary School | 210 | 34.4% |
| Middle School | 178 | 29.2% |
| High School | 85 | 13.9% |
| College / Undergraduate | 81 | 13.3% |
| Graduate / Professional | 5 | 0.8% |
| Total | 610 | 100.0% |
School Enrollment by Age by Funding Source in New California
Out of a total of 610 students who are enrolled in schools in New California, 55 (9.0%) attend a private institution, while the remaining 555 (91.0%) are enrolled in public schools. The age group of 3 to 4 year olds has the highest likelihood of being enrolled in private schools, with 18 (100.0% in the age bracket) enrolled. Conversely, the age group of 15 to 17 year olds has the lowest likelihood of being enrolled in a private school, with 59 (100.0% in the age bracket) attending a public institution.
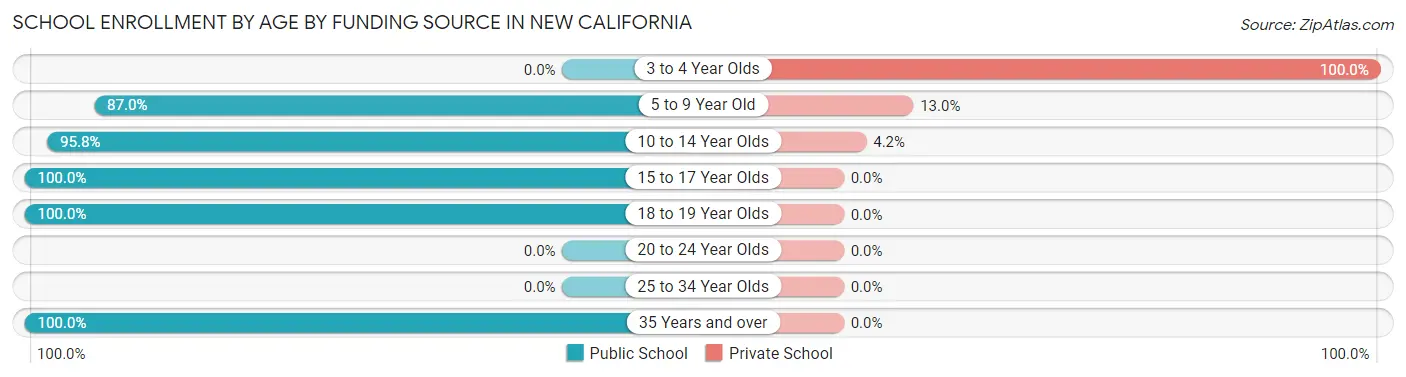
| Age Bracket | Public School | Private School |
| 3 to 4 Year Olds | 0 (0.0%) | 18 (100.0%) |
| 5 to 9 Year Old | 188 (87.0%) | 28 (13.0%) |
| 10 to 14 Year Olds | 205 (95.8%) | 9 (4.2%) |
| 15 to 17 Year Olds | 59 (100.0%) | 0 (0.0%) |
| 18 to 19 Year Olds | 81 (100.0%) | 0 (0.0%) |
| 20 to 24 Year Olds | 0 (0.0%) | 0 (0.0%) |
| 25 to 34 Year Olds | 0 (0.0%) | 0 (0.0%) |
| 35 Years and over | 22 (100.0%) | 0 (0.0%) |
| Total | 555 (91.0%) | 55 (9.0%) |
Educational Attainment by Field of Study in New California
Business (219 | 25.4%), science & technology (121 | 14.0%), engineering (119 | 13.8%), social sciences (74 | 8.6%), and bio, nature & agricultural (70 | 8.1%) are the most common fields of study among 862 individuals in New California who have obtained a bachelor's degree or higher.
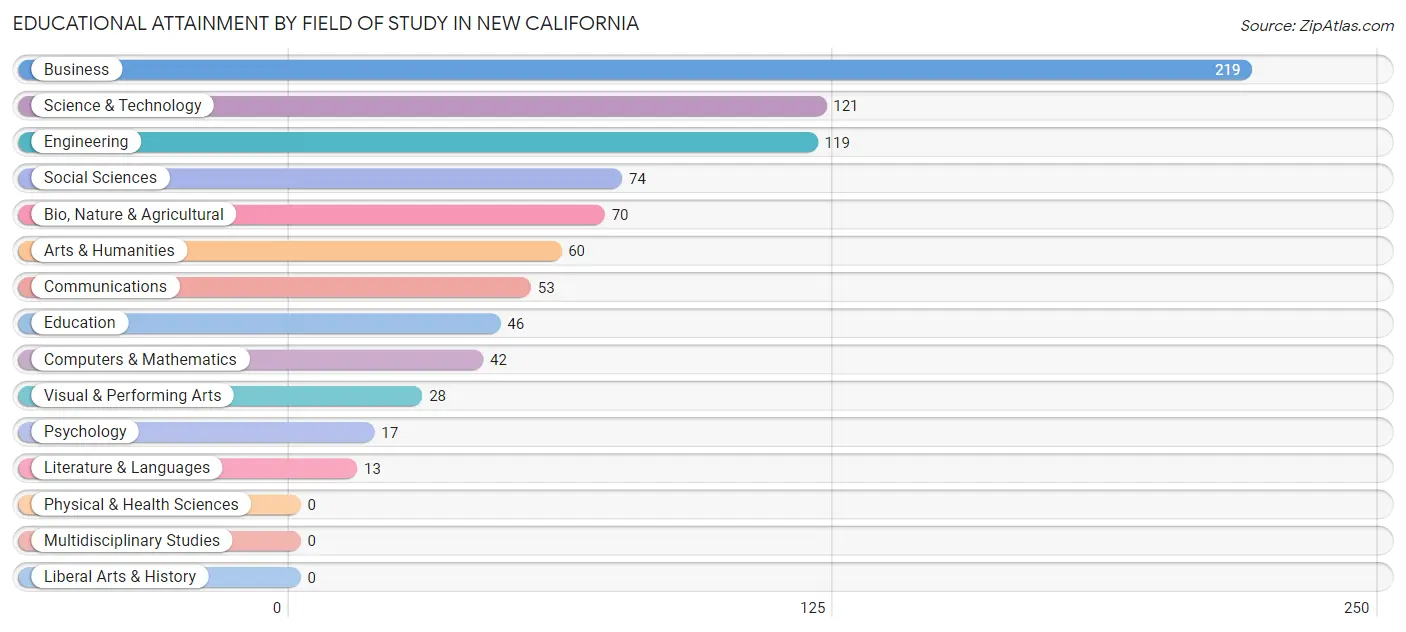
| Field of Study | # Graduates | % Graduates |
| Computers & Mathematics | 42 | 4.9% |
| Bio, Nature & Agricultural | 70 | 8.1% |
| Physical & Health Sciences | 0 | 0.0% |
| Psychology | 17 | 2.0% |
| Social Sciences | 74 | 8.6% |
| Engineering | 119 | 13.8% |
| Multidisciplinary Studies | 0 | 0.0% |
| Science & Technology | 121 | 14.0% |
| Business | 219 | 25.4% |
| Education | 46 | 5.3% |
| Literature & Languages | 13 | 1.5% |
| Liberal Arts & History | 0 | 0.0% |
| Visual & Performing Arts | 28 | 3.3% |
| Communications | 53 | 6.1% |
| Arts & Humanities | 60 | 7.0% |
| Total | 862 | 100.0% |
Transportation & Commute in New California
Vehicle Availability by Sex in New California
The most prevalent vehicle ownership categories in New California are males with 2 vehicles (220, accounting for 46.1%) and females with 2 vehicles (277, making up 45.0%).
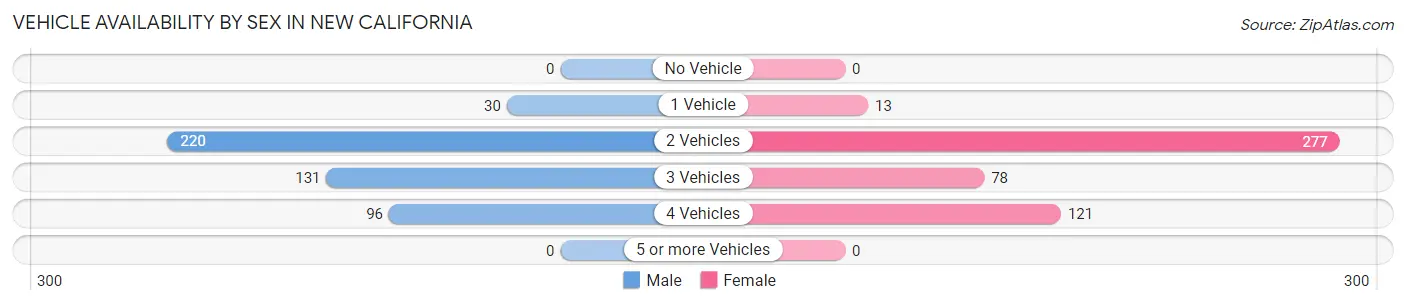
| Vehicles Available | Male | Female |
| No Vehicle | 0 (0.0%) | 0 (0.0%) |
| 1 Vehicle | 30 (6.3%) | 13 (2.7%) |
| 2 Vehicles | 220 (46.1%) | 277 (56.7%) |
| 3 Vehicles | 131 (27.5%) | 78 (16.0%) |
| 4 Vehicles | 96 (20.1%) | 121 (24.7%) |
| 5 or more Vehicles | 0 (0.0%) | 0 (0.0%) |
| Total | 477 (100.0%) | 489 (100.0%) |
Commute Time in New California
The most frequently occuring commute durations in New California are 30 to 34 minutes (248 commuters, 35.2%), 20 to 24 minutes (143 commuters, 20.3%), and 25 to 29 minutes (121 commuters, 17.2%).
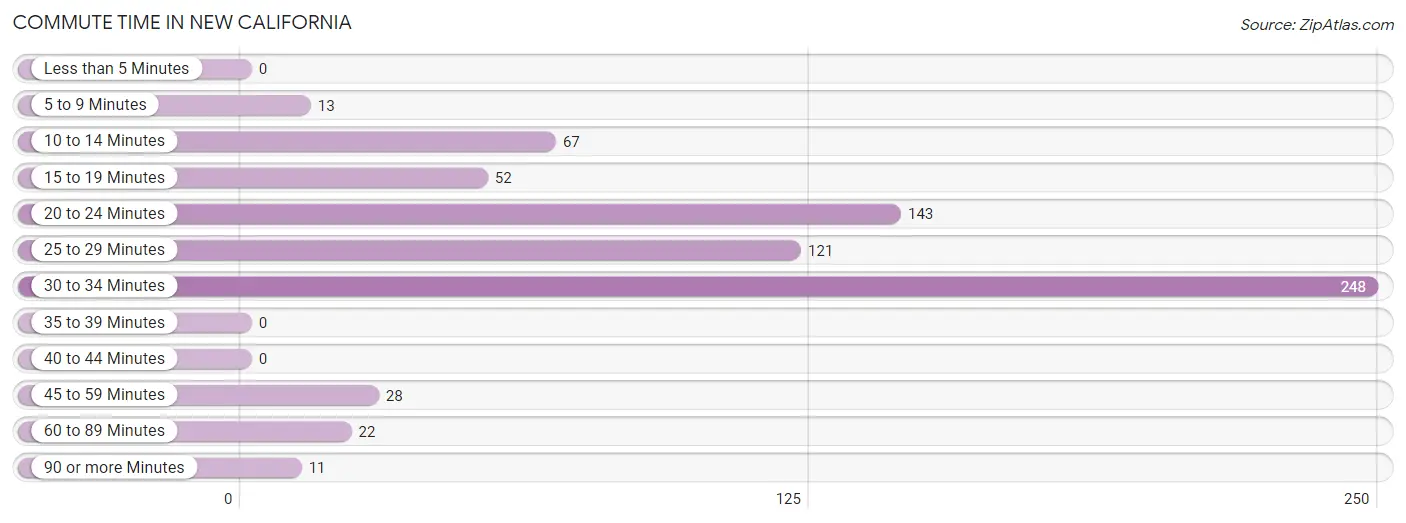
| Commute Time | # Commuters | % Commuters |
| Less than 5 Minutes | 0 | 0.0% |
| 5 to 9 Minutes | 13 | 1.8% |
| 10 to 14 Minutes | 67 | 9.5% |
| 15 to 19 Minutes | 52 | 7.4% |
| 20 to 24 Minutes | 143 | 20.3% |
| 25 to 29 Minutes | 121 | 17.2% |
| 30 to 34 Minutes | 248 | 35.2% |
| 35 to 39 Minutes | 0 | 0.0% |
| 40 to 44 Minutes | 0 | 0.0% |
| 45 to 59 Minutes | 28 | 4.0% |
| 60 to 89 Minutes | 22 | 3.1% |
| 90 or more Minutes | 11 | 1.6% |
Commute Time by Sex in New California
The most common commute times in New California are 30 to 34 minutes (163 commuters, 44.7%) for males and 30 to 34 minutes (85 commuters, 25.0%) for females.
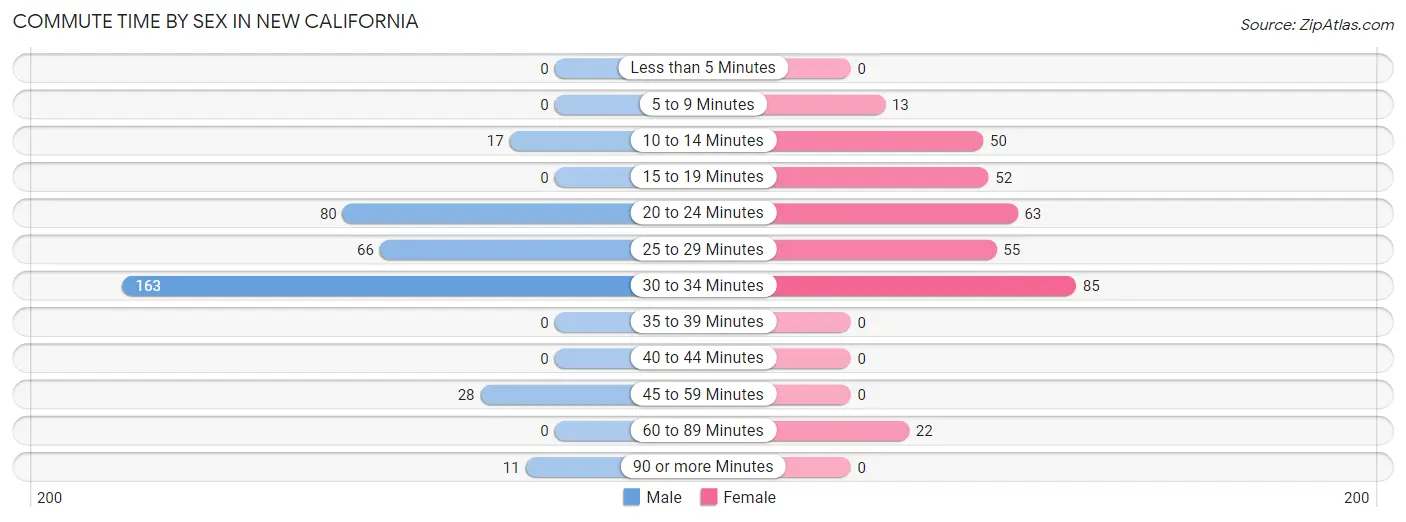
| Commute Time | Male | Female |
| Less than 5 Minutes | 0 (0.0%) | 0 (0.0%) |
| 5 to 9 Minutes | 0 (0.0%) | 13 (3.8%) |
| 10 to 14 Minutes | 17 (4.7%) | 50 (14.7%) |
| 15 to 19 Minutes | 0 (0.0%) | 52 (15.3%) |
| 20 to 24 Minutes | 80 (21.9%) | 63 (18.5%) |
| 25 to 29 Minutes | 66 (18.1%) | 55 (16.2%) |
| 30 to 34 Minutes | 163 (44.7%) | 85 (25.0%) |
| 35 to 39 Minutes | 0 (0.0%) | 0 (0.0%) |
| 40 to 44 Minutes | 0 (0.0%) | 0 (0.0%) |
| 45 to 59 Minutes | 28 (7.7%) | 0 (0.0%) |
| 60 to 89 Minutes | 0 (0.0%) | 22 (6.5%) |
| 90 or more Minutes | 11 (3.0%) | 0 (0.0%) |
Time of Departure to Work by Sex in New California
The most frequent times of departure to work in New California are 6:30 AM to 6:59 AM (90, 24.7%) for males and 7:00 AM to 7:29 AM (119, 35.0%) for females.
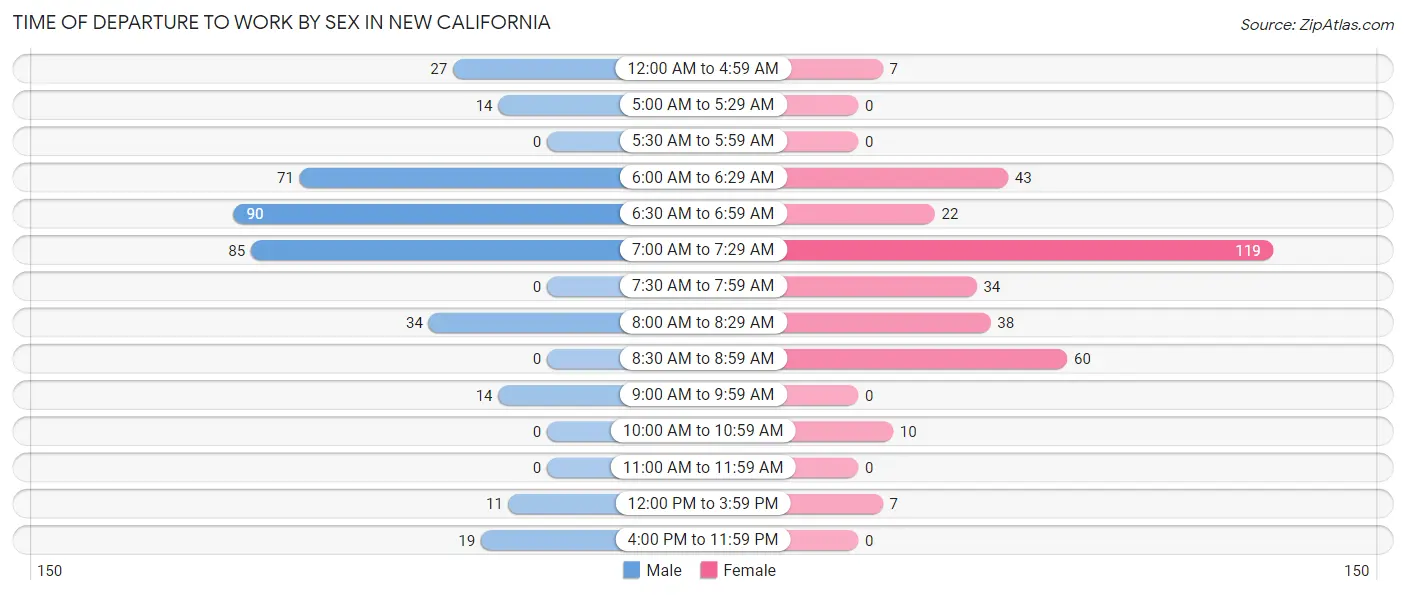
| Time of Departure | Male | Female |
| 12:00 AM to 4:59 AM | 27 (7.4%) | 7 (2.1%) |
| 5:00 AM to 5:29 AM | 14 (3.8%) | 0 (0.0%) |
| 5:30 AM to 5:59 AM | 0 (0.0%) | 0 (0.0%) |
| 6:00 AM to 6:29 AM | 71 (19.5%) | 43 (12.7%) |
| 6:30 AM to 6:59 AM | 90 (24.7%) | 22 (6.5%) |
| 7:00 AM to 7:29 AM | 85 (23.3%) | 119 (35.0%) |
| 7:30 AM to 7:59 AM | 0 (0.0%) | 34 (10.0%) |
| 8:00 AM to 8:29 AM | 34 (9.3%) | 38 (11.2%) |
| 8:30 AM to 8:59 AM | 0 (0.0%) | 60 (17.6%) |
| 9:00 AM to 9:59 AM | 14 (3.8%) | 0 (0.0%) |
| 10:00 AM to 10:59 AM | 0 (0.0%) | 10 (2.9%) |
| 11:00 AM to 11:59 AM | 0 (0.0%) | 0 (0.0%) |
| 12:00 PM to 3:59 PM | 11 (3.0%) | 7 (2.1%) |
| 4:00 PM to 11:59 PM | 19 (5.2%) | 0 (0.0%) |
| Total | 365 (100.0%) | 340 (100.0%) |
Housing Occupancy in New California
Occupancy by Ownership in New California
Of the total 566 dwellings in New California, owner-occupied units account for 539 (95.2%), while renter-occupied units make up 27 (4.8%).
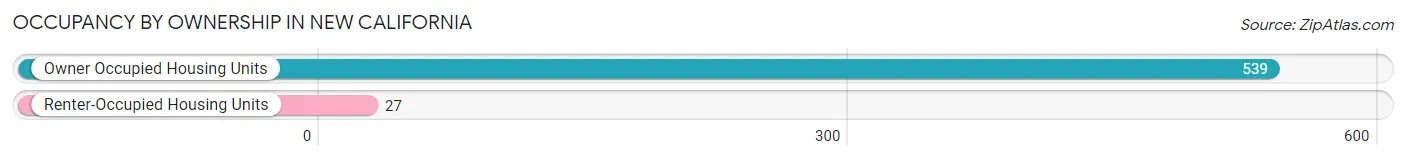
| Occupancy | # Housing Units | % Housing Units |
| Owner Occupied Housing Units | 539 | 95.2% |
| Renter-Occupied Housing Units | 27 | 4.8% |
| Total Occupied Housing Units | 566 | 100.0% |
Occupancy by Household Size in New California
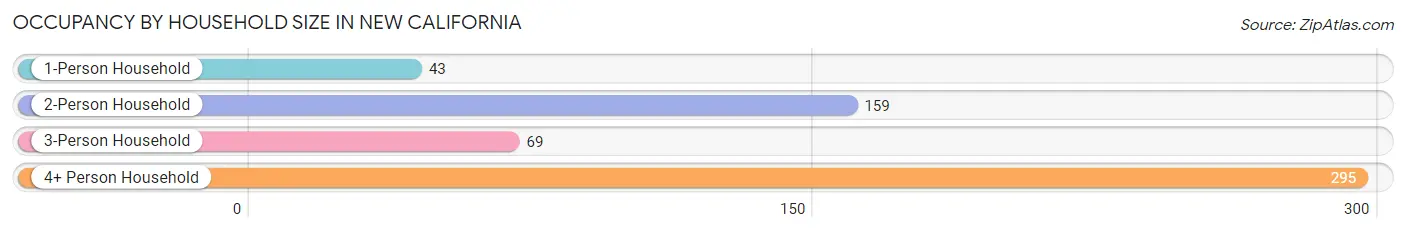
| Household Size | # Housing Units | % Housing Units |
| 1-Person Household | 43 | 7.6% |
| 2-Person Household | 159 | 28.1% |
| 3-Person Household | 69 | 12.2% |
| 4+ Person Household | 295 | 52.1% |
| Total Housing Units | 566 | 100.0% |
Occupancy by Ownership by Household Size in New California
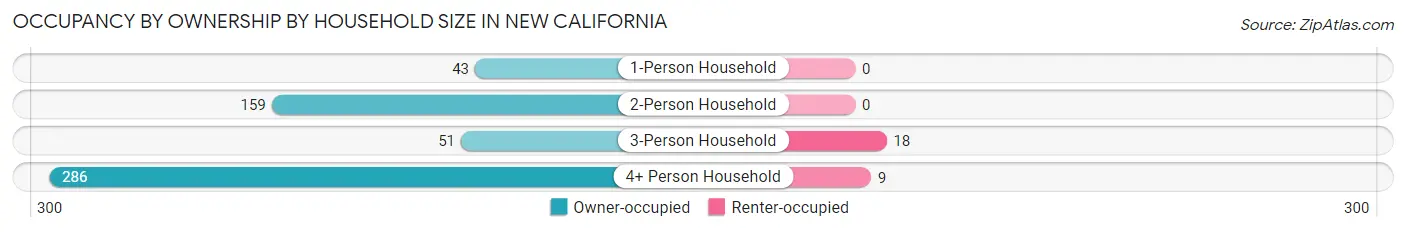
| Household Size | Owner-occupied | Renter-occupied |
| 1-Person Household | 43 (100.0%) | 0 (0.0%) |
| 2-Person Household | 159 (100.0%) | 0 (0.0%) |
| 3-Person Household | 51 (73.9%) | 18 (26.1%) |
| 4+ Person Household | 286 (97.0%) | 9 (3.0%) |
| Total Housing Units | 539 (95.2%) | 27 (4.8%) |
Occupancy by Educational Attainment in New California
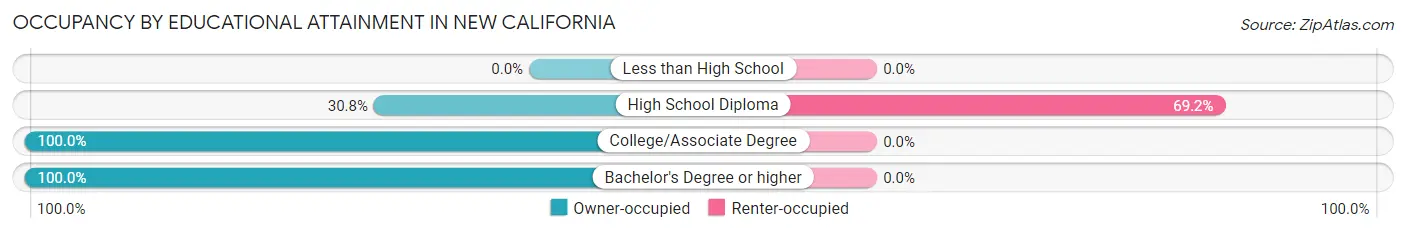
| Household Size | Owner-occupied | Renter-occupied |
| Less than High School | 0 (0.0%) | 0 (0.0%) |
| High School Diploma | 12 (30.8%) | 27 (69.2%) |
| College/Associate Degree | 98 (100.0%) | 0 (0.0%) |
| Bachelor's Degree or higher | 429 (100.0%) | 0 (0.0%) |
Occupancy by Age of Householder in New California
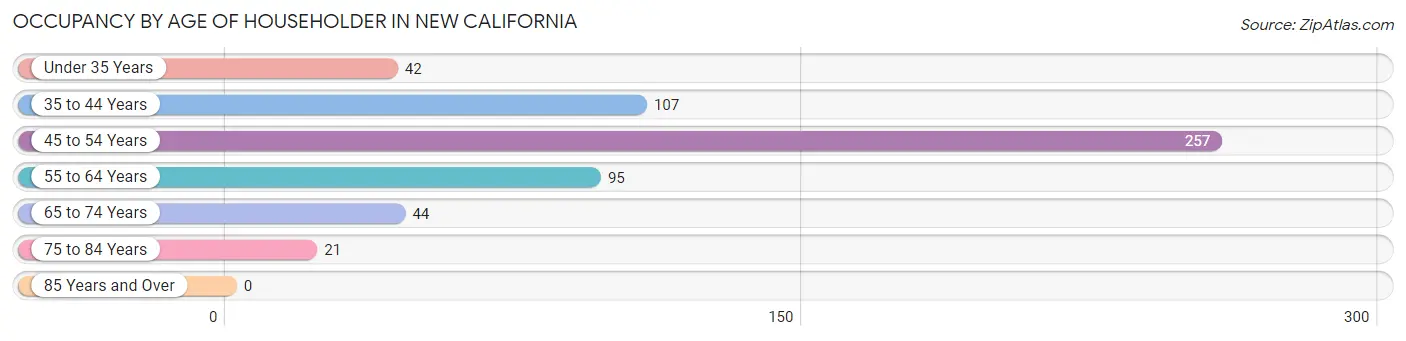
| Age Bracket | # Households | % Households |
| Under 35 Years | 42 | 7.4% |
| 35 to 44 Years | 107 | 18.9% |
| 45 to 54 Years | 257 | 45.4% |
| 55 to 64 Years | 95 | 16.8% |
| 65 to 74 Years | 44 | 7.8% |
| 75 to 84 Years | 21 | 3.7% |
| 85 Years and Over | 0 | 0.0% |
| Total | 566 | 100.0% |
Housing Finances in New California
Median Income by Occupancy in New California
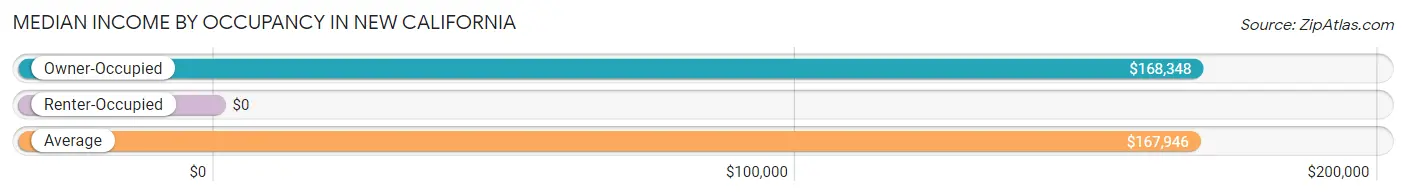
| Occupancy Type | # Households | Median Income |
| Owner-Occupied | 539 (95.2%) | $168,348 |
| Renter-Occupied | 27 (4.8%) | $0 |
| Average | 566 (100.0%) | $167,946 |
Occupancy by Householder Income Bracket in New California
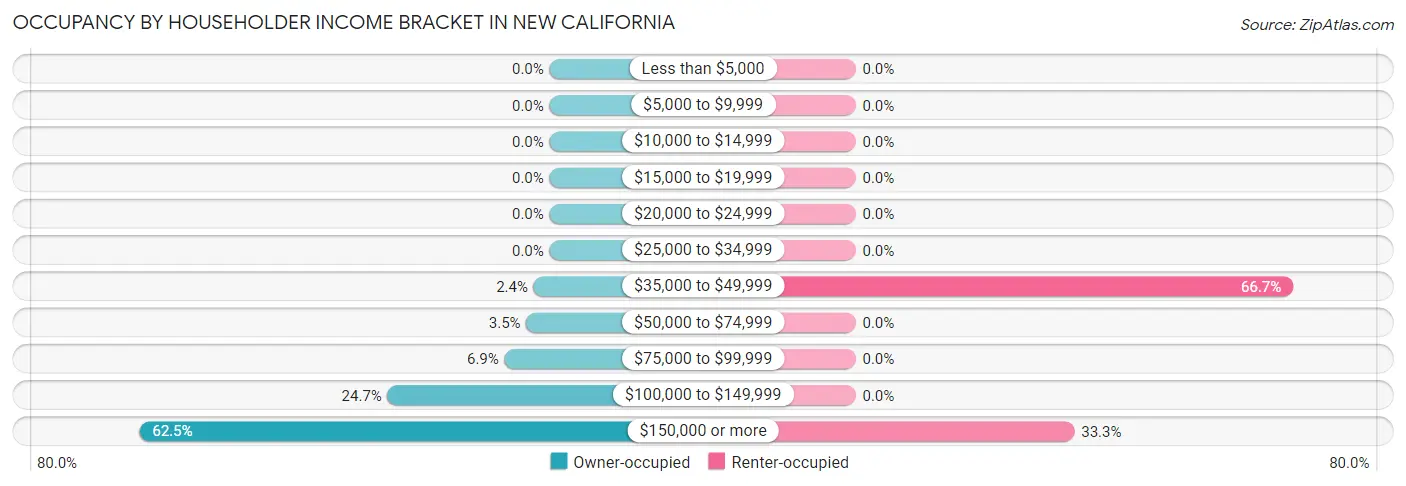
| Income Bracket | Owner-occupied | Renter-occupied |
| Less than $5,000 | 0 (0.0%) | 0 (0.0%) |
| $5,000 to $9,999 | 0 (0.0%) | 0 (0.0%) |
| $10,000 to $14,999 | 0 (0.0%) | 0 (0.0%) |
| $15,000 to $19,999 | 0 (0.0%) | 0 (0.0%) |
| $20,000 to $24,999 | 0 (0.0%) | 0 (0.0%) |
| $25,000 to $34,999 | 0 (0.0%) | 0 (0.0%) |
| $35,000 to $49,999 | 13 (2.4%) | 18 (66.7%) |
| $50,000 to $74,999 | 19 (3.5%) | 0 (0.0%) |
| $75,000 to $99,999 | 37 (6.9%) | 0 (0.0%) |
| $100,000 to $149,999 | 133 (24.7%) | 0 (0.0%) |
| $150,000 or more | 337 (62.5%) | 9 (33.3%) |
| Total | 539 (100.0%) | 27 (100.0%) |
Monthly Housing Cost Tiers in New California
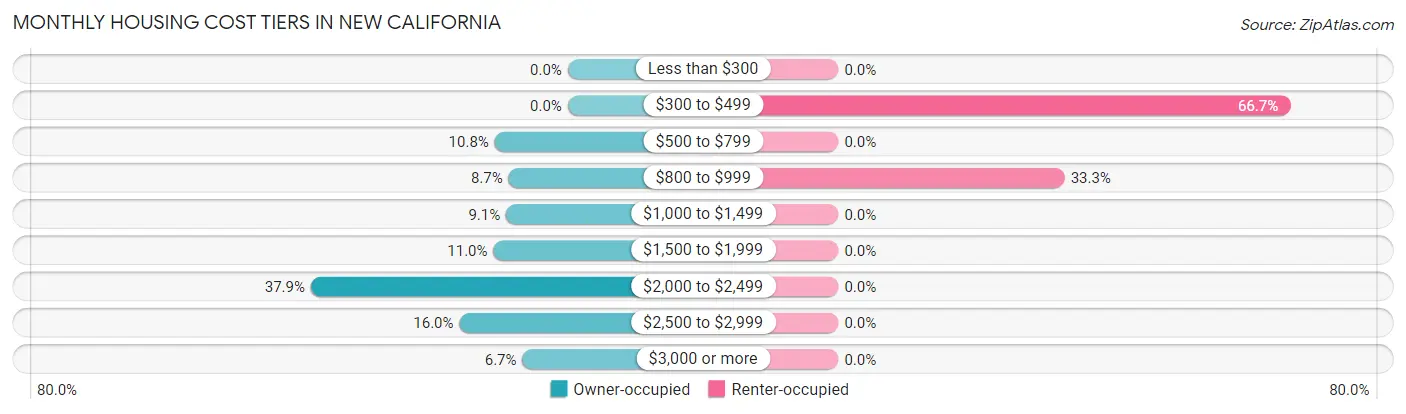
| Monthly Cost | Owner-occupied | Renter-occupied |
| Less than $300 | 0 (0.0%) | 0 (0.0%) |
| $300 to $499 | 0 (0.0%) | 18 (66.7%) |
| $500 to $799 | 58 (10.8%) | 0 (0.0%) |
| $800 to $999 | 47 (8.7%) | 9 (33.3%) |
| $1,000 to $1,499 | 49 (9.1%) | 0 (0.0%) |
| $1,500 to $1,999 | 59 (11.0%) | 0 (0.0%) |
| $2,000 to $2,499 | 204 (37.9%) | 0 (0.0%) |
| $2,500 to $2,999 | 86 (16.0%) | 0 (0.0%) |
| $3,000 or more | 36 (6.7%) | 0 (0.0%) |
| Total | 539 (100.0%) | 27 (100.0%) |
Physical Housing Characteristics in New California
Housing Structures in New California
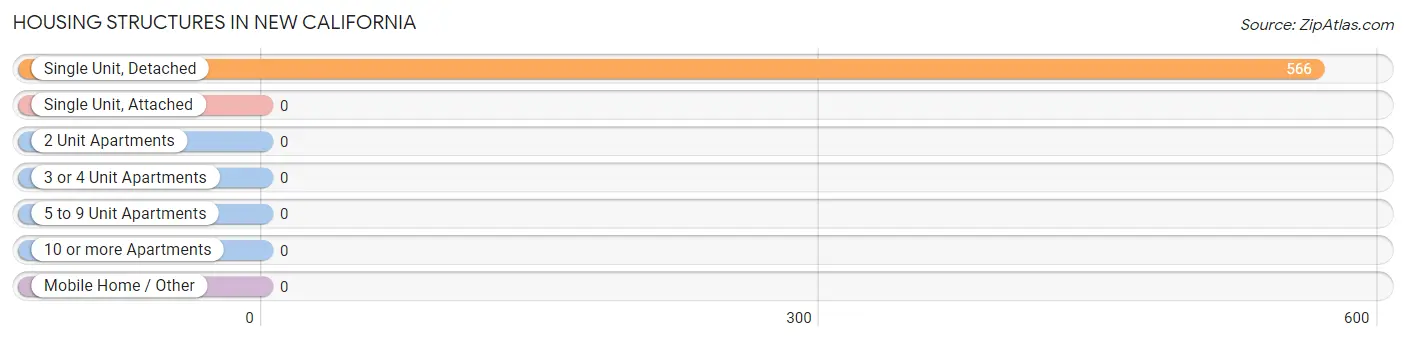
| Structure Type | # Housing Units | % Housing Units |
| Single Unit, Detached | 566 | 100.0% |
| Single Unit, Attached | 0 | 0.0% |
| 2 Unit Apartments | 0 | 0.0% |
| 3 or 4 Unit Apartments | 0 | 0.0% |
| 5 to 9 Unit Apartments | 0 | 0.0% |
| 10 or more Apartments | 0 | 0.0% |
| Mobile Home / Other | 0 | 0.0% |
| Total | 566 | 100.0% |
Housing Structures by Occupancy in New California
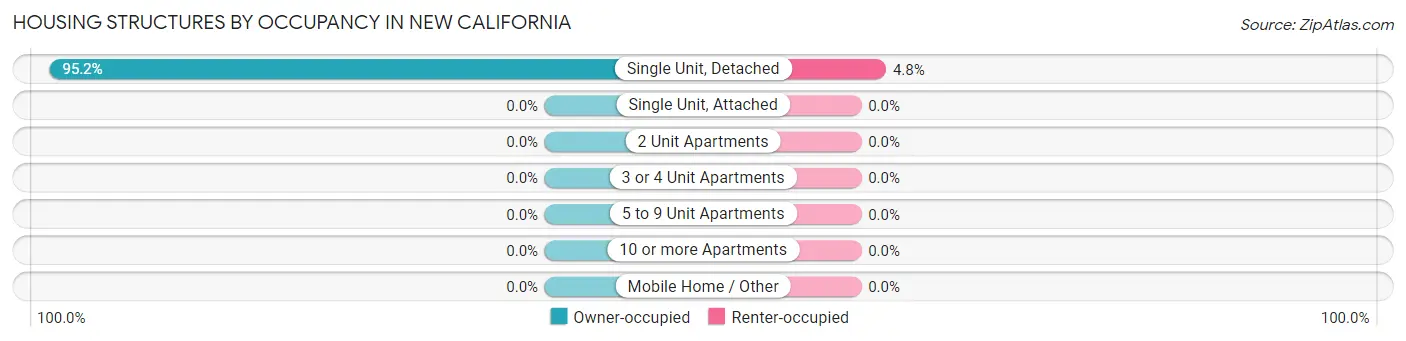
| Structure Type | Owner-occupied | Renter-occupied |
| Single Unit, Detached | 539 (95.2%) | 27 (4.8%) |
| Single Unit, Attached | 0 (0.0%) | 0 (0.0%) |
| 2 Unit Apartments | 0 (0.0%) | 0 (0.0%) |
| 3 or 4 Unit Apartments | 0 (0.0%) | 0 (0.0%) |
| 5 to 9 Unit Apartments | 0 (0.0%) | 0 (0.0%) |
| 10 or more Apartments | 0 (0.0%) | 0 (0.0%) |
| Mobile Home / Other | 0 (0.0%) | 0 (0.0%) |
| Total | 539 (95.2%) | 27 (4.8%) |
Housing Structures by Number of Rooms in New California
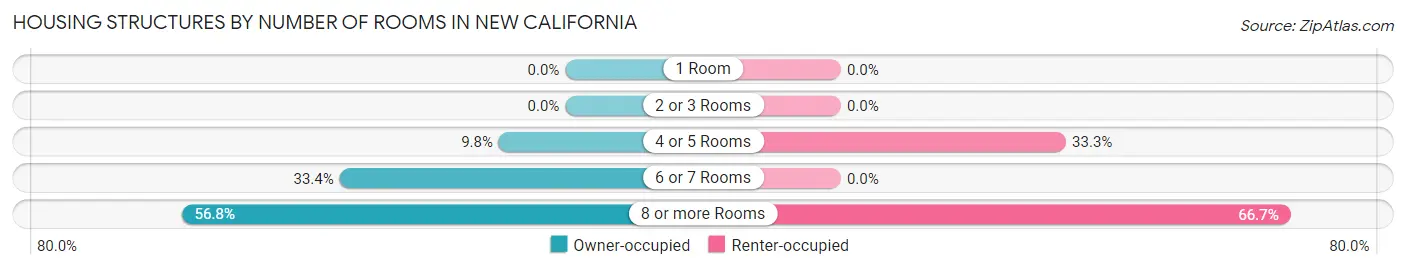
| Number of Rooms | Owner-occupied | Renter-occupied |
| 1 Room | 0 (0.0%) | 0 (0.0%) |
| 2 or 3 Rooms | 0 (0.0%) | 0 (0.0%) |
| 4 or 5 Rooms | 53 (9.8%) | 9 (33.3%) |
| 6 or 7 Rooms | 180 (33.4%) | 0 (0.0%) |
| 8 or more Rooms | 306 (56.8%) | 18 (66.7%) |
| Total | 539 (100.0%) | 27 (100.0%) |
Housing Structure by Heating Type in New California
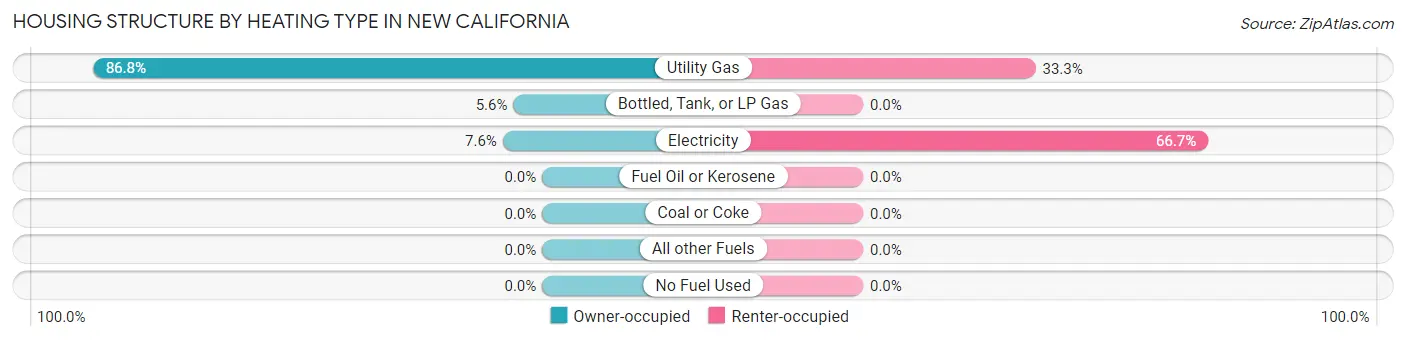
| Heating Type | Owner-occupied | Renter-occupied |
| Utility Gas | 468 (86.8%) | 9 (33.3%) |
| Bottled, Tank, or LP Gas | 30 (5.6%) | 0 (0.0%) |
| Electricity | 41 (7.6%) | 18 (66.7%) |
| Fuel Oil or Kerosene | 0 (0.0%) | 0 (0.0%) |
| Coal or Coke | 0 (0.0%) | 0 (0.0%) |
| All other Fuels | 0 (0.0%) | 0 (0.0%) |
| No Fuel Used | 0 (0.0%) | 0 (0.0%) |
| Total | 539 (100.0%) | 27 (100.0%) |
Household Vehicle Usage in New California
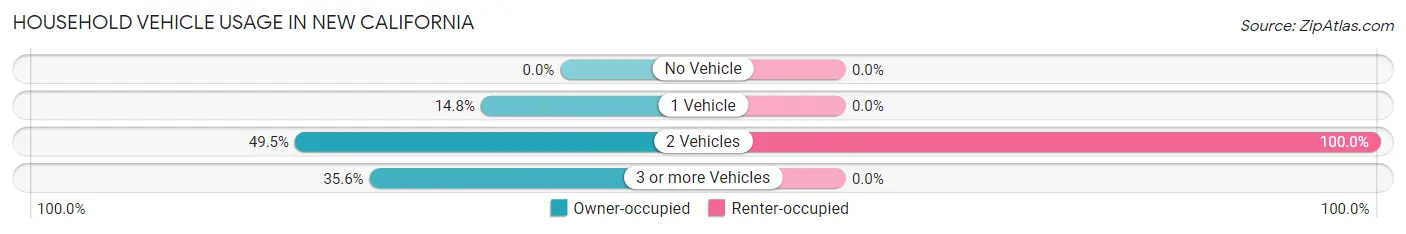
| Vehicles per Household | Owner-occupied | Renter-occupied |
| No Vehicle | 0 (0.0%) | 0 (0.0%) |
| 1 Vehicle | 80 (14.8%) | 0 (0.0%) |
| 2 Vehicles | 267 (49.5%) | 27 (100.0%) |
| 3 or more Vehicles | 192 (35.6%) | 0 (0.0%) |
| Total | 539 (100.0%) | 27 (100.0%) |
Real Estate & Mortgages in New California
Real Estate and Mortgage Overview in New California
| Characteristic | Without Mortgage | With Mortgage |
| Housing Units | 109 | 430 |
| Median Property Value | $434,400 | $417,000 |
| Median Household Income | $163,173 | $266 |
| Monthly Housing Costs | $838 | $36 |
| Real Estate Taxes | $5,339 | $0 |
Property Value by Mortgage Status in New California
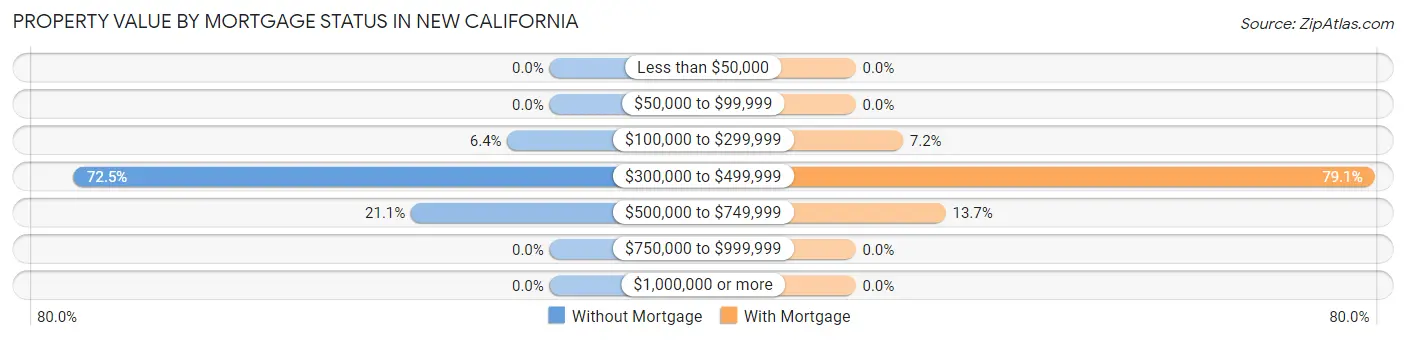
| Property Value | Without Mortgage | With Mortgage |
| Less than $50,000 | 0 (0.0%) | 0 (0.0%) |
| $50,000 to $99,999 | 0 (0.0%) | 0 (0.0%) |
| $100,000 to $299,999 | 7 (6.4%) | 31 (7.2%) |
| $300,000 to $499,999 | 79 (72.5%) | 340 (79.1%) |
| $500,000 to $749,999 | 23 (21.1%) | 59 (13.7%) |
| $750,000 to $999,999 | 0 (0.0%) | 0 (0.0%) |
| $1,000,000 or more | 0 (0.0%) | 0 (0.0%) |
| Total | 109 (100.0%) | 430 (100.0%) |
Household Income by Mortgage Status in New California
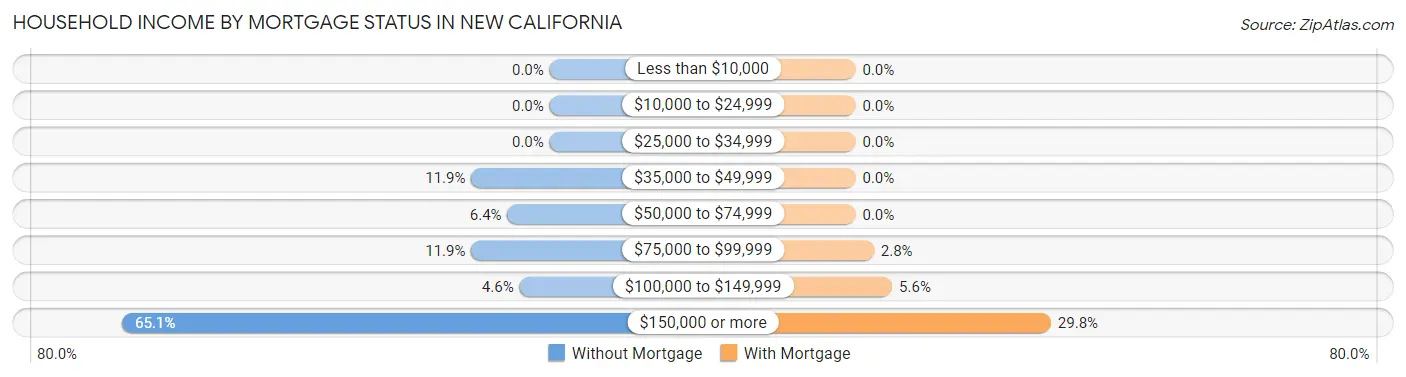
| Household Income | Without Mortgage | With Mortgage |
| Less than $10,000 | 0 (0.0%) | 0 (0.0%) |
| $10,000 to $24,999 | 0 (0.0%) | 0 (0.0%) |
| $25,000 to $34,999 | 0 (0.0%) | 0 (0.0%) |
| $35,000 to $49,999 | 13 (11.9%) | 0 (0.0%) |
| $50,000 to $74,999 | 7 (6.4%) | 0 (0.0%) |
| $75,000 to $99,999 | 13 (11.9%) | 12 (2.8%) |
| $100,000 to $149,999 | 5 (4.6%) | 24 (5.6%) |
| $150,000 or more | 71 (65.1%) | 128 (29.8%) |
| Total | 109 (100.0%) | 430 (100.0%) |
Property Value to Household Income Ratio in New California
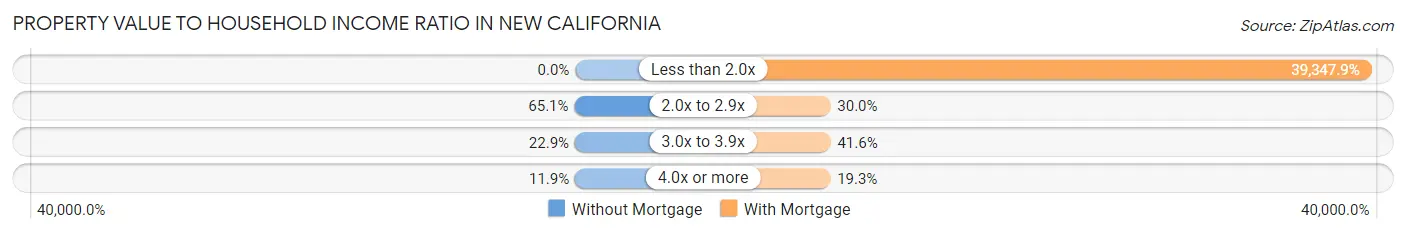
| Value-to-Income Ratio | Without Mortgage | With Mortgage |
| Less than 2.0x | 0 (0.0%) | 169,196 (39,347.9%) |
| 2.0x to 2.9x | 71 (65.1%) | 129 (30.0%) |
| 3.0x to 3.9x | 25 (22.9%) | 179 (41.6%) |
| 4.0x or more | 13 (11.9%) | 83 (19.3%) |
| Total | 109 (100.0%) | 430 (100.0%) |
Real Estate Taxes by Mortgage Status in New California
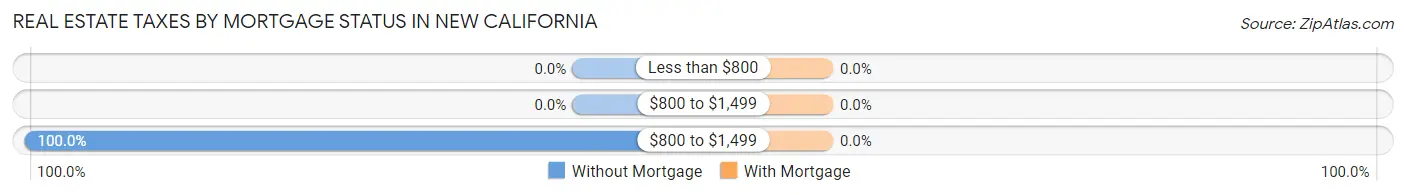
| Property Taxes | Without Mortgage | With Mortgage |
| Less than $800 | 0 (0.0%) | 0 (0.0%) |
| $800 to $1,499 | 0 (0.0%) | 0 (0.0%) |
| $800 to $1,499 | 109 (100.0%) | 0 (0.0%) |
| Total | 109 (100.0%) | 430 (100.0%) |
Health & Disability in New California
Health Insurance Coverage by Age in New California
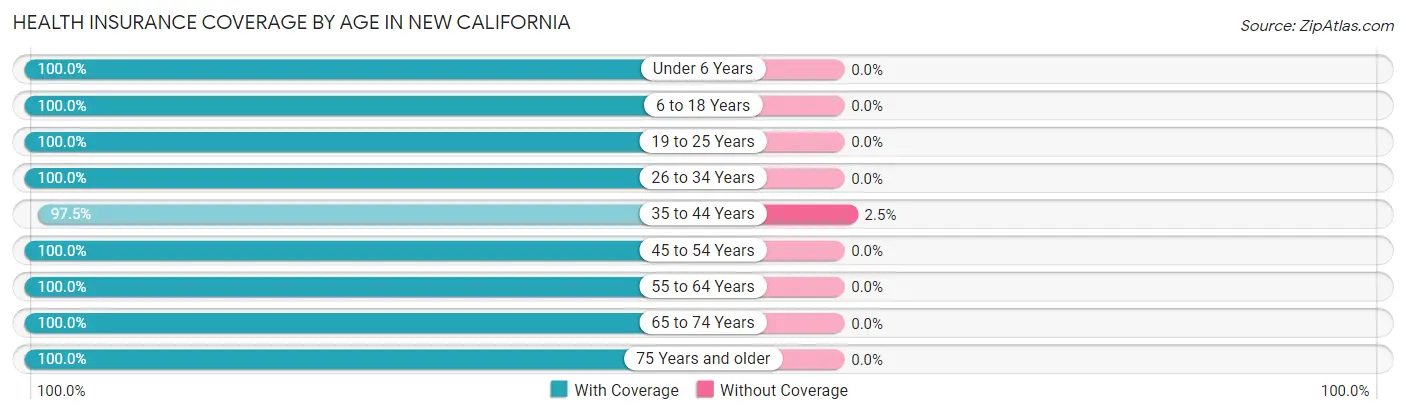
| Age Bracket | With Coverage | Without Coverage |
| Under 6 Years | 135 (100.0%) | 0 (0.0%) |
| 6 to 18 Years | 522 (100.0%) | 0 (0.0%) |
| 19 to 25 Years | 99 (100.0%) | 0 (0.0%) |
| 26 to 34 Years | 93 (100.0%) | 0 (0.0%) |
| 35 to 44 Years | 352 (97.5%) | 9 (2.5%) |
| 45 to 54 Years | 401 (100.0%) | 0 (0.0%) |
| 55 to 64 Years | 151 (100.0%) | 0 (0.0%) |
| 65 to 74 Years | 71 (100.0%) | 0 (0.0%) |
| 75 Years and older | 76 (100.0%) | 0 (0.0%) |
| Total | 1,900 (99.5%) | 9 (0.5%) |
Health Insurance Coverage by Citizenship Status in New California
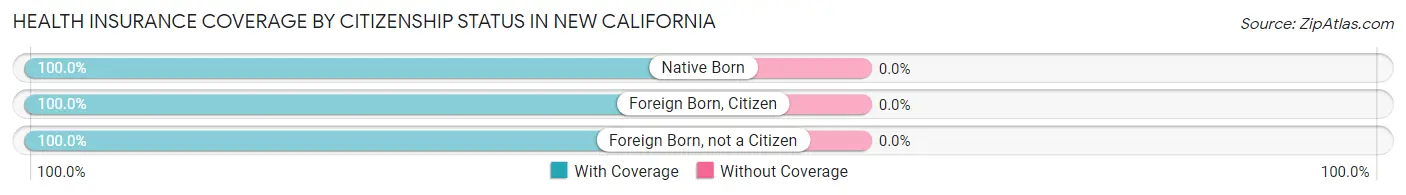
| Citizenship Status | With Coverage | Without Coverage |
| Native Born | 135 (100.0%) | 0 (0.0%) |
| Foreign Born, Citizen | 522 (100.0%) | 0 (0.0%) |
| Foreign Born, not a Citizen | 99 (100.0%) | 0 (0.0%) |
Health Insurance Coverage by Household Income in New California
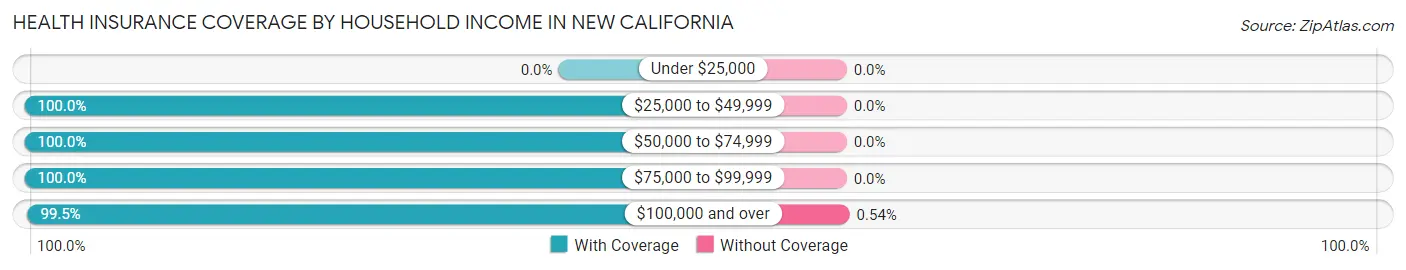
| Household Income | With Coverage | Without Coverage |
| Under $25,000 | 0 (0.0%) | 0 (0.0%) |
| $25,000 to $49,999 | 109 (100.0%) | 0 (0.0%) |
| $50,000 to $74,999 | 40 (100.0%) | 0 (0.0%) |
| $75,000 to $99,999 | 79 (100.0%) | 0 (0.0%) |
| $100,000 and over | 1,672 (99.5%) | 9 (0.5%) |
Public vs Private Health Insurance Coverage by Age in New California
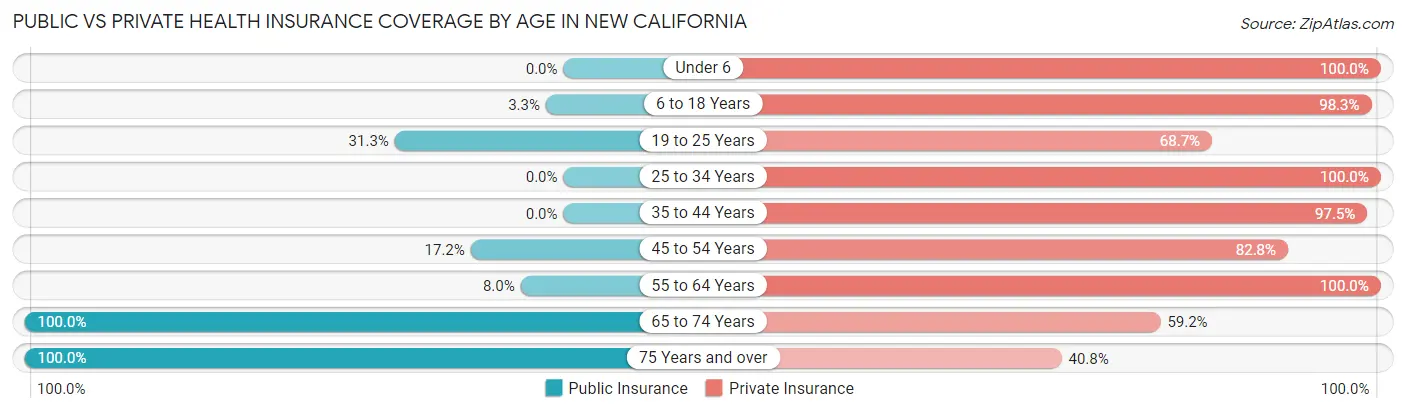
| Age Bracket | Public Insurance | Private Insurance |
| Under 6 | 0 (0.0%) | 135 (100.0%) |
| 6 to 18 Years | 17 (3.3%) | 513 (98.3%) |
| 19 to 25 Years | 31 (31.3%) | 68 (68.7%) |
| 25 to 34 Years | 0 (0.0%) | 93 (100.0%) |
| 35 to 44 Years | 0 (0.0%) | 352 (97.5%) |
| 45 to 54 Years | 69 (17.2%) | 332 (82.8%) |
| 55 to 64 Years | 12 (8.0%) | 151 (100.0%) |
| 65 to 74 Years | 71 (100.0%) | 42 (59.2%) |
| 75 Years and over | 76 (100.0%) | 31 (40.8%) |
| Total | 276 (14.5%) | 1,717 (89.9%) |
Disability Status by Sex by Age in New California
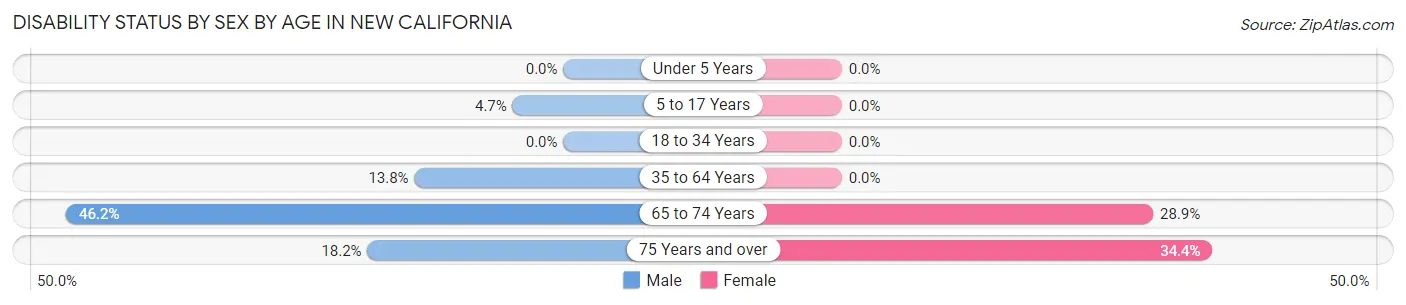
| Age Bracket | Male | Female |
| Under 5 Years | 0 (0.0%) | 0 (0.0%) |
| 5 to 17 Years | 8 (4.7%) | 0 (0.0%) |
| 18 to 34 Years | 0 (0.0%) | 0 (0.0%) |
| 35 to 64 Years | 63 (13.8%) | 0 (0.0%) |
| 65 to 74 Years | 12 (46.2%) | 13 (28.9%) |
| 75 Years and over | 8 (18.2%) | 11 (34.4%) |
Disability Class by Sex by Age in New California
Disability Class: Hearing Difficulty
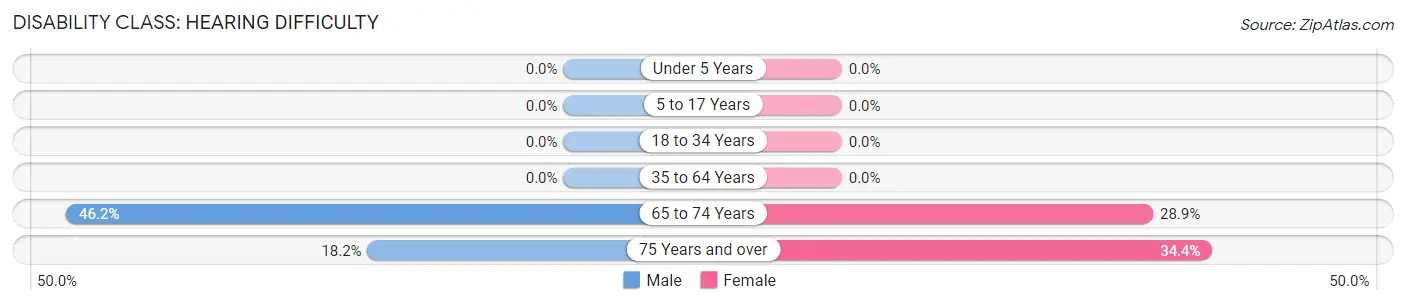
| Age Bracket | Male | Female |
| Under 5 Years | 0 (0.0%) | 0 (0.0%) |
| 5 to 17 Years | 0 (0.0%) | 0 (0.0%) |
| 18 to 34 Years | 0 (0.0%) | 0 (0.0%) |
| 35 to 64 Years | 0 (0.0%) | 0 (0.0%) |
| 65 to 74 Years | 12 (46.2%) | 13 (28.9%) |
| 75 Years and over | 8 (18.2%) | 11 (34.4%) |
Disability Class: Vision Difficulty
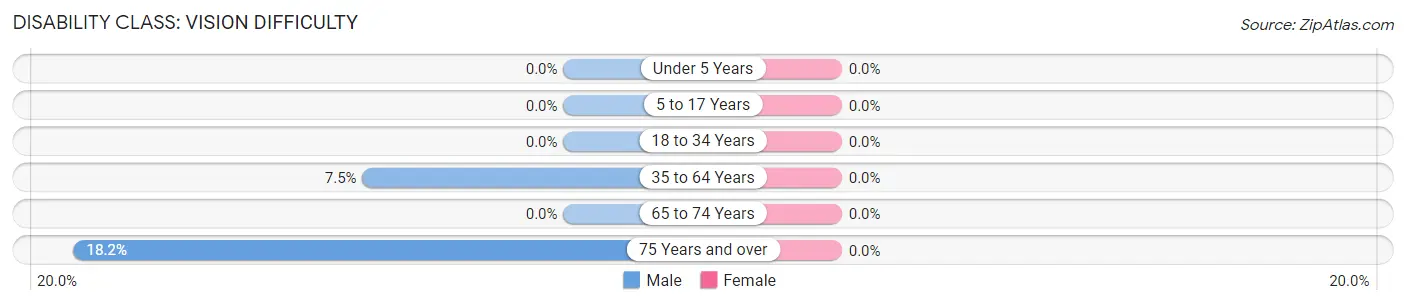
| Age Bracket | Male | Female |
| Under 5 Years | 0 (0.0%) | 0 (0.0%) |
| 5 to 17 Years | 0 (0.0%) | 0 (0.0%) |
| 18 to 34 Years | 0 (0.0%) | 0 (0.0%) |
| 35 to 64 Years | 34 (7.5%) | 0 (0.0%) |
| 65 to 74 Years | 0 (0.0%) | 0 (0.0%) |
| 75 Years and over | 8 (18.2%) | 0 (0.0%) |
Disability Class: Cognitive Difficulty
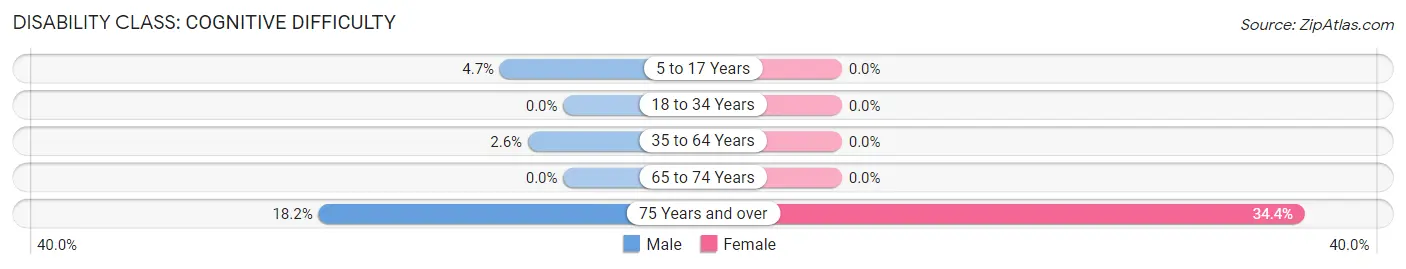
| Age Bracket | Male | Female |
| 5 to 17 Years | 8 (4.7%) | 0 (0.0%) |
| 18 to 34 Years | 0 (0.0%) | 0 (0.0%) |
| 35 to 64 Years | 12 (2.6%) | 0 (0.0%) |
| 65 to 74 Years | 0 (0.0%) | 0 (0.0%) |
| 75 Years and over | 8 (18.2%) | 11 (34.4%) |
Disability Class: Ambulatory Difficulty
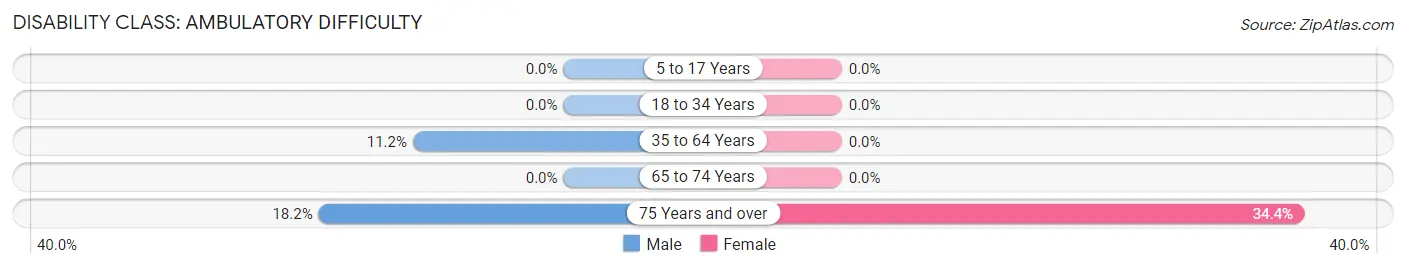
| Age Bracket | Male | Female |
| 5 to 17 Years | 0 (0.0%) | 0 (0.0%) |
| 18 to 34 Years | 0 (0.0%) | 0 (0.0%) |
| 35 to 64 Years | 51 (11.2%) | 0 (0.0%) |
| 65 to 74 Years | 0 (0.0%) | 0 (0.0%) |
| 75 Years and over | 8 (18.2%) | 11 (34.4%) |
Disability Class: Self-Care Difficulty
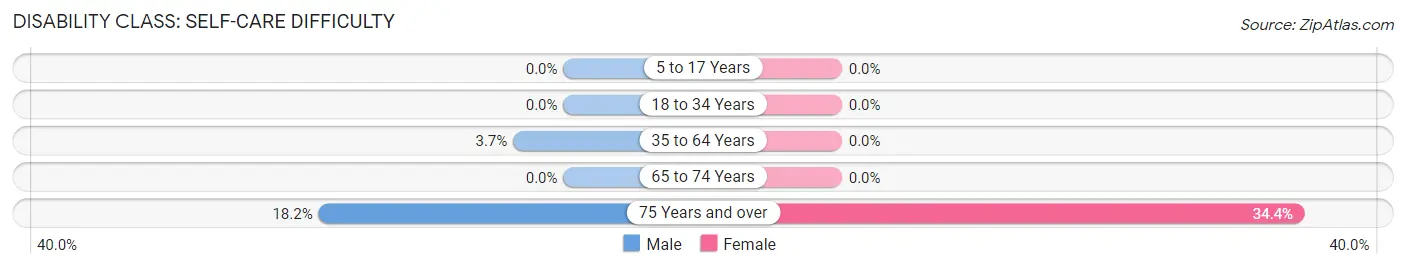
| Age Bracket | Male | Female |
| 5 to 17 Years | 0 (0.0%) | 0 (0.0%) |
| 18 to 34 Years | 0 (0.0%) | 0 (0.0%) |
| 35 to 64 Years | 17 (3.7%) | 0 (0.0%) |
| 65 to 74 Years | 0 (0.0%) | 0 (0.0%) |
| 75 Years and over | 8 (18.2%) | 11 (34.4%) |
Technology Access in New California
Computing Device Access in New California
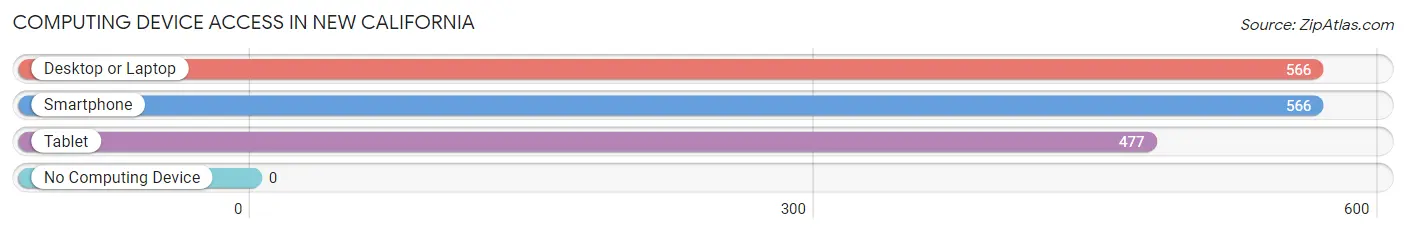
| Device Type | # Households | % Households |
| Desktop or Laptop | 566 | 100.0% |
| Smartphone | 566 | 100.0% |
| Tablet | 477 | 84.3% |
| No Computing Device | 0 | 0.0% |
| Total | 566 | 100.0% |
Internet Access in New California
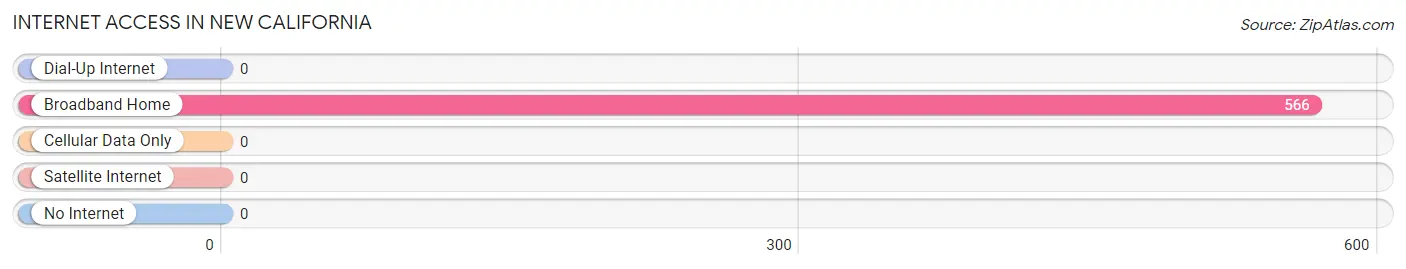
| Internet Type | # Households | % Households |
| Dial-Up Internet | 0 | 0.0% |
| Broadband Home | 566 | 100.0% |
| Cellular Data Only | 0 | 0.0% |
| Satellite Internet | 0 | 0.0% |
| No Internet | 0 | 0.0% |
| Total | 566 | 100.0% |
New California Summary
New California is a small village located in the southeastern corner of Ohio, in the county of Monroe. It is situated on the banks of the Ohio River, and is bordered by the towns of Clarington and Beallsville. The village has a population of approximately 500 people, and is part of the Ohio Valley region.
History
New California was founded in 1817 by a group of settlers from Pennsylvania. The settlers were looking for a place to settle and start a new life, and they chose the area around the Ohio River. The village was originally called “New California” because of its resemblance to the state of California. The settlers built a small log cabin and began to farm the land.
The village grew slowly over the years, and by the mid-1800s, it had become a thriving community. The village was home to a variety of businesses, including a general store, a blacksmith, a sawmill, and a gristmill. The village also had a post office, a school, and a church.
In the late 1800s, the village began to decline. The population decreased, and many of the businesses closed. The village was eventually abandoned in the early 1900s.
Geography
New California is located in the southeastern corner of Ohio, in the county of Monroe. It is situated on the banks of the Ohio River, and is bordered by the towns of Clarington and Beallsville. The village is located in a rural area, and is surrounded by rolling hills and farmland.
The village is located in the Appalachian Plateau region of Ohio, and is part of the Appalachian Mountains. The climate in the area is humid continental, with hot summers and cold winters. The average annual temperature is around 50 degrees Fahrenheit.
Economy
The economy of New California is largely based on agriculture. The village is home to several farms, which produce a variety of crops, including corn, soybeans, wheat, and hay. The village also has a few small businesses, including a general store, a gas station, and a restaurant.
The village is also home to a few small manufacturing companies, which produce a variety of products, including furniture, clothing, and tools. The village also has a few small service businesses, such as a barber shop and a beauty salon.
Demographics
As of the 2010 census, the population of New California was 498 people. The racial makeup of the village was 97.6% White, 0.2% African American, 0.2% Native American, 0.2% Asian, and 1.8% from other races. The median household income was $37,500, and the median family income was $41,250.
The village is home to a variety of religious denominations, including Baptist, Methodist, and Catholic. The village also has a few small churches, including the New California United Methodist Church and the New California Baptist Church.
Conclusion
New California is a small village located in the southeastern corner of Ohio, in the county of Monroe. It is situated on the banks of the Ohio River, and is bordered by the towns of Clarington and Beallsville. The village has a population of approximately 500 people, and is part of the Ohio Valley region. The economy of the village is largely based on agriculture, and the village is home to a variety of religious denominations. The village is also home to a few small businesses, and is surrounded by rolling hills and farmland.
Common Questions
What is the Total Population of New California?
Total Population of New California is 1,909.
What is the Total Male Population of New California?
Total Male Population of New California is 915.
What is the Total Female Population of New California?
Total Female Population of New California is 994.
What is the Ratio of Males per 100 Females in New California?
There are 92.05 Males per 100 Females in New California.
What is the Ratio of Females per 100 Males in New California?
There are 108.63 Females per 100 Males in New California.
What is the Median Population Age in New California?
Median Population Age in New California is 39.7 Years.
What is the Average Family Size in New California
Average Family Size in New California is 3.6 People.
What is the Average Household Size in New California
Average Household Size in New California is 3.4 People.
What is Per Capita Income in New California?
Per Capita income in New California is $59,381.
What is the Median Family Income in New California?
Median Family Income in New California is $180,855.
What is the Median Household income in New California?
Median Household Income in New California is $167,946.
What is Income or Wage Gap in New California?
Income or Wage Gap in New California is 49.1%.
Women in New California earn 50.9 cents for every dollar earned by a man.
What is Inequality or Gini Index in New California?
Inequality or Gini Index in New California is 0.29.
How Large is the Labor Force in New California?
There are 996 People in the Labor Forcein in New California.
What is the Percentage of People in the Labor Force in New California?
77.6% of People are in the Labor Force in New California.
What is the Unemployment Rate in New California?
Unemployment Rate in New California is 1.6%.