Cities with the Lowest Poverty Level in Kansas
RELATED REPORTS & OPTIONS
Lowest Poverty
Kansas
Compare Cities
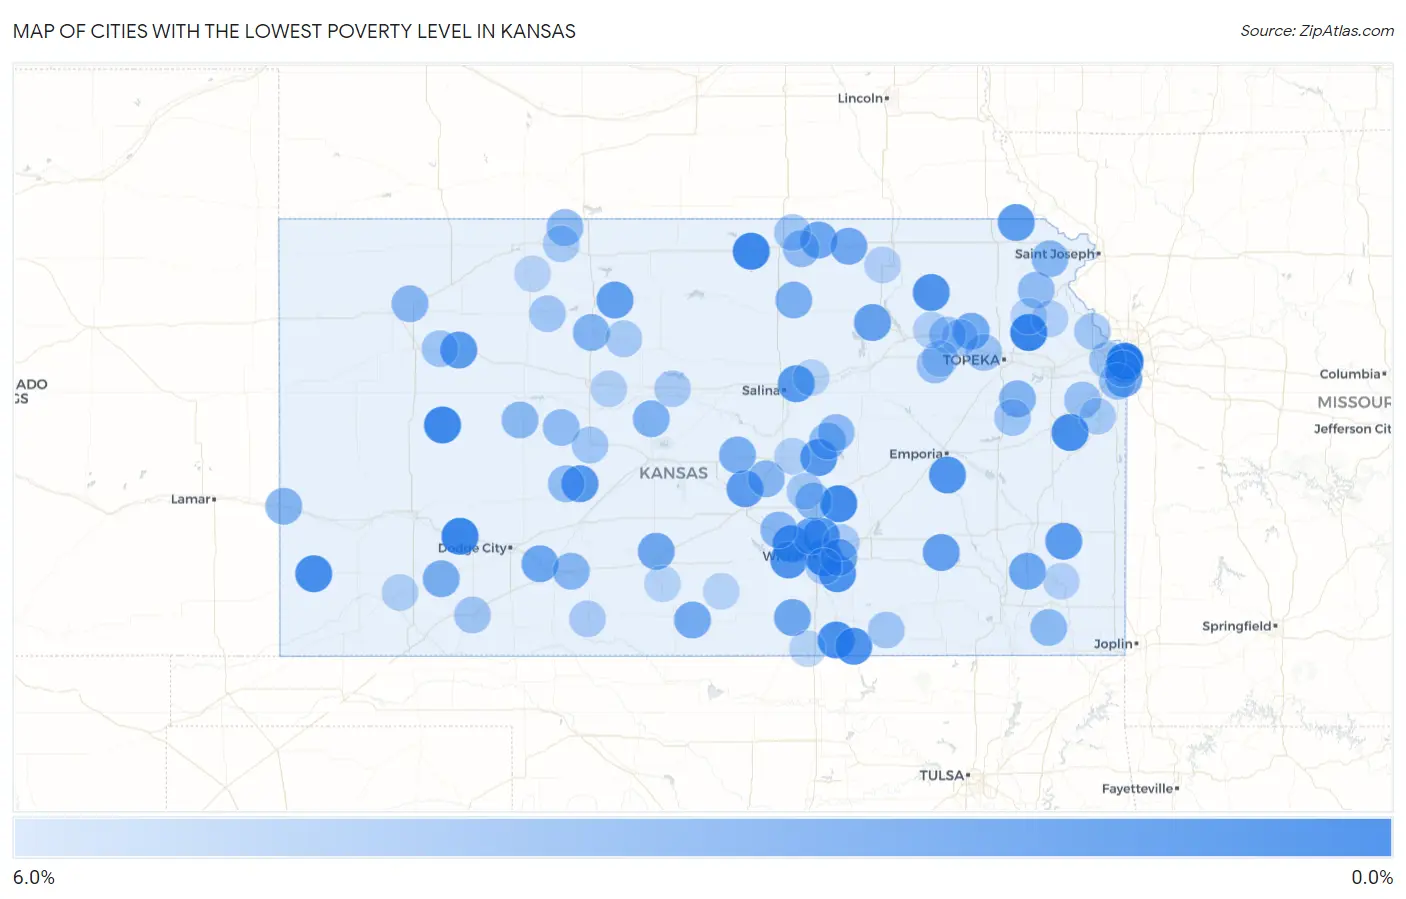
Map of Cities with the Lowest Poverty Level in Kansas
6.0%
0.0%
Cities with the Lowest Poverty Level in Kansas
| City | Poverty | vs State | vs National | |
| 1. | Ozawkie | 0.30% | 11.6%(-11.3)#1 | 12.5%(-12.2)#49 |
| 2. | Ingalls | 0.36% | 11.6%(-11.2)#2 | 12.5%(-12.2)#71 |
| 3. | Eastborough | 0.42% | 11.6%(-11.2)#3 | 12.5%(-12.1)#92 |
| 4. | Courtland | 0.49% | 11.6%(-11.1)#4 | 12.5%(-12.0)#120 |
| 5. | Healy | 0.54% | 11.6%(-11.0)#5 | 12.5%(-12.0)#131 |
| 6. | Elbing | 0.74% | 11.6%(-10.8)#6 | 12.5%(-11.8)#226 |
| 7. | Mission Hills | 0.81% | 11.6%(-10.8)#7 | 12.5%(-11.7)#266 |
| 8. | Johnson City | 0.85% | 11.6%(-10.7)#8 | 12.5%(-11.7)#288 |
| 9. | Rantoul | 0.93% | 11.6%(-10.7)#9 | 12.5%(-11.6)#319 |
| 10. | Geuda Springs | 0.99% | 11.6%(-10.6)#10 | 12.5%(-11.5)#354 |
| 11. | Colwich | 1.00% | 11.6%(-10.6)#11 | 12.5%(-11.5)#360 |
| 12. | Rose Hill | 1.1% | 11.6%(-10.5)#12 | 12.5%(-11.4)#422 |
| 13. | Goddard | 1.2% | 11.6%(-10.4)#13 | 12.5%(-11.3)#504 |
| 14. | Parkerfield | 1.2% | 11.6%(-10.3)#14 | 12.5%(-11.3)#514 |
| 15. | Wheaton | 1.3% | 11.6%(-10.3)#15 | 12.5%(-11.3)#529 |
| 16. | Olpe | 1.3% | 11.6%(-10.3)#16 | 12.5%(-11.3)#546 |
| 17. | Westwood Hills | 1.4% | 11.6%(-10.2)#17 | 12.5%(-11.2)#592 |
| 18. | Kechi | 1.4% | 11.6%(-10.2)#18 | 12.5%(-11.2)#596 |
| 19. | Lehigh | 1.5% | 11.6%(-10.1)#19 | 12.5%(-11.0)#730 |
| 20. | Rozel | 1.6% | 11.6%(-9.99)#20 | 12.5%(-10.9)#778 |
| 21. | Grainfield | 1.6% | 11.6%(-9.94)#21 | 12.5%(-10.9)#822 |
| 22. | New Cambria | 1.6% | 11.6%(-9.94)#22 | 12.5%(-10.9)#824 |
| 23. | Elsmore | 1.7% | 11.6%(-9.89)#23 | 12.5%(-10.8)#869 |
| 24. | Reserve | 1.7% | 11.6%(-9.86)#24 | 12.5%(-10.8)#895 |
| 25. | The Highlands | 1.7% | 11.6%(-9.84)#25 | 12.5%(-10.8)#914 |
| 26. | Woodston | 2.0% | 11.6%(-9.62)#26 | 12.5%(-10.6)#1,100 |
| 27. | Climax | 2.1% | 11.6%(-9.50)#27 | 12.5%(-10.5)#1,235 |
| 28. | Riley | 2.2% | 11.6%(-9.41)#28 | 12.5%(-10.4)#1,309 |
| 29. | Valley Center | 2.3% | 11.6%(-9.24)#29 | 12.5%(-10.2)#1,494 |
| 30. | Leawood | 2.3% | 11.6%(-9.23)#30 | 12.5%(-10.2)#1,500 |
| 31. | Earlton | 2.4% | 11.6%(-9.16)#31 | 12.5%(-10.1)#1,584 |
| 32. | Ford | 2.4% | 11.6%(-9.14)#32 | 12.5%(-10.1)#1,606 |
| 33. | Haddam | 2.4% | 11.6%(-9.14)#33 | 12.5%(-10.1)#1,608 |
| 34. | Andover | 2.5% | 11.6%(-9.08)#34 | 12.5%(-10.0)#1,671 |
| 35. | Mayfield | 2.5% | 11.6%(-9.08)#35 | 12.5%(-10.0)#1,674 |
| 36. | Iuka | 2.5% | 11.6%(-9.06)#36 | 12.5%(-10.0)#1,708 |
| 37. | Washington | 2.5% | 11.6%(-9.04)#37 | 12.5%(-9.99)#1,721 |
| 38. | Delia | 2.7% | 11.6%(-8.87)#38 | 12.5%(-9.82)#1,912 |
| 39. | Sharon | 2.7% | 11.6%(-8.85)#39 | 12.5%(-9.81)#1,924 |
| 40. | Copeland | 2.9% | 11.6%(-8.71)#40 | 12.5%(-9.66)#2,106 |
| 41. | Little River | 3.0% | 11.6%(-8.56)#41 | 12.5%(-9.51)#2,257 |
| 42. | Aurora | 3.0% | 11.6%(-8.55)#42 | 12.5%(-9.50)#2,268 |
| 43. | Susank | 3.1% | 11.6%(-8.46)#43 | 12.5%(-9.41)#2,382 |
| 44. | Plainville | 3.3% | 11.6%(-8.25)#44 | 12.5%(-9.20)#2,667 |
| 45. | Westwood | 3.4% | 11.6%(-8.23)#45 | 12.5%(-9.18)#2,689 |
| 46. | Overbrook | 3.4% | 11.6%(-8.19)#46 | 12.5%(-9.15)#2,740 |
| 47. | Coolidge | 3.4% | 11.6%(-8.17)#47 | 12.5%(-9.13)#2,764 |
| 48. | Mullinville | 3.5% | 11.6%(-8.12)#48 | 12.5%(-9.07)#2,836 |
| 49. | Mount Hope | 3.5% | 11.6%(-8.11)#49 | 12.5%(-9.06)#2,851 |
| 50. | Inman | 3.5% | 11.6%(-8.06)#50 | 12.5%(-9.01)#2,928 |
| 51. | Gem | 3.5% | 11.6%(-8.04)#51 | 12.5%(-8.99)#2,958 |
| 52. | Denton | 3.6% | 11.6%(-8.01)#52 | 12.5%(-8.96)#3,008 |
| 53. | North Newton | 3.6% | 11.6%(-7.98)#53 | 12.5%(-8.93)#3,062 |
| 54. | Ransom | 3.6% | 11.6%(-7.95)#54 | 12.5%(-8.91)#3,089 |
| 55. | Durham | 3.6% | 11.6%(-7.94)#55 | 12.5%(-8.90)#3,099 |
| 56. | Altamont | 3.7% | 11.6%(-7.87)#56 | 12.5%(-8.82)#3,206 |
| 57. | Long Island | 3.7% | 11.6%(-7.85)#57 | 12.5%(-8.80)#3,236 |
| 58. | Cuba | 3.8% | 11.6%(-7.79)#58 | 12.5%(-8.74)#3,297 |
| 59. | Tampa | 3.8% | 11.6%(-7.76)#59 | 12.5%(-8.72)#3,341 |
| 60. | Burdett | 3.9% | 11.6%(-7.69)#60 | 12.5%(-8.65)#3,426 |
| 61. | Effingham | 3.9% | 11.6%(-7.64)#61 | 12.5%(-8.59)#3,494 |
| 62. | Mccracken | 4.0% | 11.6%(-7.62)#62 | 12.5%(-8.57)#3,525 |
| 63. | Alma | 4.1% | 11.6%(-7.50)#63 | 12.5%(-8.45)#3,709 |
| 64. | Edgerton | 4.2% | 11.6%(-7.36)#64 | 12.5%(-8.31)#3,878 |
| 65. | Lake Quivira | 4.2% | 11.6%(-7.36)#65 | 12.5%(-8.31)#3,881 |
| 66. | Overland Park | 4.2% | 11.6%(-7.33)#66 | 12.5%(-8.29)#3,922 |
| 67. | Belvue | 4.3% | 11.6%(-7.30)#67 | 12.5%(-8.26)#3,951 |
| 68. | Silver Lake | 4.3% | 11.6%(-7.29)#68 | 12.5%(-8.25)#3,970 |
| 69. | Vassar | 4.3% | 11.6%(-7.23)#69 | 12.5%(-8.19)#4,037 |
| 70. | Grinnell | 4.4% | 11.6%(-7.21)#70 | 12.5%(-8.16)#4,087 |
| 71. | Meade | 4.4% | 11.6%(-7.16)#71 | 12.5%(-8.11)#4,157 |
| 72. | Rush Center | 4.5% | 11.6%(-7.10)#72 | 12.5%(-8.05)#4,256 |
| 73. | Munden | 4.5% | 11.6%(-7.07)#73 | 12.5%(-8.02)#4,285 |
| 74. | Dexter | 4.5% | 11.6%(-7.06)#74 | 12.5%(-8.01)#4,303 |
| 75. | Bogue | 4.5% | 11.6%(-7.04)#75 | 12.5%(-7.99)#4,337 |
| 76. | Hesston | 4.6% | 11.6%(-6.99)#76 | 12.5%(-7.94)#4,392 |
| 77. | Lansing | 4.6% | 11.6%(-6.96)#77 | 12.5%(-7.91)#4,448 |
| 78. | St Marys | 4.7% | 11.6%(-6.89)#78 | 12.5%(-7.85)#4,532 |
| 79. | Hillsdale | 4.7% | 11.6%(-6.84)#79 | 12.5%(-7.80)#4,597 |
| 80. | Natoma | 4.8% | 11.6%(-6.83)#80 | 12.5%(-7.78)#4,615 |
| 81. | Prairie View | 4.8% | 11.6%(-6.79)#81 | 12.5%(-7.74)#4,678 |
| 82. | Coldwater | 4.8% | 11.6%(-6.76)#82 | 12.5%(-7.72)#4,710 |
| 83. | Benton | 4.8% | 11.6%(-6.74)#83 | 12.5%(-7.69)#4,752 |
| 84. | Prairie Village | 4.8% | 11.6%(-6.73)#84 | 12.5%(-7.68)#4,761 |
| 85. | Mcconnell Afb | 4.9% | 11.6%(-6.72)#85 | 12.5%(-7.68)#4,778 |
| 86. | Dorrance | 4.9% | 11.6%(-6.70)#86 | 12.5%(-7.66)#4,802 |
| 87. | Mcfarland | 5.0% | 11.6%(-6.62)#87 | 12.5%(-7.58)#4,897 |
| 88. | Satanta | 5.1% | 11.6%(-6.53)#88 | 12.5%(-7.48)#5,036 |
| 89. | Louisville | 5.1% | 11.6%(-6.48)#89 | 12.5%(-7.43)#5,095 |
| 90. | Winchester | 5.1% | 11.6%(-6.47)#90 | 12.5%(-7.42)#5,110 |
| 91. | Galva | 5.1% | 11.6%(-6.45)#91 | 12.5%(-7.40)#5,140 |
| 92. | Victoria | 5.1% | 11.6%(-6.44)#92 | 12.5%(-7.40)#5,147 |
| 93. | Valley Falls | 5.2% | 11.6%(-6.41)#93 | 12.5%(-7.37)#5,183 |
| 94. | Waterville | 5.2% | 11.6%(-6.41)#94 | 12.5%(-7.36)#5,184 |
| 95. | St Paul | 5.2% | 11.6%(-6.41)#95 | 12.5%(-7.36)#5,192 |
| 96. | Sawyer | 5.3% | 11.6%(-6.32)#96 | 12.5%(-7.27)#5,312 |
| 97. | Solomon | 5.3% | 11.6%(-6.30)#97 | 12.5%(-7.26)#5,329 |
| 98. | South Haven | 5.3% | 11.6%(-6.29)#98 | 12.5%(-7.24)#5,358 |
| 99. | Spivey | 5.3% | 11.6%(-6.28)#99 | 12.5%(-7.23)#5,369 |
| 100. | Edmond | 5.4% | 11.6%(-6.22)#100 | 12.5%(-7.18)#5,453 |
Common Questions
What are the Top 10 Cities with the Lowest Poverty Level in Kansas?
Top 10 Cities with the Lowest Poverty Level in Kansas are:
#1
0.30%
#2
0.36%
#3
0.42%
#4
0.49%
#5
0.54%
#6
0.74%
#7
0.81%
#8
0.85%
#9
0.93%
#10
0.99%
What city has the Lowest Poverty Level in Kansas?
Ozawkie has the Lowest Poverty Level in Kansas with 0.30%.
What is the Poverty Level in the State of Kansas?
Poverty Level in Kansas is 11.6%.
What is the Poverty Level in the United States?
Poverty Level in the United States is 12.5%.