Mariemont, OH
Mariemont Map
Mariemont Overview
3,493
TOTAL POPULATION
1,745
MALE POPULATION
1,748
FEMALE POPULATION
99.83
MALES / 100 FEMALES
100.17
FEMALES / 100 MALES
37.8
MEDIAN AGE
3.2
AVG FAMILY SIZE
2.4
AVG HOUSEHOLD SIZE
$77,053
PER CAPITA INCOME
$198,712
AVG FAMILY INCOME
$135,326
AVG HOUSEHOLD INCOME
29.0%
WAGE / INCOME GAP [ % ]
71.0¢/ $1
WAGE / INCOME GAP [ $ ]
0.47
INEQUALITY / GINI INDEX
1,812
LABOR FORCE [ PEOPLE ]
67.1%
PERCENT IN LABOR FORCE
1.6%
UNEMPLOYMENT RATE
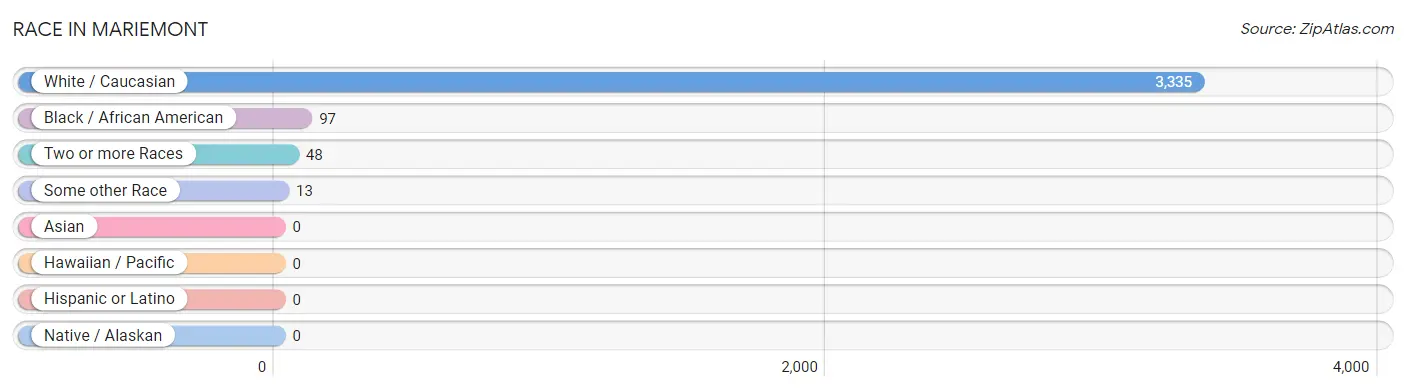
Race in Mariemont
The most populous races in Mariemont are White / Caucasian (3,335 | 95.5%), Black / African American (97 | 2.8%), and Two or more Races (48 | 1.4%).
| Race | # Population | % Population |
| Asian | 0 | 0.0% |
| Black / African American | 97 | 2.8% |
| Hawaiian / Pacific | 0 | 0.0% |
| Hispanic or Latino | 0 | 0.0% |
| Native / Alaskan | 0 | 0.0% |
| White / Caucasian | 3,335 | 95.5% |
| Two or more Races | 48 | 1.4% |
| Some other Race | 13 | 0.4% |
| Total | 3,493 | 100.0% |
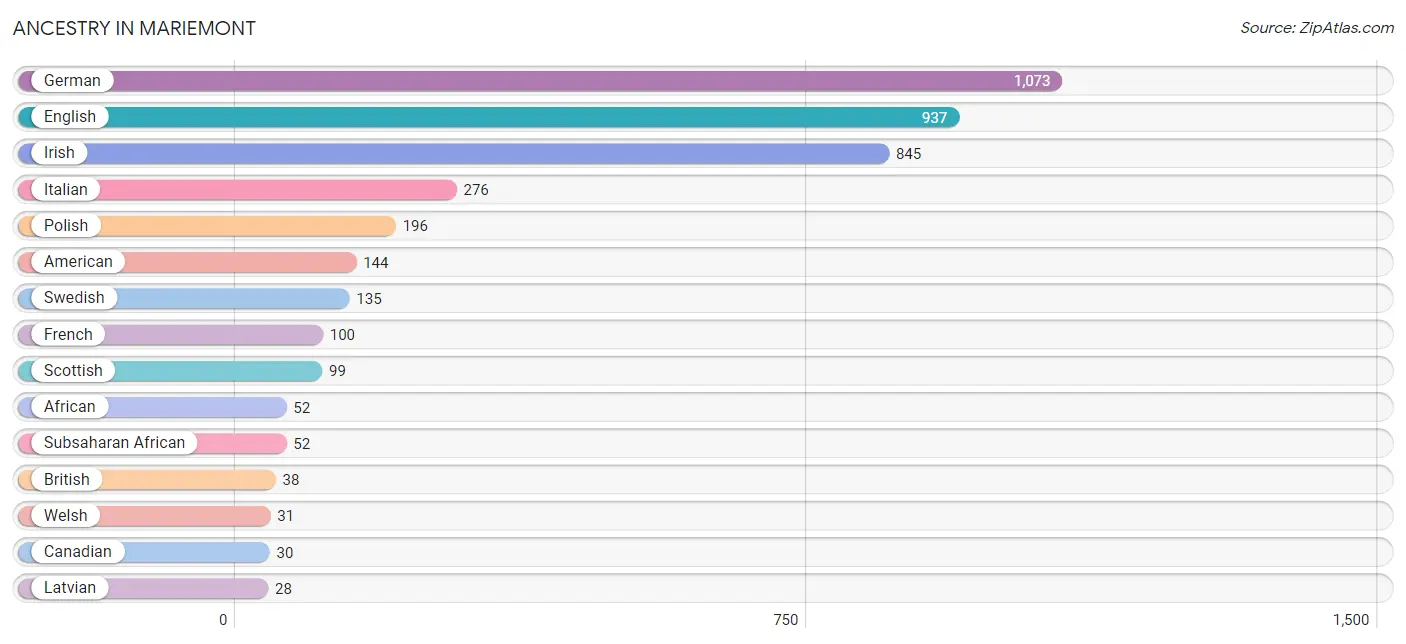
Ancestry in Mariemont
The most populous ancestries reported in Mariemont are German (1,073 | 30.7%), English (937 | 26.8%), Irish (845 | 24.2%), Italian (276 | 7.9%), and Polish (196 | 5.6%), together accounting for 95.2% of all Mariemont residents.
| Ancestry | # Population | % Population |
| African | 52 | 1.5% |
| American | 144 | 4.1% |
| Australian | 6 | 0.2% |
| British | 38 | 1.1% |
| Canadian | 30 | 0.9% |
| Croatian | 13 | 0.4% |
| Danish | 11 | 0.3% |
| Dutch | 27 | 0.8% |
| English | 937 | 26.8% |
| European | 16 | 0.5% |
| Finnish | 8 | 0.2% |
| French | 100 | 2.9% |
| German | 1,073 | 30.7% |
| Irish | 845 | 24.2% |
| Italian | 276 | 7.9% |
| Latvian | 28 | 0.8% |
| Norwegian | 18 | 0.5% |
| Polish | 196 | 5.6% |
| Scandinavian | 9 | 0.3% |
| Scotch-Irish | 14 | 0.4% |
| Scottish | 99 | 2.8% |
| Slovak | 21 | 0.6% |
| Subsaharan African | 52 | 1.5% |
| Swedish | 135 | 3.9% |
| Swiss | 9 | 0.3% |
| Welsh | 31 | 0.9% | View All 26 Rows |
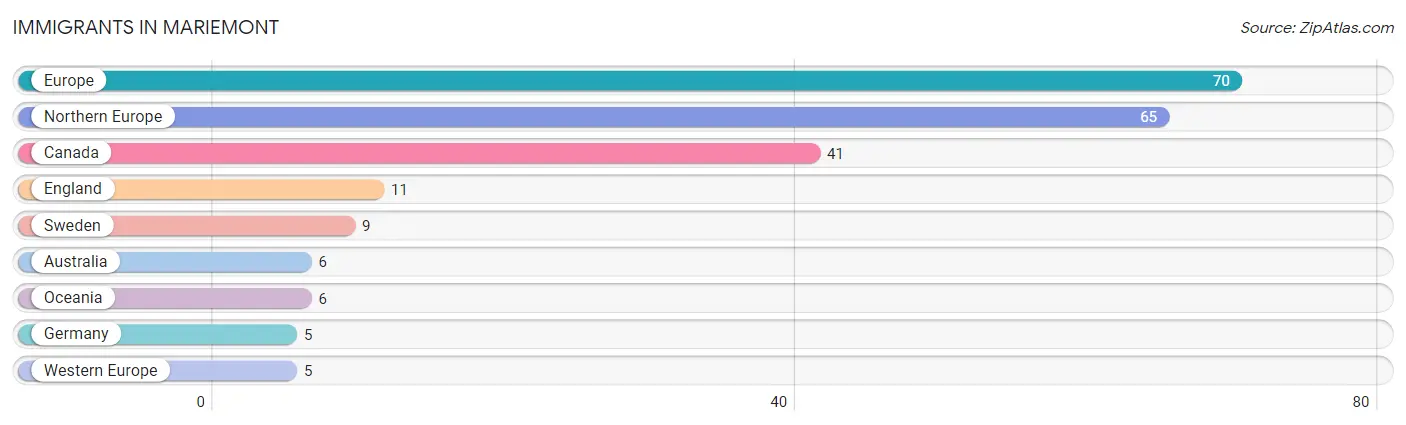
Immigrants in Mariemont
The most numerous immigrant groups reported in Mariemont came from Europe (70 | 2.0%), Northern Europe (65 | 1.9%), Canada (41 | 1.2%), England (11 | 0.3%), and Sweden (9 | 0.3%), together accounting for 5.6% of all Mariemont residents.
| Immigration Origin | # Population | % Population |
| Australia | 6 | 0.2% |
| Canada | 41 | 1.2% |
| England | 11 | 0.3% |
| Europe | 70 | 2.0% |
| Germany | 5 | 0.1% |
| Northern Europe | 65 | 1.9% |
| Oceania | 6 | 0.2% |
| Sweden | 9 | 0.3% |
| Western Europe | 5 | 0.1% | View All 9 Rows |
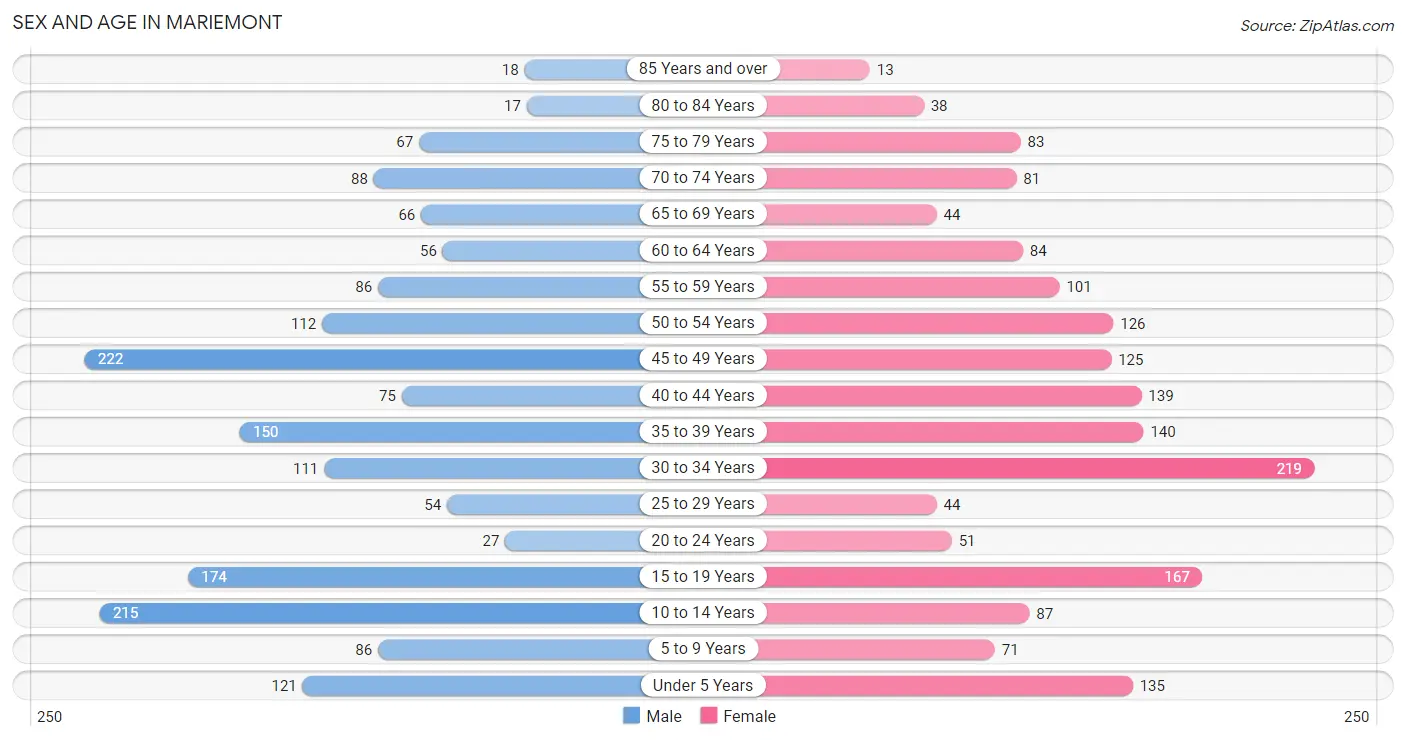
Sex and Age in Mariemont
Sex and Age in Mariemont
The most populous age groups in Mariemont are 45 to 49 Years (222 | 12.7%) for men and 30 to 34 Years (219 | 12.5%) for women.
| Age Bracket | Male | Female |
| Under 5 Years | 121 (6.9%) | 135 (7.7%) |
| 5 to 9 Years | 86 (4.9%) | 71 (4.1%) |
| 10 to 14 Years | 215 (12.3%) | 87 (5.0%) |
| 15 to 19 Years | 174 (10.0%) | 167 (9.6%) |
| 20 to 24 Years | 27 (1.5%) | 51 (2.9%) |
| 25 to 29 Years | 54 (3.1%) | 44 (2.5%) |
| 30 to 34 Years | 111 (6.4%) | 219 (12.5%) |
| 35 to 39 Years | 150 (8.6%) | 140 (8.0%) |
| 40 to 44 Years | 75 (4.3%) | 139 (8.0%) |
| 45 to 49 Years | 222 (12.7%) | 125 (7.1%) |
| 50 to 54 Years | 112 (6.4%) | 126 (7.2%) |
| 55 to 59 Years | 86 (4.9%) | 101 (5.8%) |
| 60 to 64 Years | 56 (3.2%) | 84 (4.8%) |
| 65 to 69 Years | 66 (3.8%) | 44 (2.5%) |
| 70 to 74 Years | 88 (5.0%) | 81 (4.6%) |
| 75 to 79 Years | 67 (3.8%) | 83 (4.8%) |
| 80 to 84 Years | 17 (1.0%) | 38 (2.2%) |
| 85 Years and over | 18 (1.0%) | 13 (0.7%) |
| Total | 1,745 (100.0%) | 1,748 (100.0%) |
Families and Households in Mariemont
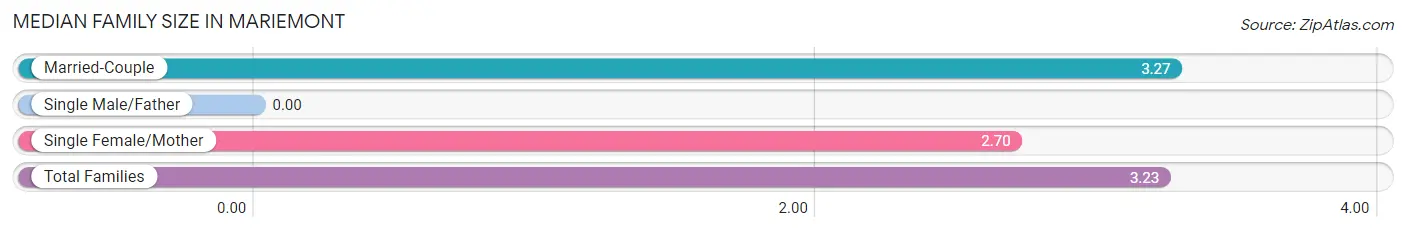
Median Family Size in Mariemont
| Family Type | # Families | Family Size |
| Married-Couple | 821 (93.9%) | 3.27 |
| Single Male/Father | 0 (0.0%) | - |
| Single Female/Mother | 53 (6.1%) | 2.70 |
| Total Families | 874 (100.0%) | 3.23 |
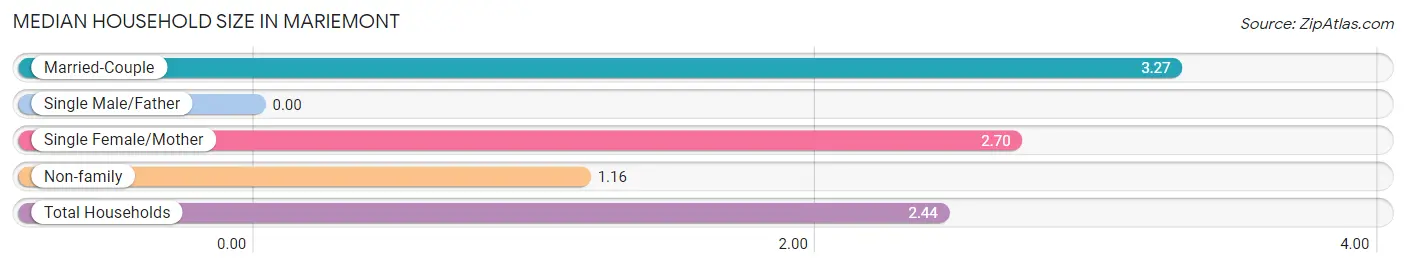
Median Household Size in Mariemont
| Household Type | # Households | Household Size |
| Married-Couple | 821 (58.2%) | 3.27 |
| Single Male/Father | 0 (0.0%) | - |
| Single Female/Mother | 53 (3.8%) | 2.70 |
| Non-family | 536 (38.0%) | 1.16 |
| Total Households | 1,410 (100.0%) | 2.44 |
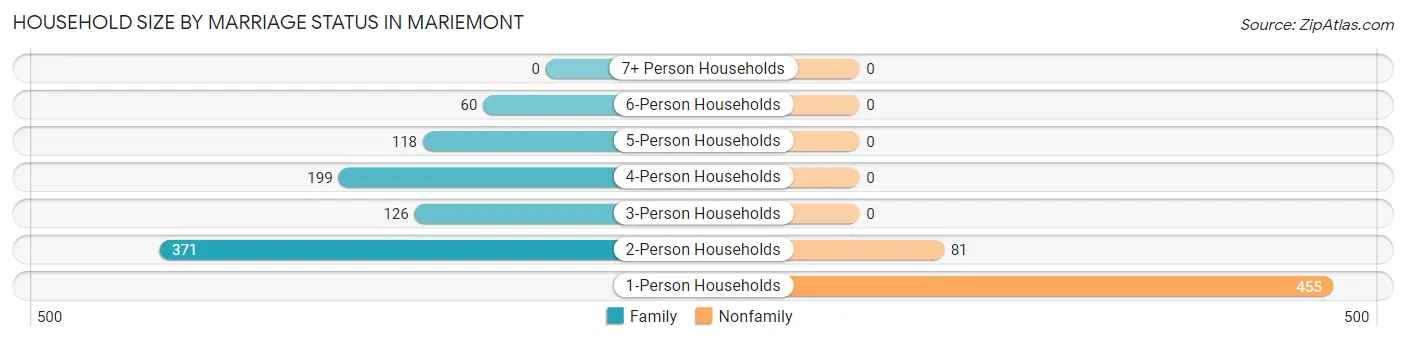
Household Size by Marriage Status in Mariemont
Out of a total of 1,410 households in Mariemont, 874 (62.0%) are family households, while 536 (38.0%) are nonfamily households. The most numerous type of family households are 2-person households, comprising 371, and the most common type of nonfamily households are 1-person households, comprising 455.
| Household Size | Family Households | Nonfamily Households |
| 1-Person Households | - | 455 (32.3%) |
| 2-Person Households | 371 (26.3%) | 81 (5.7%) |
| 3-Person Households | 126 (8.9%) | 0 (0.0%) |
| 4-Person Households | 199 (14.1%) | 0 (0.0%) |
| 5-Person Households | 118 (8.4%) | 0 (0.0%) |
| 6-Person Households | 60 (4.3%) | 0 (0.0%) |
| 7+ Person Households | 0 (0.0%) | 0 (0.0%) |
| Total | 874 (62.0%) | 536 (38.0%) |
Female Fertility in Mariemont
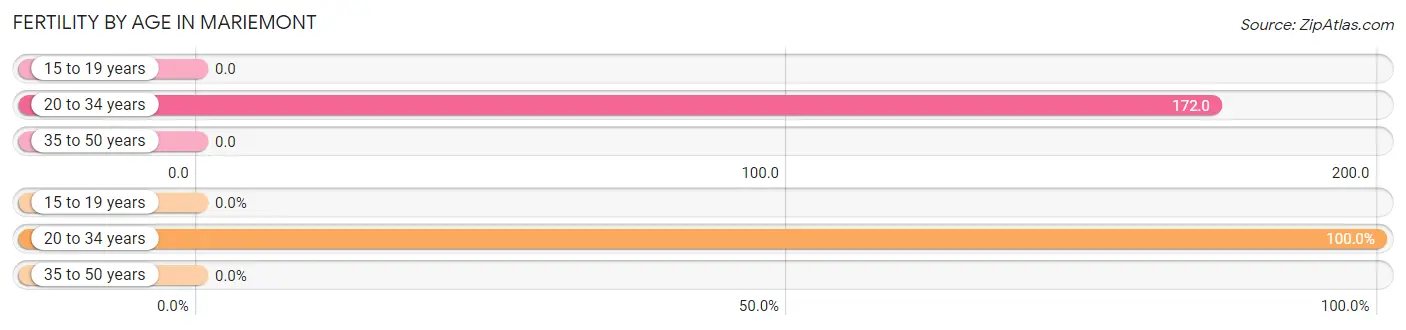
Fertility by Age in Mariemont
Average fertility rate in Mariemont is 59.0 births per 1,000 women. Women in the age bracket of 20 to 34 years have the highest fertility rate with 172.0 births per 1,000 women. Women in the age bracket of 20 to 34 years acount for 100.0% of all women with births.
| Age Bracket | Women with Births | Births / 1,000 Women |
| 15 to 19 years | 0 (0.0%) | 0.0 |
| 20 to 34 years | 54 (100.0%) | 172.0 |
| 35 to 50 years | 0 (0.0%) | 0.0 |
| Total | 54 (100.0%) | 59.0 |
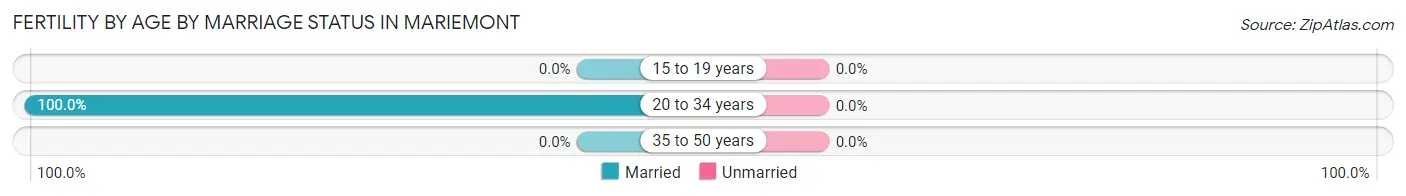
Fertility by Age by Marriage Status in Mariemont
| Age Bracket | Married | Unmarried |
| 15 to 19 years | 0 (0.0%) | 0 (0.0%) |
| 20 to 34 years | 54 (100.0%) | 0 (0.0%) |
| 35 to 50 years | 0 (0.0%) | 0 (0.0%) |
| Total | 54 (100.0%) | 0 (0.0%) |
Fertility by Education in Mariemont
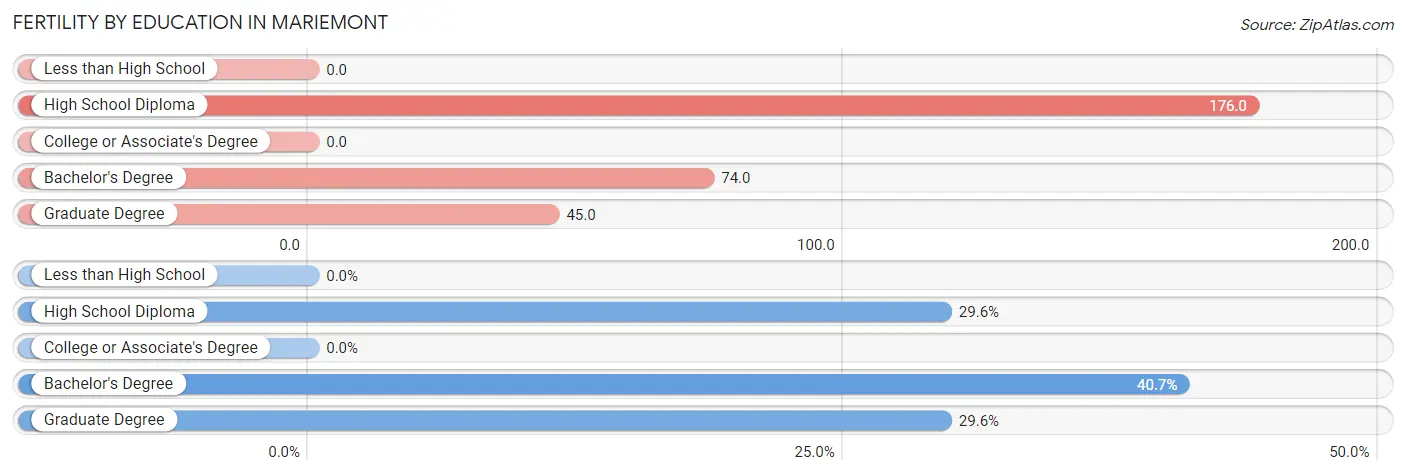
| Educational Attainment | Women with Births | Births / 1,000 Women |
| Less than High School | 0 (0.0%) | 0.0 |
| High School Diploma | 16 (29.6%) | 176.0 |
| College or Associate's Degree | 0 (0.0%) | 0.0 |
| Bachelor's Degree | 22 (40.7%) | 74.0 |
| Graduate Degree | 16 (29.6%) | 45.0 |
| Total | 54 (100.0%) | 59.0 |
Fertility by Education by Marriage Status in Mariemont
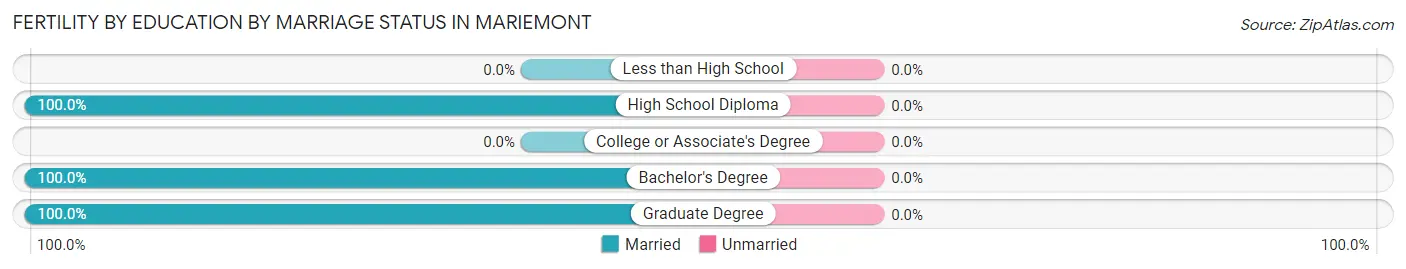
| Educational Attainment | Married | Unmarried |
| Less than High School | 0 (0.0%) | 0 (0.0%) |
| High School Diploma | 16 (100.0%) | 0 (0.0%) |
| College or Associate's Degree | 0 (0.0%) | 0 (0.0%) |
| Bachelor's Degree | 22 (100.0%) | 0 (0.0%) |
| Graduate Degree | 16 (100.0%) | 0 (0.0%) |
| Total | 54 (100.0%) | 0 (0.0%) |
Income in Mariemont
Income Overview in Mariemont
Per Capita Income in Mariemont is $77,053, while median incomes of families and households are $198,712 and $135,326 respectively.
| Characteristic | Number | Measure |
| Per Capita Income | 3,493 | $77,053 |
| Median Family Income | 874 | $198,712 |
| Mean Family Income | 874 | $263,364 |
| Median Household Income | 1,410 | $135,326 |
| Mean Household Income | 1,410 | $192,084 |
| Income Deficit | 874 | $0 |
| Wage / Income Gap (%) | 3,493 | 29.01% |
| Wage / Income Gap ($) | 3,493 | 70.99¢ per $1 |
| Gini / Inequality Index | 3,493 | 0.47 |
Earnings by Sex in Mariemont
Average Earnings in Mariemont are $72,563, $88,466 for men and $62,800 for women, a difference of 29.0%.
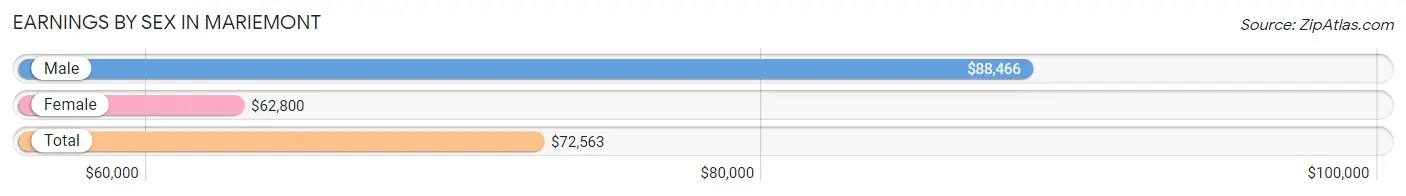
| Sex | Number | Average Earnings |
| Male | 911 (46.5%) | $88,466 |
| Female | 1,050 (53.5%) | $62,800 |
| Total | 1,961 (100.0%) | $72,563 |
Earnings by Sex by Income Bracket in Mariemont
The most common earnings brackets in Mariemont are $100,000+ for men (378 | 41.5%) and $100,000+ for women (347 | 33.1%).
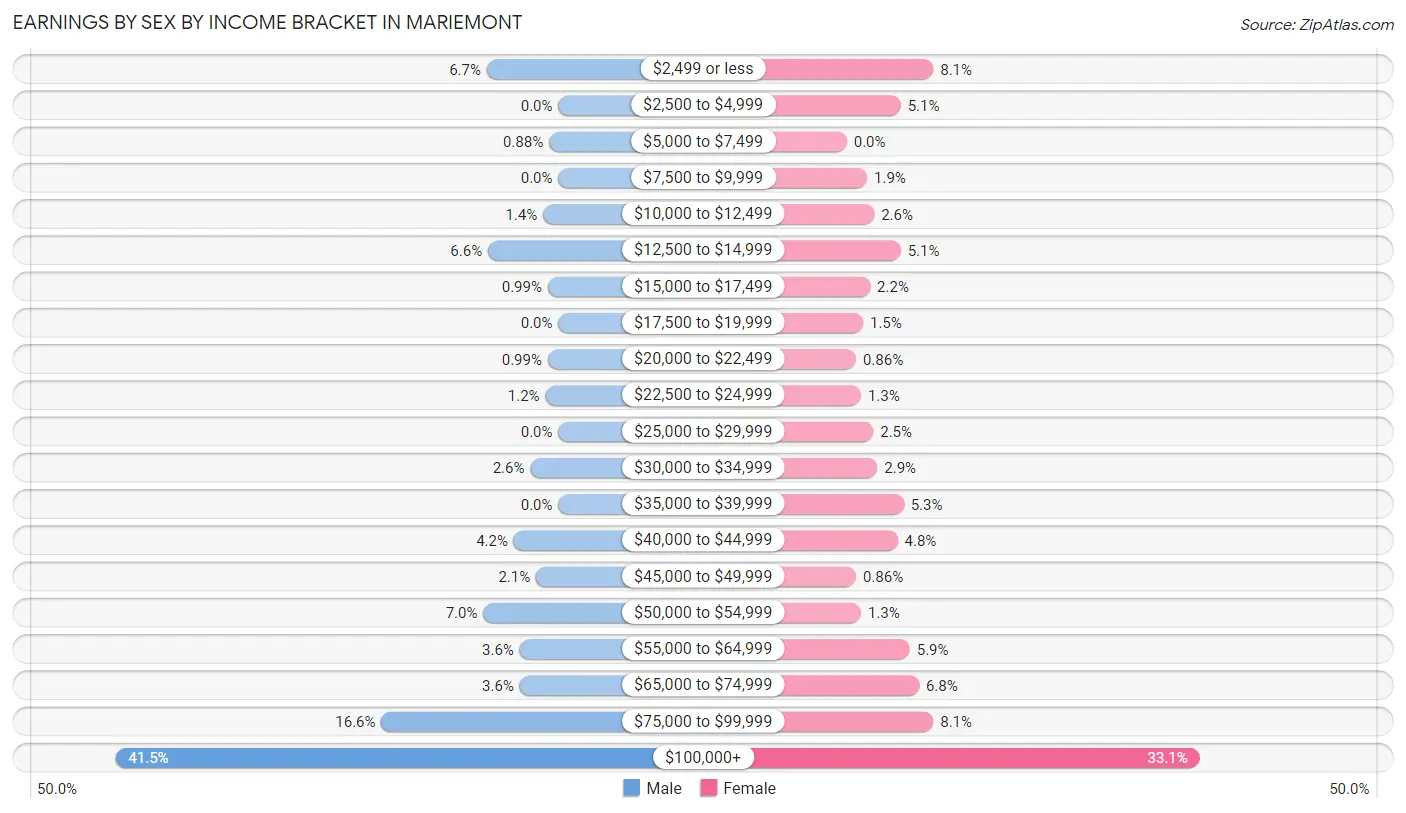
| Income | Male | Female |
| $2,499 or less | 61 (6.7%) | 85 (8.1%) |
| $2,500 to $4,999 | 0 (0.0%) | 53 (5.1%) |
| $5,000 to $7,499 | 8 (0.9%) | 0 (0.0%) |
| $7,500 to $9,999 | 0 (0.0%) | 20 (1.9%) |
| $10,000 to $12,499 | 13 (1.4%) | 27 (2.6%) |
| $12,500 to $14,999 | 60 (6.6%) | 53 (5.1%) |
| $15,000 to $17,499 | 9 (1.0%) | 23 (2.2%) |
| $17,500 to $19,999 | 0 (0.0%) | 16 (1.5%) |
| $20,000 to $22,499 | 9 (1.0%) | 9 (0.9%) |
| $22,500 to $24,999 | 11 (1.2%) | 14 (1.3%) |
| $25,000 to $29,999 | 0 (0.0%) | 26 (2.5%) |
| $30,000 to $34,999 | 24 (2.6%) | 30 (2.9%) |
| $35,000 to $39,999 | 0 (0.0%) | 56 (5.3%) |
| $40,000 to $44,999 | 38 (4.2%) | 50 (4.8%) |
| $45,000 to $49,999 | 19 (2.1%) | 9 (0.9%) |
| $50,000 to $54,999 | 64 (7.0%) | 14 (1.3%) |
| $55,000 to $64,999 | 33 (3.6%) | 62 (5.9%) |
| $65,000 to $74,999 | 33 (3.6%) | 71 (6.8%) |
| $75,000 to $99,999 | 151 (16.6%) | 85 (8.1%) |
| $100,000+ | 378 (41.5%) | 347 (33.1%) |
| Total | 911 (100.0%) | 1,050 (100.0%) |
Earnings by Sex by Educational Attainment in Mariemont
Average earnings in Mariemont are $92,188 for men and $69,353 for women, a difference of 24.8%. Men with an educational attainment of bachelor's degree enjoy the highest average annual earnings of $116,875, while those with college or associate's degree education earn the least with $75,313. Women with an educational attainment of graduate degree earn the most with the average annual earnings of $97,308, while those with bachelor's degree education have the smallest earnings of $62,981.
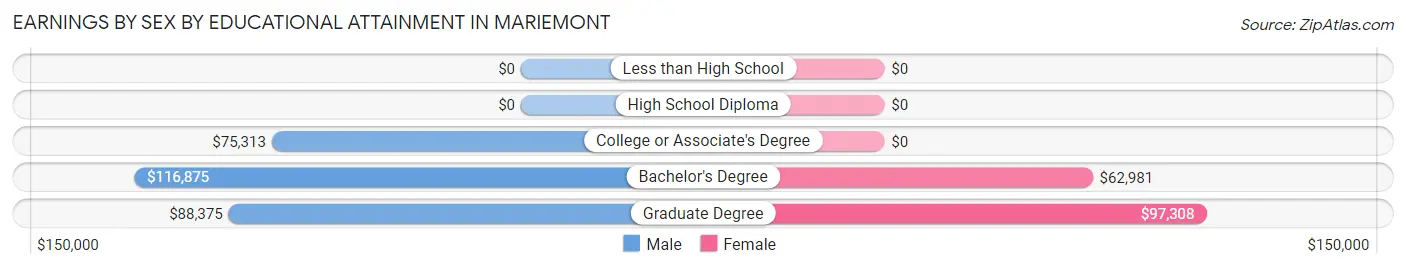
| Educational Attainment | Male Income | Female Income |
| Less than High School | - | - |
| High School Diploma | - | - |
| College or Associate's Degree | $75,313 | $0 |
| Bachelor's Degree | $116,875 | $62,981 |
| Graduate Degree | $88,375 | $97,308 |
| Total | $92,188 | $69,353 |
Family Income in Mariemont
Family Income Brackets in Mariemont
According to the Mariemont family income data, there are 420 families falling into the $200,000+ income range, which is the most common income bracket and makes up 48.0% of all families.
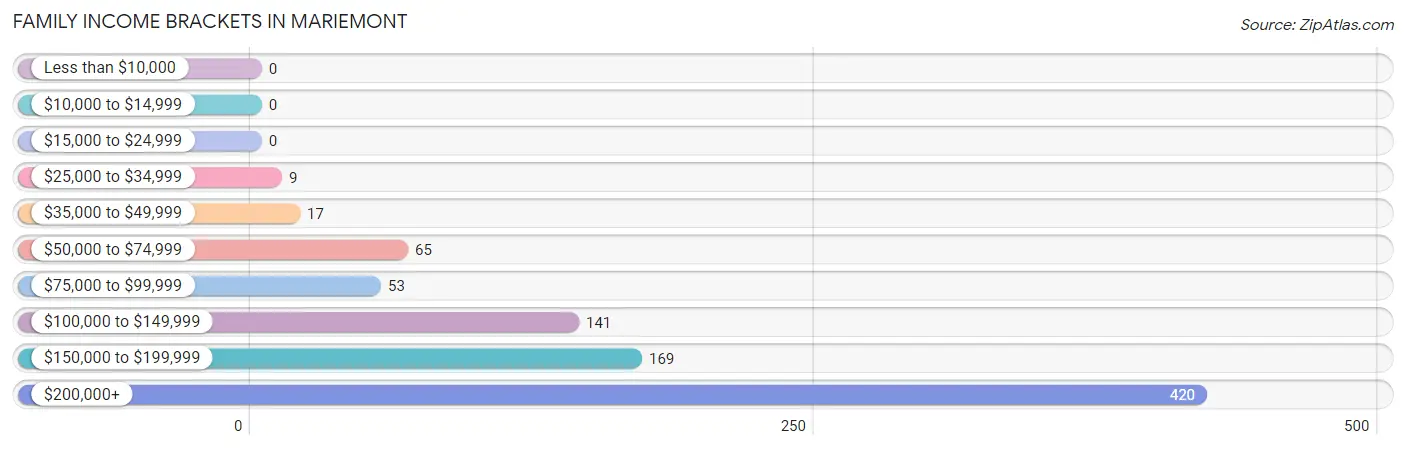
| Income Bracket | # Families | % Families |
| Less than $10,000 | 0 | 0.0% |
| $10,000 to $14,999 | 0 | 0.0% |
| $15,000 to $24,999 | 0 | 0.0% |
| $25,000 to $34,999 | 9 | 1.0% |
| $35,000 to $49,999 | 17 | 1.9% |
| $50,000 to $74,999 | 65 | 7.4% |
| $75,000 to $99,999 | 53 | 6.1% |
| $100,000 to $149,999 | 141 | 16.1% |
| $150,000 to $199,999 | 169 | 19.3% |
| $200,000+ | 420 | 48.1% |
Family Income by Famaliy Size in Mariemont
5-person families (118 | 13.5%) account for the highest median family income in Mariemont with $250,001 per family, while 2-person families (371 | 42.4%) have the highest median income of $80,990 per family member.
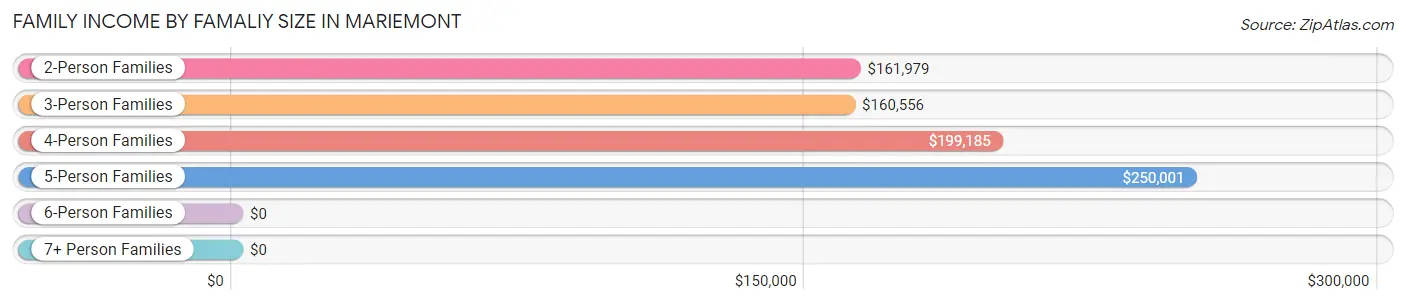
| Income Bracket | # Families | Median Income |
| 2-Person Families | 371 (42.4%) | $161,979 |
| 3-Person Families | 126 (14.4%) | $160,556 |
| 4-Person Families | 199 (22.8%) | $199,185 |
| 5-Person Families | 118 (13.5%) | $250,001 |
| 6-Person Families | 60 (6.9%) | $0 |
| 7+ Person Families | 0 (0.0%) | $0 |
| Total | 874 (100.0%) | $198,712 |
Family Income by Number of Earners in Mariemont
The median family income in Mariemont is $198,712, with families comprising 3+ earners (117) having the highest median family income of $250,001, while families with no earners (117) have the lowest median family income of $80,208, accounting for 13.4% and 13.4% of families, respectively.
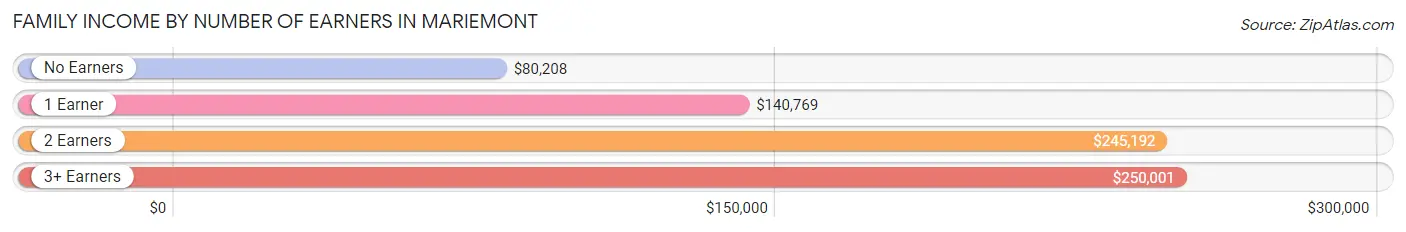
| Number of Earners | # Families | Median Income |
| No Earners | 117 (13.4%) | $80,208 |
| 1 Earner | 180 (20.6%) | $140,769 |
| 2 Earners | 460 (52.6%) | $245,192 |
| 3+ Earners | 117 (13.4%) | $250,001 |
| Total | 874 (100.0%) | $198,712 |
Household Income in Mariemont
Household Income Brackets in Mariemont
With 443 households falling in the category, the $200,000+ income range is the most frequent in Mariemont, accounting for 31.4% of all households. In contrast, only 16 households (1.1%) fall into the $10,000 to $14,999 income bracket, making it the least populous group.
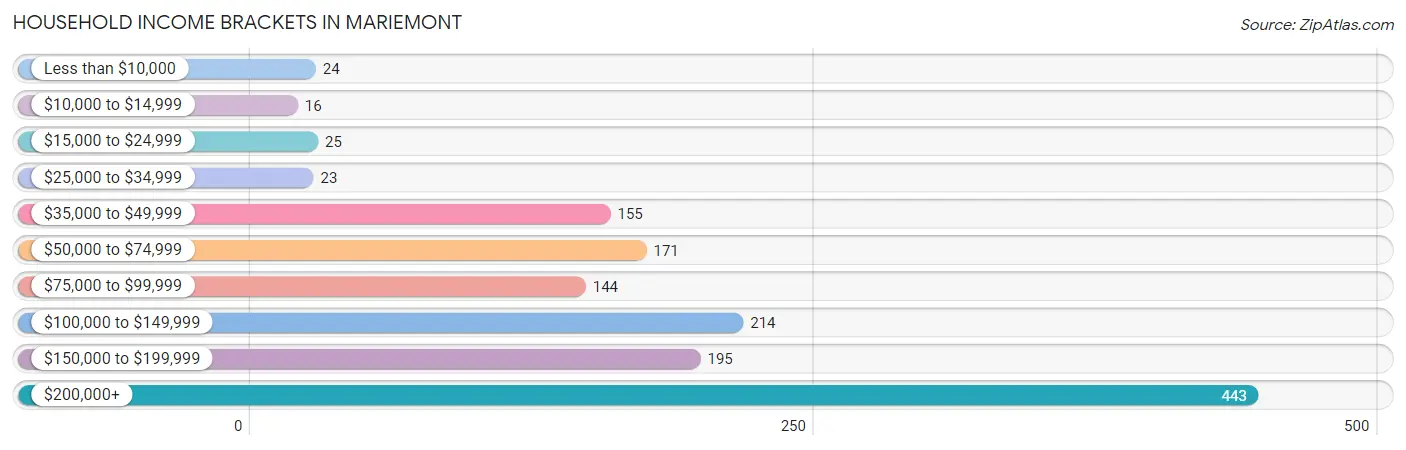
| Income Bracket | # Households | % Households |
| Less than $10,000 | 24 | 1.7% |
| $10,000 to $14,999 | 16 | 1.1% |
| $15,000 to $24,999 | 25 | 1.8% |
| $25,000 to $34,999 | 23 | 1.6% |
| $35,000 to $49,999 | 155 | 11.0% |
| $50,000 to $74,999 | 171 | 12.1% |
| $75,000 to $99,999 | 144 | 10.2% |
| $100,000 to $149,999 | 214 | 15.2% |
| $150,000 to $199,999 | 195 | 13.8% |
| $200,000+ | 443 | 31.4% |
Household Income by Householder Age in Mariemont
The median household income in Mariemont is $135,326, with the highest median household income of $192,500 found in the 45 to 64 years age bracket for the primary householder. A total of 594 households (42.1%) fall into this category. Meanwhile, the 15 to 24 years age bracket for the primary householder has the lowest median household income of $0, with 15 households (1.1%) in this group.
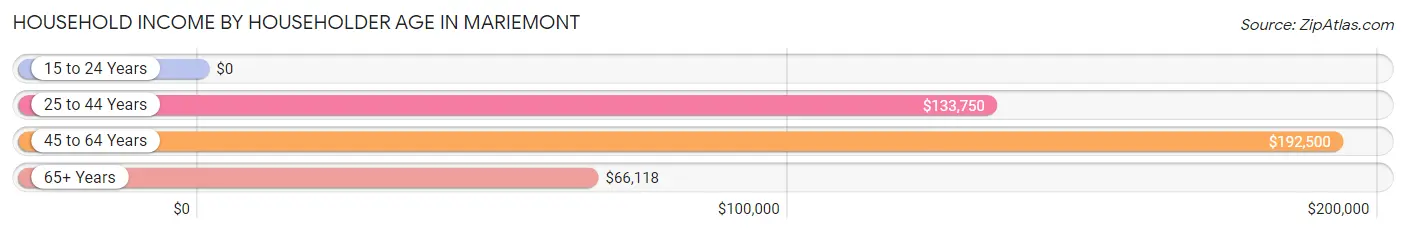
| Income Bracket | # Households | Median Income |
| 15 to 24 Years | 15 (1.1%) | $0 |
| 25 to 44 Years | 482 (34.2%) | $133,750 |
| 45 to 64 Years | 594 (42.1%) | $192,500 |
| 65+ Years | 319 (22.6%) | $66,118 |
| Total | 1,410 (100.0%) | $135,326 |
Poverty in Mariemont
Income Below Poverty by Sex and Age in Mariemont
With 0.9% poverty level for males and 1.4% for females among the residents of Mariemont, 45 to 54 year old males and 65 to 74 year old females are the most vulnerable to poverty, with 15 males (4.5%) and 9 females (7.5%) in their respective age groups living below the poverty level.
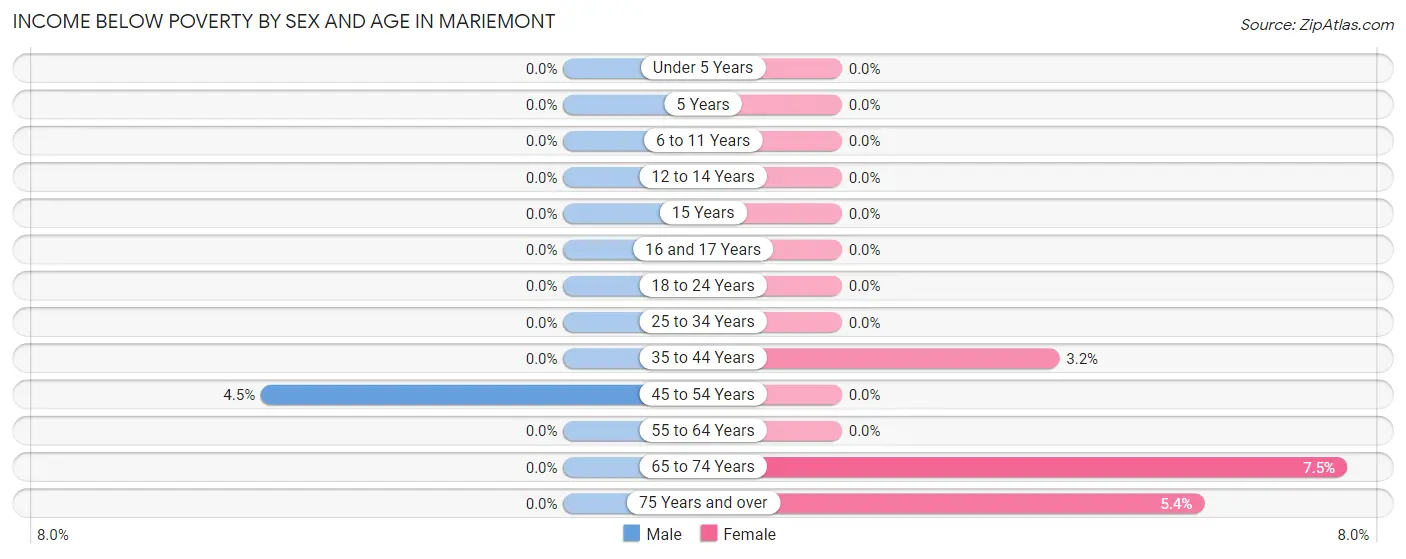
| Age Bracket | Male | Female |
| Under 5 Years | 0 (0.0%) | 0 (0.0%) |
| 5 Years | 0 (0.0%) | 0 (0.0%) |
| 6 to 11 Years | 0 (0.0%) | 0 (0.0%) |
| 12 to 14 Years | 0 (0.0%) | 0 (0.0%) |
| 15 Years | 0 (0.0%) | 0 (0.0%) |
| 16 and 17 Years | 0 (0.0%) | 0 (0.0%) |
| 18 to 24 Years | 0 (0.0%) | 0 (0.0%) |
| 25 to 34 Years | 0 (0.0%) | 0 (0.0%) |
| 35 to 44 Years | 0 (0.0%) | 9 (3.2%) |
| 45 to 54 Years | 15 (4.5%) | 0 (0.0%) |
| 55 to 64 Years | 0 (0.0%) | 0 (0.0%) |
| 65 to 74 Years | 0 (0.0%) | 9 (7.5%) |
| 75 Years and over | 0 (0.0%) | 7 (5.4%) |
| Total | 15 (0.9%) | 25 (1.4%) |
Income Above Poverty by Sex and Age in Mariemont
According to the poverty statistics in Mariemont, males aged under 5 years and females aged under 5 years are the age groups that are most secure financially, with 100.0% of males and 100.0% of females in these age groups living above the poverty line.
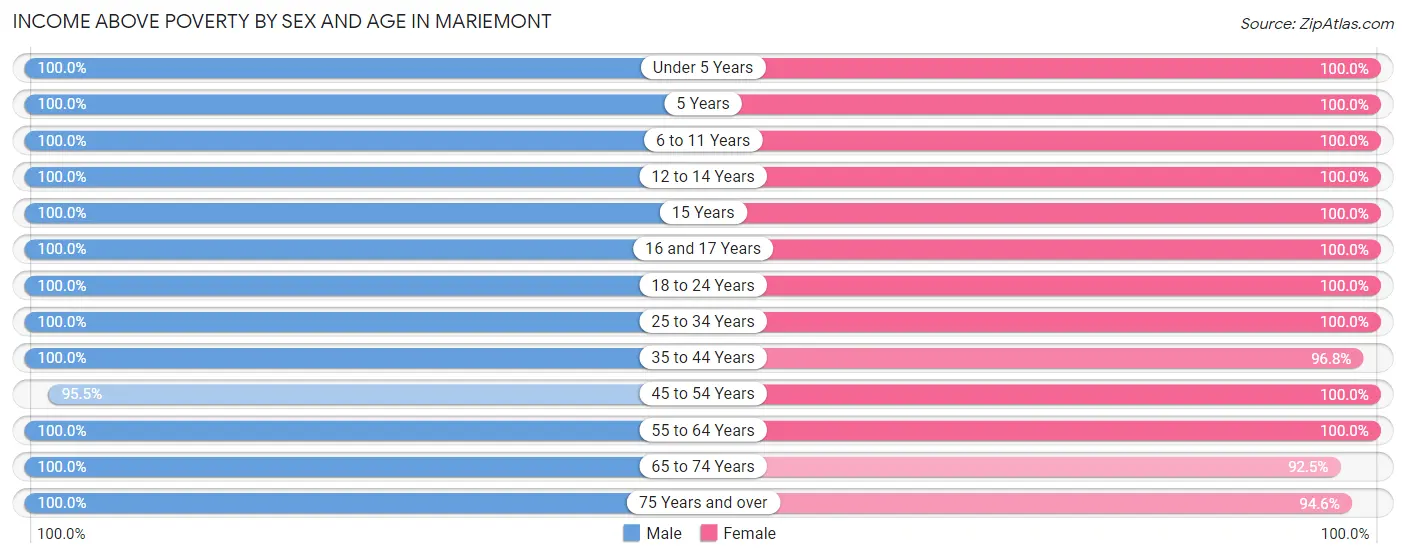
| Age Bracket | Male | Female |
| Under 5 Years | 121 (100.0%) | 135 (100.0%) |
| 5 Years | 28 (100.0%) | 12 (100.0%) |
| 6 to 11 Years | 118 (100.0%) | 83 (100.0%) |
| 12 to 14 Years | 155 (100.0%) | 63 (100.0%) |
| 15 Years | 55 (100.0%) | 23 (100.0%) |
| 16 and 17 Years | 77 (100.0%) | 83 (100.0%) |
| 18 to 24 Years | 69 (100.0%) | 112 (100.0%) |
| 25 to 34 Years | 165 (100.0%) | 263 (100.0%) |
| 35 to 44 Years | 225 (100.0%) | 270 (96.8%) |
| 45 to 54 Years | 319 (95.5%) | 251 (100.0%) |
| 55 to 64 Years | 142 (100.0%) | 185 (100.0%) |
| 65 to 74 Years | 138 (100.0%) | 111 (92.5%) |
| 75 Years and over | 80 (100.0%) | 123 (94.6%) |
| Total | 1,692 (99.1%) | 1,714 (98.6%) |
Income Below Poverty Among Married-Couple Families in Mariemont
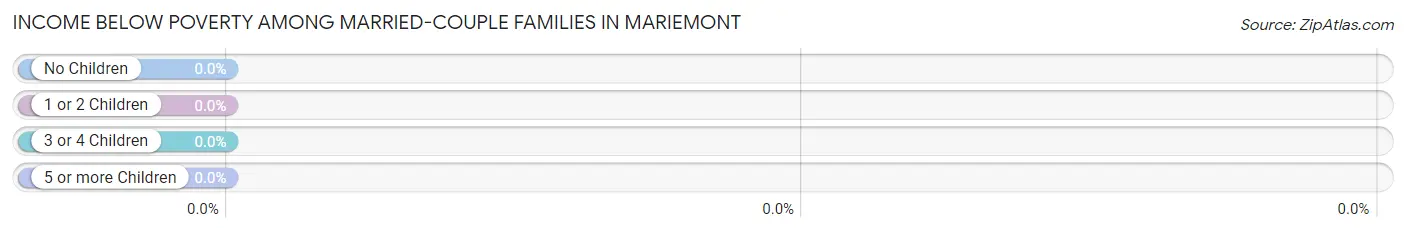
| Children | Above Poverty | Below Poverty |
| No Children | 370 (100.0%) | 0 (0.0%) |
| 1 or 2 Children | 295 (100.0%) | 0 (0.0%) |
| 3 or 4 Children | 156 (100.0%) | 0 (0.0%) |
| 5 or more Children | 0 (0.0%) | 0 (0.0%) |
| Total | 821 (100.0%) | 0 (0.0%) |
Income Below Poverty Among Single-Parent Households in Mariemont
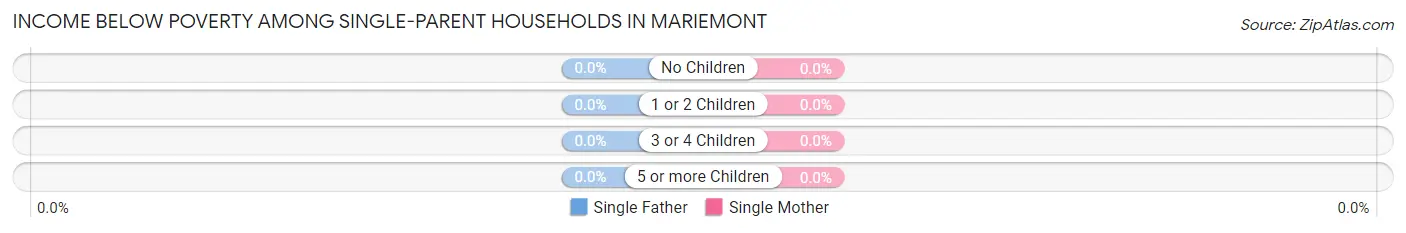
| Children | Single Father | Single Mother |
| No Children | 0 (0.0%) | 0 (0.0%) |
| 1 or 2 Children | 0 (0.0%) | 0 (0.0%) |
| 3 or 4 Children | 0 (0.0%) | 0 (0.0%) |
| 5 or more Children | 0 (0.0%) | 0 (0.0%) |
| Total | 0 (0.0%) | 0 (0.0%) |
Income Below Poverty Among Married-Couple vs Single-Parent Households in Mariemont
| Children | Married-Couple Families | Single-Parent Households |
| No Children | 0 (0.0%) | 0 (0.0%) |
| 1 or 2 Children | 0 (0.0%) | 0 (0.0%) |
| 3 or 4 Children | 0 (0.0%) | 0 (0.0%) |
| 5 or more Children | 0 (0.0%) | 0 (0.0%) |
| Total | 0 (0.0%) | 0 (0.0%) |
Employment Characteristics in Mariemont
Employment by Class of Employer in Mariemont
Among the 1,704 employed individuals in Mariemont, private company employees (937 | 55.0%), not-for-profit organizations (296 | 17.4%), and local government employees (177 | 10.4%) make up the most common classes of employment.
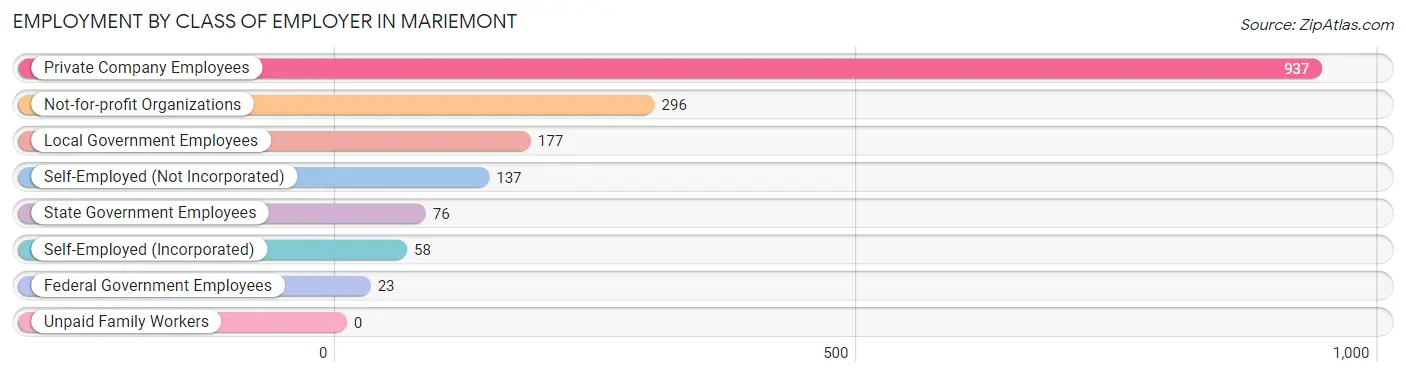
| Employer Class | # Employees | % Employees |
| Private Company Employees | 937 | 55.0% |
| Self-Employed (Incorporated) | 58 | 3.4% |
| Self-Employed (Not Incorporated) | 137 | 8.0% |
| Not-for-profit Organizations | 296 | 17.4% |
| Local Government Employees | 177 | 10.4% |
| State Government Employees | 76 | 4.5% |
| Federal Government Employees | 23 | 1.3% |
| Unpaid Family Workers | 0 | 0.0% |
| Total | 1,704 | 100.0% |
Employment Status by Age in Mariemont
According to the labor force statistics for Mariemont, out of the total population over 16 years of age (2,700), 67.1% or 1,812 individuals are in the labor force, with 1.6% or 29 of them unemployed. The age group with the highest labor force participation rate is 25 to 29 years, with 100.0% or 98 individuals in the labor force. Within the labor force, the 45 to 54 years age range has the highest percentage of unemployed individuals, with 6.1% or 29 of them being unemployed.
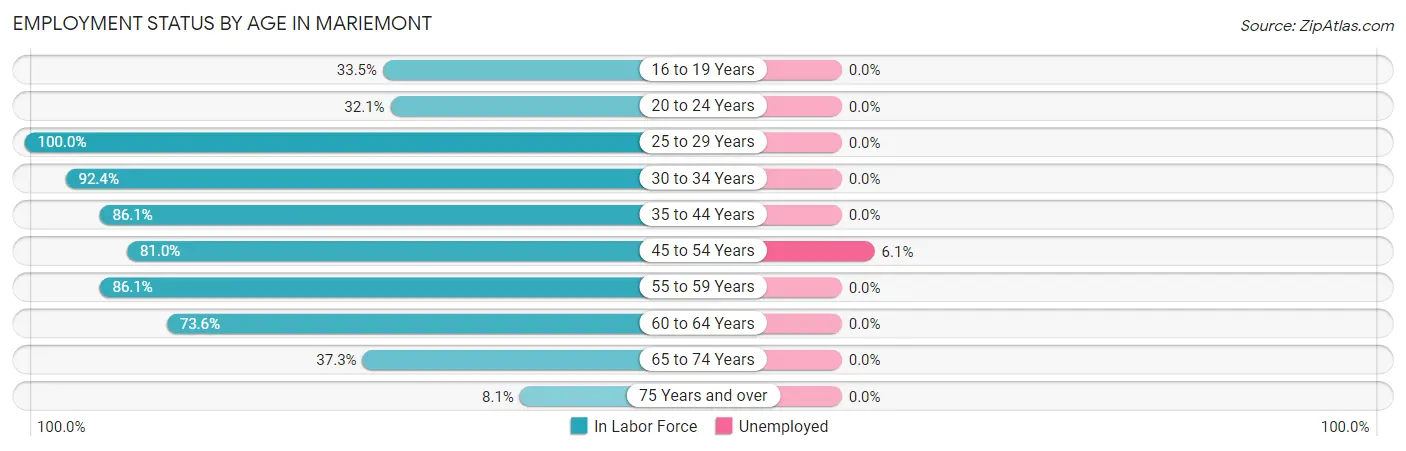
| Age Bracket | In Labor Force | Unemployed |
| 16 to 19 Years | 88 (33.5%) | 0 (0.0%) |
| 20 to 24 Years | 25 (32.1%) | 0 (0.0%) |
| 25 to 29 Years | 98 (100.0%) | 0 (0.0%) |
| 30 to 34 Years | 305 (92.4%) | 0 (0.0%) |
| 35 to 44 Years | 434 (86.1%) | 0 (0.0%) |
| 45 to 54 Years | 474 (81.0%) | 29 (6.1%) |
| 55 to 59 Years | 161 (86.1%) | 0 (0.0%) |
| 60 to 64 Years | 103 (73.6%) | 0 (0.0%) |
| 65 to 74 Years | 104 (37.3%) | 0 (0.0%) |
| 75 Years and over | 19 (8.1%) | 0 (0.0%) |
| Total | 1,812 (67.1%) | 29 (1.6%) |
Employment Status by Educational Attainment in Mariemont
According to labor force statistics for Mariemont, 85.4% of individuals (1,575) out of the total population between 25 and 64 years of age (1,844) are in the labor force, with 1.8% or 28 of them being unemployed. The group with the highest labor force participation rate are those with the educational attainment of less than high school, with 100.0% or 15 individuals in the labor force. Within the labor force, individuals with bachelor's degree or higher education have the highest percentage of unemployment, with 2.1% or 29 of them being unemployed.
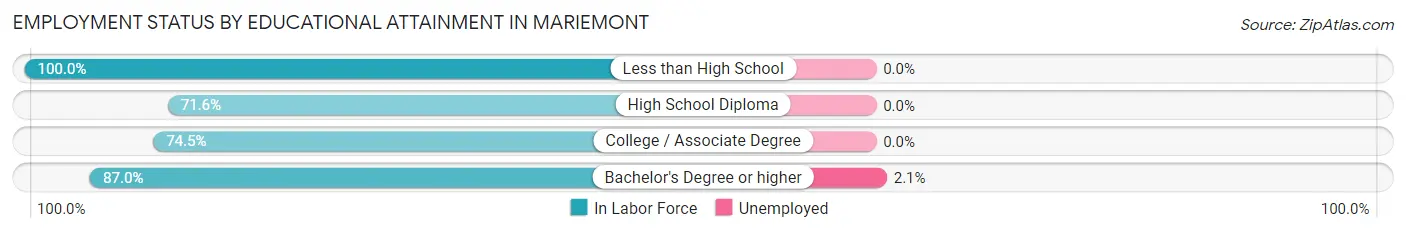
| Educational Attainment | In Labor Force | Unemployed |
| Less than High School | 15 (100.0%) | 0 (0.0%) |
| High School Diploma | 48 (71.6%) | 0 (0.0%) |
| College / Associate Degree | 123 (74.5%) | 0 (0.0%) |
| Bachelor's Degree or higher | 1,389 (87.0%) | 34 (2.1%) |
| Total | 1,575 (85.4%) | 33 (1.8%) |
Employment Occupations by Sex in Mariemont
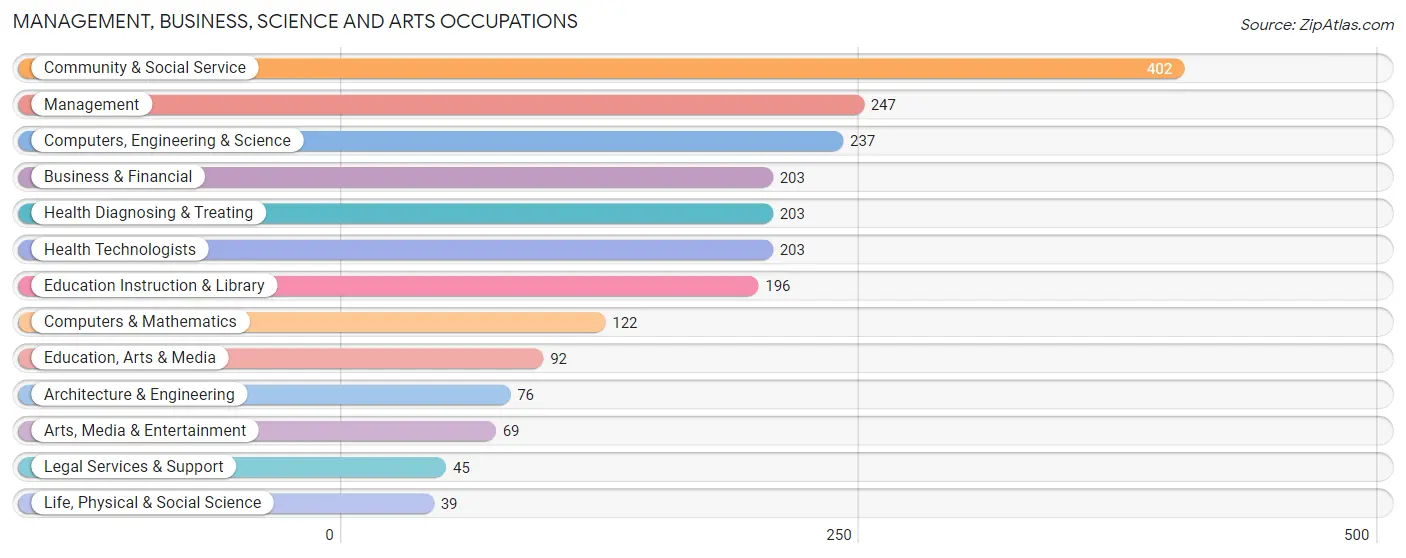
Management, Business, Science and Arts Occupations
The most common Management, Business, Science and Arts occupations in Mariemont are Community & Social Service (402 | 22.6%), Management (247 | 13.9%), Computers, Engineering & Science (237 | 13.3%), Business & Financial (203 | 11.4%), and Health Diagnosing & Treating (203 | 11.4%).
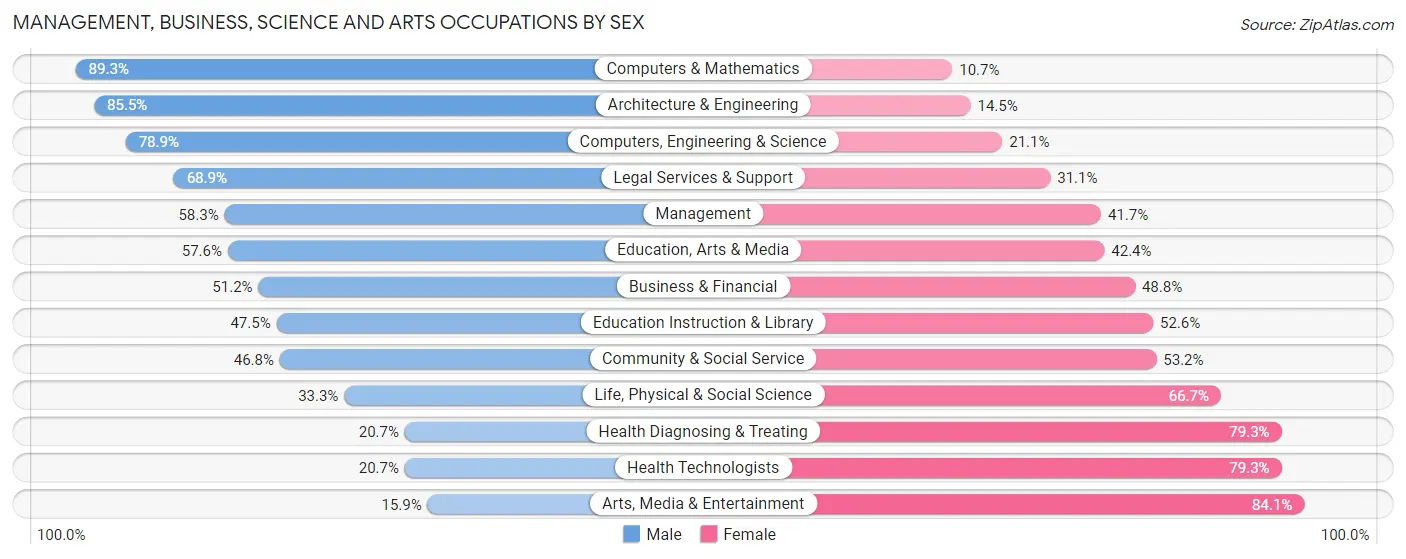
Management, Business, Science and Arts Occupations by Sex
Within the Management, Business, Science and Arts occupations in Mariemont, the most male-oriented occupations are Computers & Mathematics (89.3%), Architecture & Engineering (85.5%), and Computers, Engineering & Science (78.9%), while the most female-oriented occupations are Arts, Media & Entertainment (84.1%), Health Diagnosing & Treating (79.3%), and Health Technologists (79.3%).
| Occupation | Male | Female |
| Management | 144 (58.3%) | 103 (41.7%) |
| Business & Financial | 104 (51.2%) | 99 (48.8%) |
| Computers, Engineering & Science | 187 (78.9%) | 50 (21.1%) |
| Computers & Mathematics | 109 (89.3%) | 13 (10.7%) |
| Architecture & Engineering | 65 (85.5%) | 11 (14.5%) |
| Life, Physical & Social Science | 13 (33.3%) | 26 (66.7%) |
| Community & Social Service | 188 (46.8%) | 214 (53.2%) |
| Education, Arts & Media | 53 (57.6%) | 39 (42.4%) |
| Legal Services & Support | 31 (68.9%) | 14 (31.1%) |
| Education Instruction & Library | 93 (47.4%) | 103 (52.5%) |
| Arts, Media & Entertainment | 11 (15.9%) | 58 (84.1%) |
| Health Diagnosing & Treating | 42 (20.7%) | 161 (79.3%) |
| Health Technologists | 42 (20.7%) | 161 (79.3%) |
| Total (Category) | 665 (51.5%) | 627 (48.5%) |
| Total (Overall) | 853 (47.9%) | 929 (52.1%) |
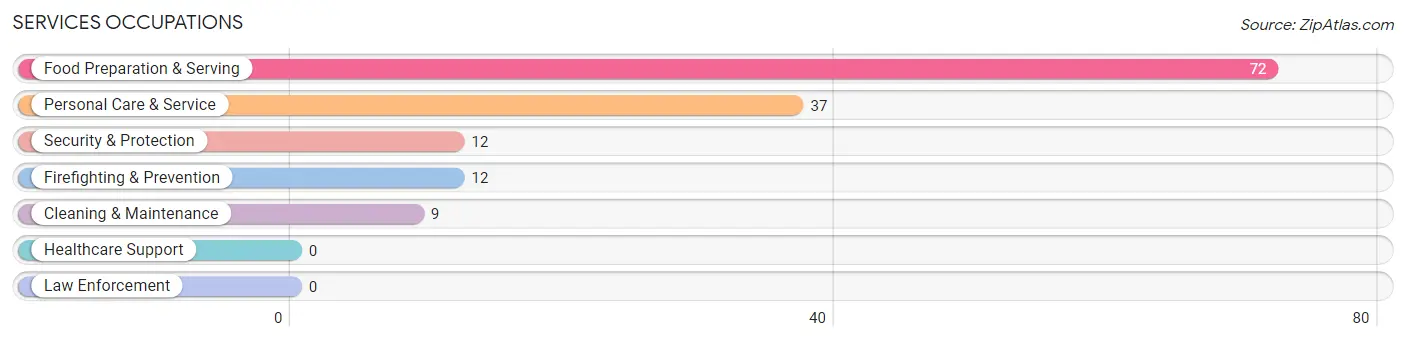
Services Occupations
The most common Services occupations in Mariemont are Food Preparation & Serving (72 | 4.0%), Personal Care & Service (37 | 2.1%), Security & Protection (12 | 0.7%), Firefighting & Prevention (12 | 0.7%), and Cleaning & Maintenance (9 | 0.5%).
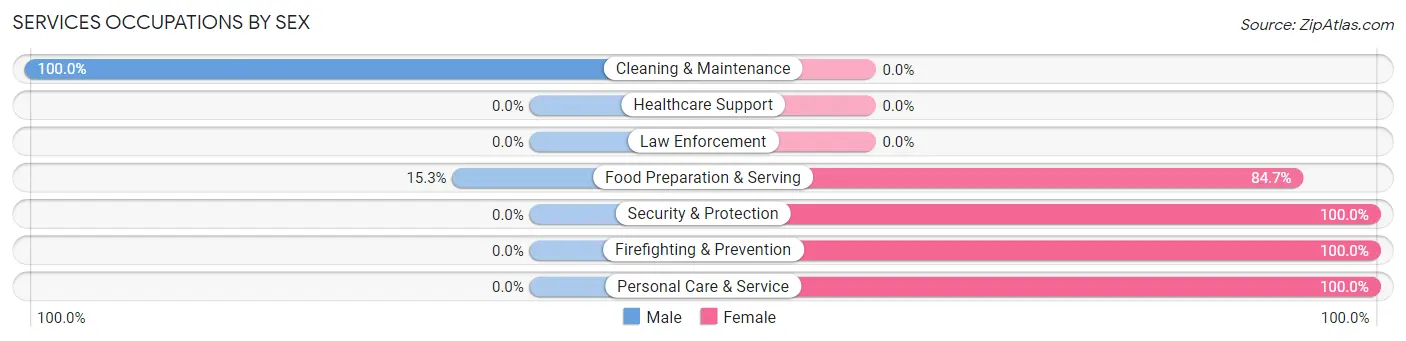
Services Occupations by Sex
Within the Services occupations in Mariemont, the most male-oriented occupations are Cleaning & Maintenance (100.0%), and Food Preparation & Serving (15.3%), while the most female-oriented occupations are Security & Protection (100.0%), Firefighting & Prevention (100.0%), and Personal Care & Service (100.0%).
| Occupation | Male | Female |
| Healthcare Support | 0 (0.0%) | 0 (0.0%) |
| Security & Protection | 0 (0.0%) | 12 (100.0%) |
| Firefighting & Prevention | 0 (0.0%) | 12 (100.0%) |
| Law Enforcement | 0 (0.0%) | 0 (0.0%) |
| Food Preparation & Serving | 11 (15.3%) | 61 (84.7%) |
| Cleaning & Maintenance | 9 (100.0%) | 0 (0.0%) |
| Personal Care & Service | 0 (0.0%) | 37 (100.0%) |
| Total (Category) | 20 (15.4%) | 110 (84.6%) |
| Total (Overall) | 853 (47.9%) | 929 (52.1%) |
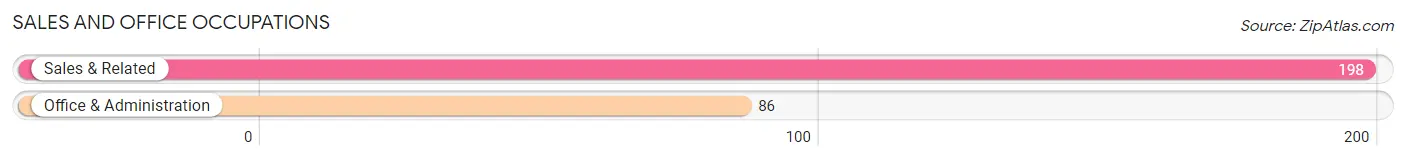
Sales and Office Occupations
The most common Sales and Office occupations in Mariemont are Sales & Related (198 | 11.1%), and Office & Administration (86 | 4.8%).
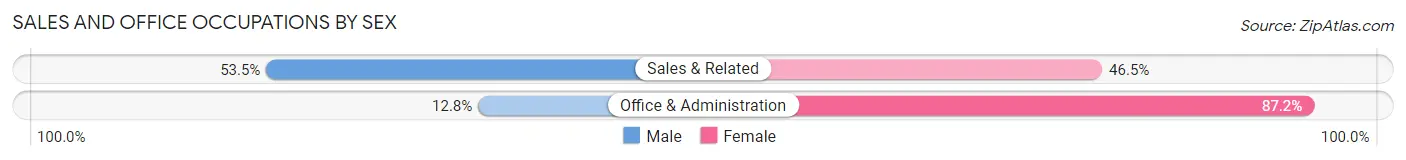
Sales and Office Occupations by Sex
| Occupation | Male | Female |
| Sales & Related | 106 (53.5%) | 92 (46.5%) |
| Office & Administration | 11 (12.8%) | 75 (87.2%) |
| Total (Category) | 117 (41.2%) | 167 (58.8%) |
| Total (Overall) | 853 (47.9%) | 929 (52.1%) |
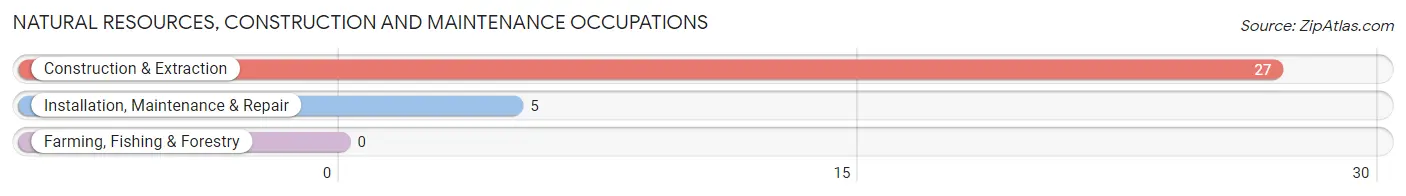
Natural Resources, Construction and Maintenance Occupations
The most common Natural Resources, Construction and Maintenance occupations in Mariemont are Construction & Extraction (27 | 1.5%), and Installation, Maintenance & Repair (5 | 0.3%).
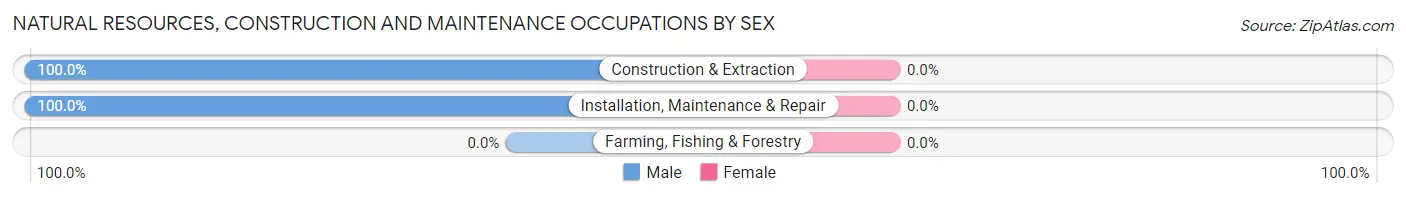
Natural Resources, Construction and Maintenance Occupations by Sex
| Occupation | Male | Female |
| Farming, Fishing & Forestry | 0 (0.0%) | 0 (0.0%) |
| Construction & Extraction | 27 (100.0%) | 0 (0.0%) |
| Installation, Maintenance & Repair | 5 (100.0%) | 0 (0.0%) |
| Total (Category) | 32 (100.0%) | 0 (0.0%) |
| Total (Overall) | 853 (47.9%) | 929 (52.1%) |
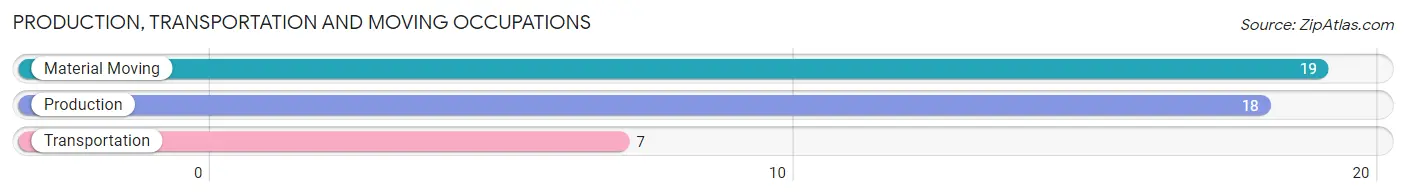
Production, Transportation and Moving Occupations
The most common Production, Transportation and Moving occupations in Mariemont are Material Moving (19 | 1.1%), Production (18 | 1.0%), and Transportation (7 | 0.4%).
Production, Transportation and Moving Occupations by Sex
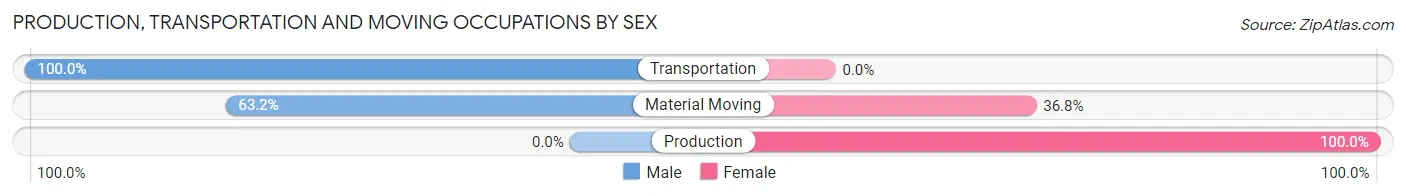
| Occupation | Male | Female |
| Production | 0 (0.0%) | 18 (100.0%) |
| Transportation | 7 (100.0%) | 0 (0.0%) |
| Material Moving | 12 (63.2%) | 7 (36.8%) |
| Total (Category) | 19 (43.2%) | 25 (56.8%) |
| Total (Overall) | 853 (47.9%) | 929 (52.1%) |
Employment Industries by Sex in Mariemont
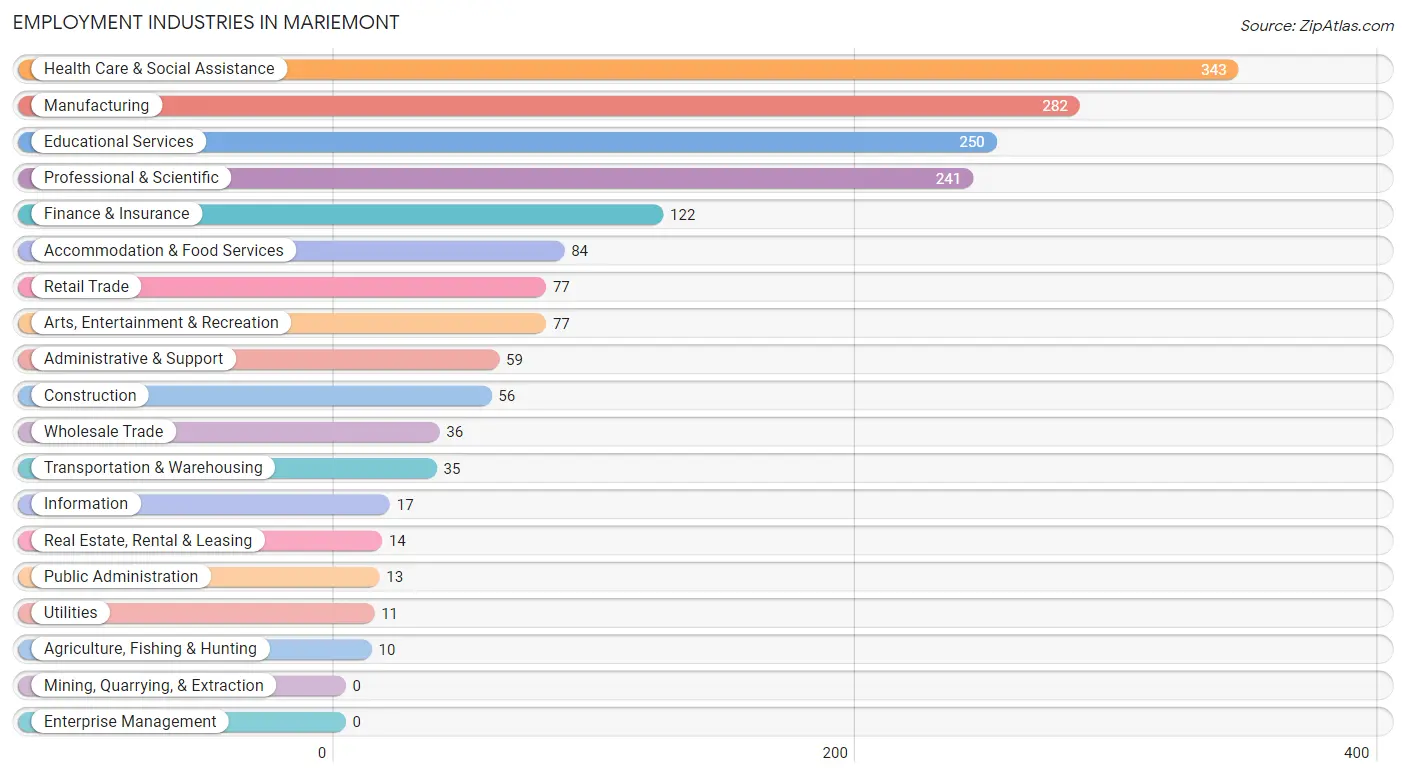
Employment Industries in Mariemont
The major employment industries in Mariemont include Health Care & Social Assistance (343 | 19.3%), Manufacturing (282 | 15.8%), Educational Services (250 | 14.0%), Professional & Scientific (241 | 13.5%), and Finance & Insurance (122 | 6.9%).
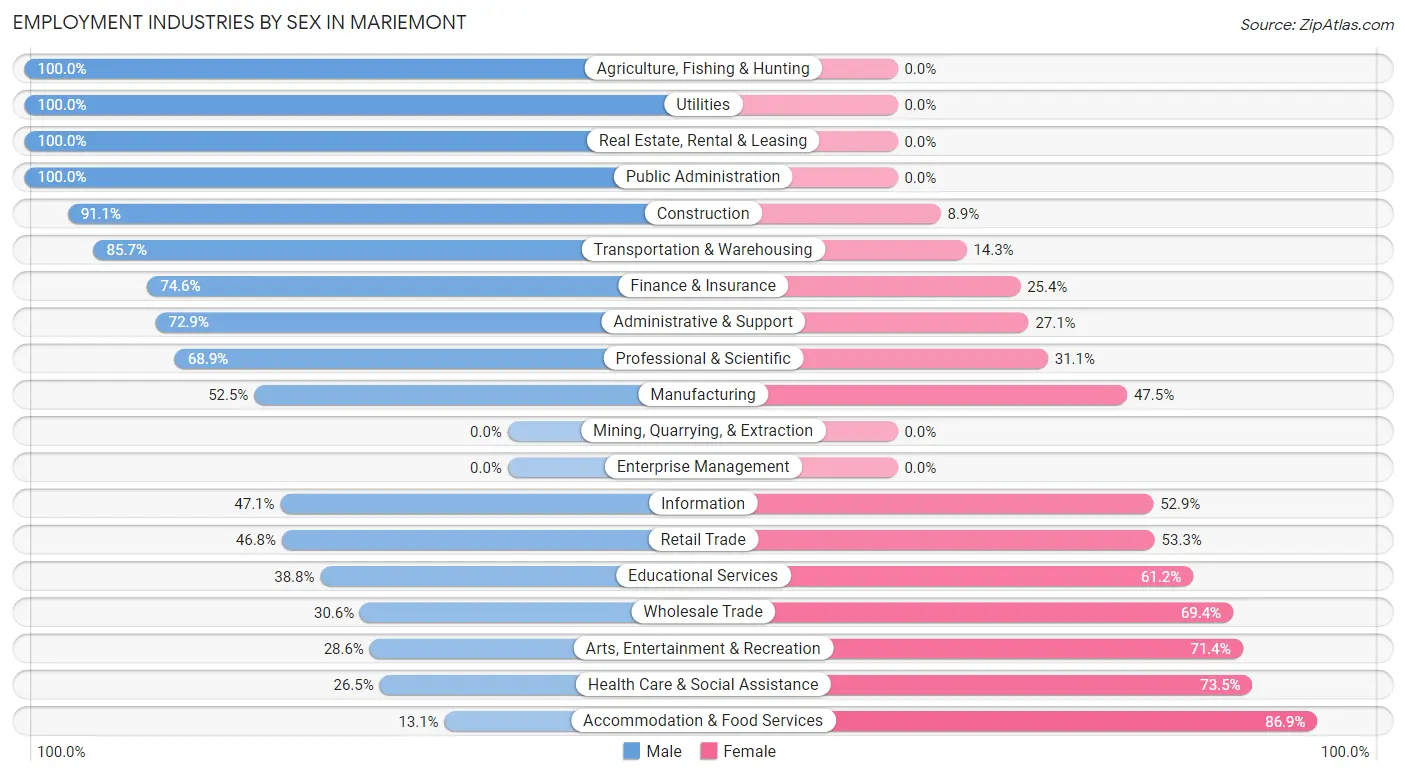
Employment Industries by Sex in Mariemont
The Mariemont industries that see more men than women are Agriculture, Fishing & Hunting (100.0%), Utilities (100.0%), and Real Estate, Rental & Leasing (100.0%), whereas the industries that tend to have a higher number of women are Accommodation & Food Services (86.9%), Health Care & Social Assistance (73.5%), and Arts, Entertainment & Recreation (71.4%).
| Industry | Male | Female |
| Agriculture, Fishing & Hunting | 10 (100.0%) | 0 (0.0%) |
| Mining, Quarrying, & Extraction | 0 (0.0%) | 0 (0.0%) |
| Construction | 51 (91.1%) | 5 (8.9%) |
| Manufacturing | 148 (52.5%) | 134 (47.5%) |
| Wholesale Trade | 11 (30.6%) | 25 (69.4%) |
| Retail Trade | 36 (46.8%) | 41 (53.2%) |
| Transportation & Warehousing | 30 (85.7%) | 5 (14.3%) |
| Utilities | 11 (100.0%) | 0 (0.0%) |
| Information | 8 (47.1%) | 9 (52.9%) |
| Finance & Insurance | 91 (74.6%) | 31 (25.4%) |
| Real Estate, Rental & Leasing | 14 (100.0%) | 0 (0.0%) |
| Professional & Scientific | 166 (68.9%) | 75 (31.1%) |
| Enterprise Management | 0 (0.0%) | 0 (0.0%) |
| Administrative & Support | 43 (72.9%) | 16 (27.1%) |
| Educational Services | 97 (38.8%) | 153 (61.2%) |
| Health Care & Social Assistance | 91 (26.5%) | 252 (73.5%) |
| Arts, Entertainment & Recreation | 22 (28.6%) | 55 (71.4%) |
| Accommodation & Food Services | 11 (13.1%) | 73 (86.9%) |
| Public Administration | 13 (100.0%) | 0 (0.0%) |
| Total | 853 (47.9%) | 929 (52.1%) |
Education in Mariemont
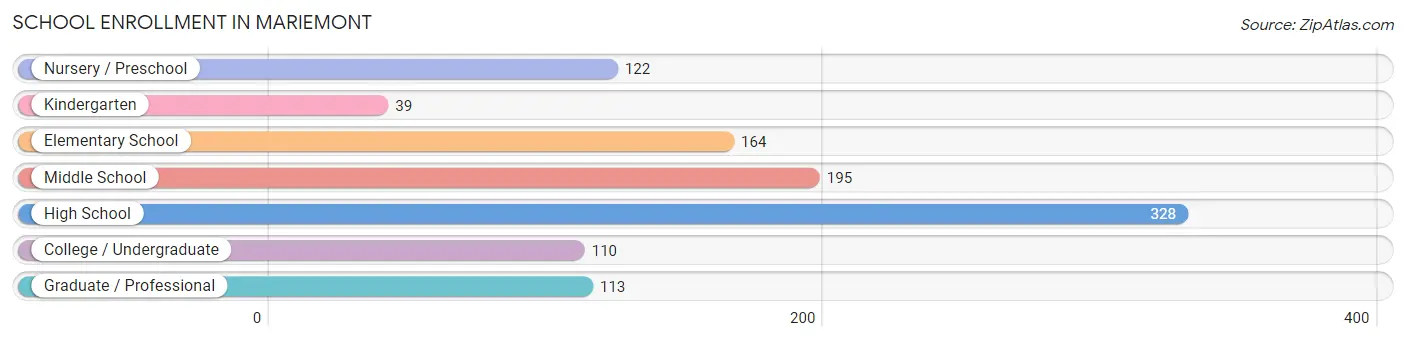
School Enrollment in Mariemont
The most common levels of schooling among the 1,071 students in Mariemont are high school (328 | 30.6%), middle school (195 | 18.2%), and elementary school (164 | 15.3%).
| School Level | # Students | % Students |
| Nursery / Preschool | 122 | 11.4% |
| Kindergarten | 39 | 3.6% |
| Elementary School | 164 | 15.3% |
| Middle School | 195 | 18.2% |
| High School | 328 | 30.6% |
| College / Undergraduate | 110 | 10.3% |
| Graduate / Professional | 113 | 10.5% |
| Total | 1,071 | 100.0% |
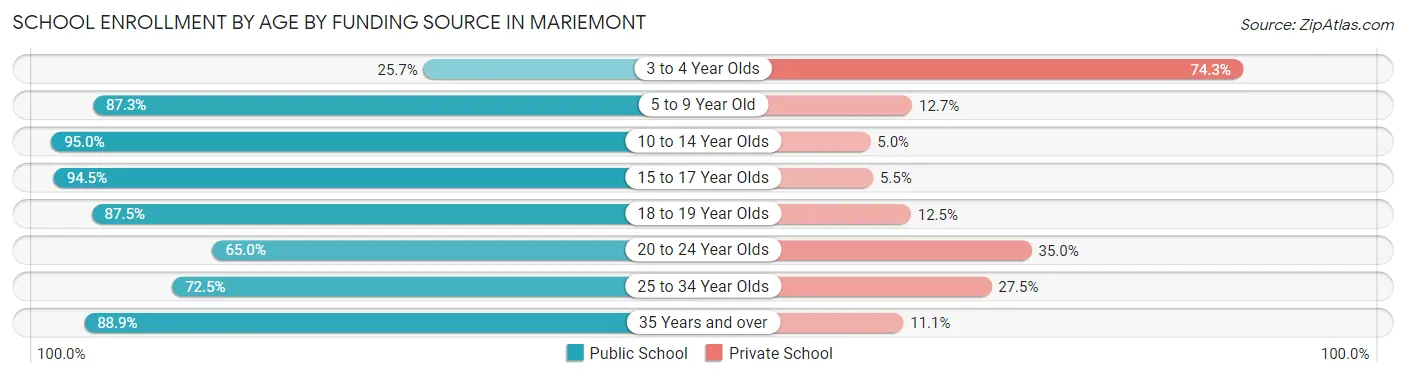
School Enrollment by Age by Funding Source in Mariemont
Out of a total of 1,071 students who are enrolled in schools in Mariemont, 180 (16.8%) attend a private institution, while the remaining 891 (83.2%) are enrolled in public schools. The age group of 3 to 4 year olds has the highest likelihood of being enrolled in private schools, with 81 (74.3% in the age bracket) enrolled. Conversely, the age group of 10 to 14 year olds has the lowest likelihood of being enrolled in a private school, with 287 (95.0% in the age bracket) attending a public institution.
| Age Bracket | Public School | Private School |
| 3 to 4 Year Olds | 28 (25.7%) | 81 (74.3%) |
| 5 to 9 Year Old | 137 (87.3%) | 20 (12.7%) |
| 10 to 14 Year Olds | 287 (95.0%) | 15 (5.0%) |
| 15 to 17 Year Olds | 225 (94.5%) | 13 (5.5%) |
| 18 to 19 Year Olds | 42 (87.5%) | 6 (12.5%) |
| 20 to 24 Year Olds | 39 (65.0%) | 21 (35.0%) |
| 25 to 34 Year Olds | 29 (72.5%) | 11 (27.5%) |
| 35 Years and over | 104 (88.9%) | 13 (11.1%) |
| Total | 891 (83.2%) | 180 (16.8%) |
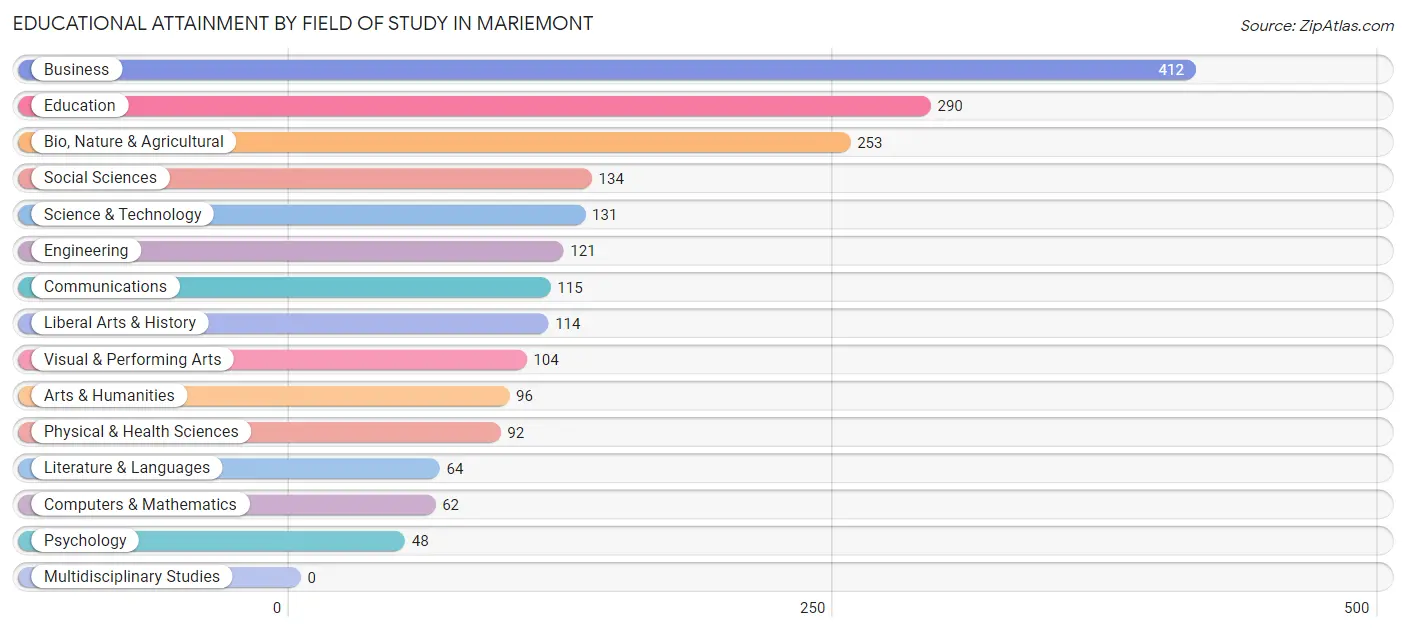
Educational Attainment by Field of Study in Mariemont
Business (412 | 20.2%), education (290 | 14.2%), bio, nature & agricultural (253 | 12.4%), social sciences (134 | 6.6%), and science & technology (131 | 6.4%) are the most common fields of study among 2,036 individuals in Mariemont who have obtained a bachelor's degree or higher.
| Field of Study | # Graduates | % Graduates |
| Computers & Mathematics | 62 | 3.0% |
| Bio, Nature & Agricultural | 253 | 12.4% |
| Physical & Health Sciences | 92 | 4.5% |
| Psychology | 48 | 2.4% |
| Social Sciences | 134 | 6.6% |
| Engineering | 121 | 5.9% |
| Multidisciplinary Studies | 0 | 0.0% |
| Science & Technology | 131 | 6.4% |
| Business | 412 | 20.2% |
| Education | 290 | 14.2% |
| Literature & Languages | 64 | 3.1% |
| Liberal Arts & History | 114 | 5.6% |
| Visual & Performing Arts | 104 | 5.1% |
| Communications | 115 | 5.7% |
| Arts & Humanities | 96 | 4.7% |
| Total | 2,036 | 100.0% |
Transportation & Commute in Mariemont
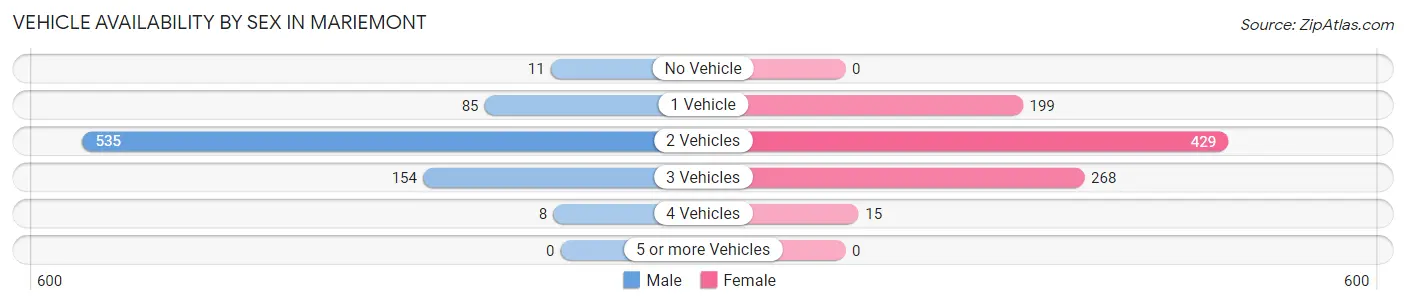
Vehicle Availability by Sex in Mariemont
The most prevalent vehicle ownership categories in Mariemont are males with 2 vehicles (535, accounting for 67.5%) and females with 2 vehicles (429, making up 58.7%).
| Vehicles Available | Male | Female |
| No Vehicle | 11 (1.4%) | 0 (0.0%) |
| 1 Vehicle | 85 (10.7%) | 199 (21.8%) |
| 2 Vehicles | 535 (67.5%) | 429 (47.1%) |
| 3 Vehicles | 154 (19.4%) | 268 (29.4%) |
| 4 Vehicles | 8 (1.0%) | 15 (1.7%) |
| 5 or more Vehicles | 0 (0.0%) | 0 (0.0%) |
| Total | 793 (100.0%) | 911 (100.0%) |
Commute Time in Mariemont
The most frequently occuring commute durations in Mariemont are 20 to 24 minutes (375 commuters, 27.0%), 15 to 19 minutes (295 commuters, 21.2%), and 10 to 14 minutes (166 commuters, 12.0%).
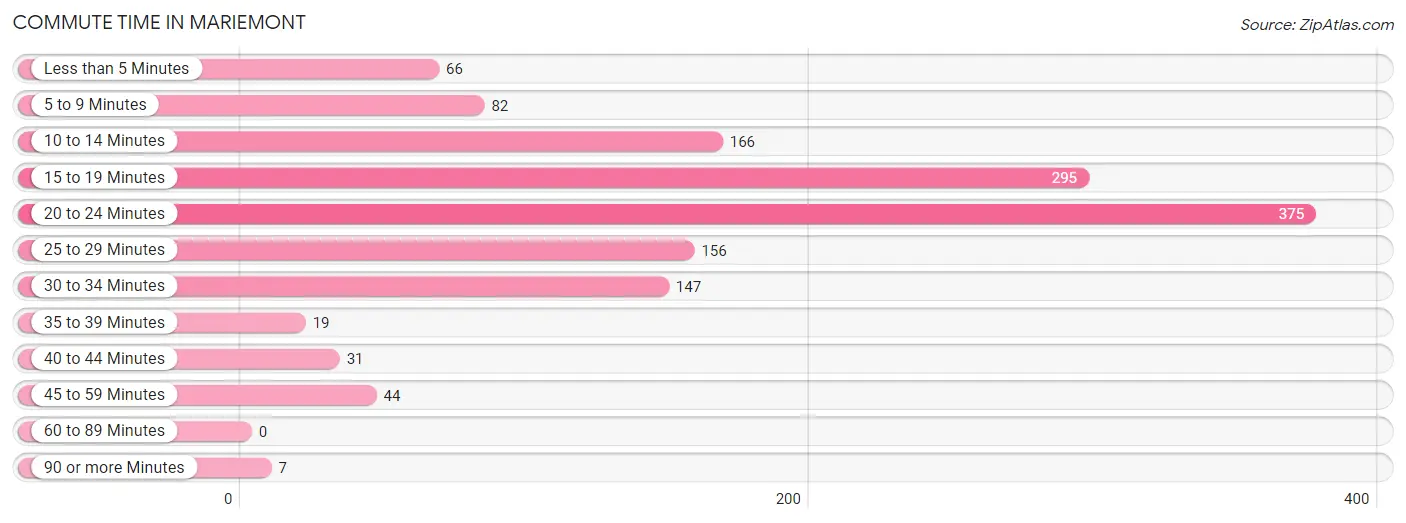
| Commute Time | # Commuters | % Commuters |
| Less than 5 Minutes | 66 | 4.8% |
| 5 to 9 Minutes | 82 | 5.9% |
| 10 to 14 Minutes | 166 | 12.0% |
| 15 to 19 Minutes | 295 | 21.2% |
| 20 to 24 Minutes | 375 | 27.0% |
| 25 to 29 Minutes | 156 | 11.2% |
| 30 to 34 Minutes | 147 | 10.6% |
| 35 to 39 Minutes | 19 | 1.4% |
| 40 to 44 Minutes | 31 | 2.2% |
| 45 to 59 Minutes | 44 | 3.2% |
| 60 to 89 Minutes | 0 | 0.0% |
| 90 or more Minutes | 7 | 0.5% |
Commute Time by Sex in Mariemont
The most common commute times in Mariemont are 20 to 24 minutes (169 commuters, 26.2%) for males and 20 to 24 minutes (206 commuters, 27.7%) for females.
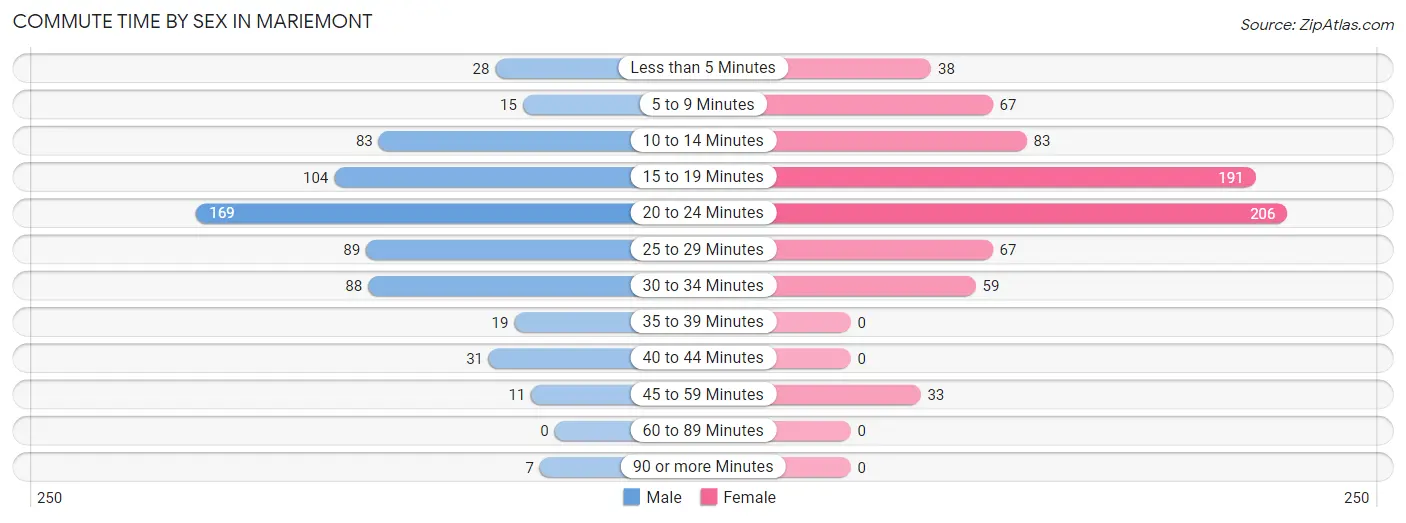
| Commute Time | Male | Female |
| Less than 5 Minutes | 28 (4.3%) | 38 (5.1%) |
| 5 to 9 Minutes | 15 (2.3%) | 67 (9.0%) |
| 10 to 14 Minutes | 83 (12.9%) | 83 (11.2%) |
| 15 to 19 Minutes | 104 (16.2%) | 191 (25.7%) |
| 20 to 24 Minutes | 169 (26.2%) | 206 (27.7%) |
| 25 to 29 Minutes | 89 (13.8%) | 67 (9.0%) |
| 30 to 34 Minutes | 88 (13.7%) | 59 (7.9%) |
| 35 to 39 Minutes | 19 (2.9%) | 0 (0.0%) |
| 40 to 44 Minutes | 31 (4.8%) | 0 (0.0%) |
| 45 to 59 Minutes | 11 (1.7%) | 33 (4.4%) |
| 60 to 89 Minutes | 0 (0.0%) | 0 (0.0%) |
| 90 or more Minutes | 7 (1.1%) | 0 (0.0%) |
Time of Departure to Work by Sex in Mariemont
The most frequent times of departure to work in Mariemont are 8:00 AM to 8:29 AM (191, 29.7%) for males and 7:00 AM to 7:29 AM (258, 34.7%) for females.
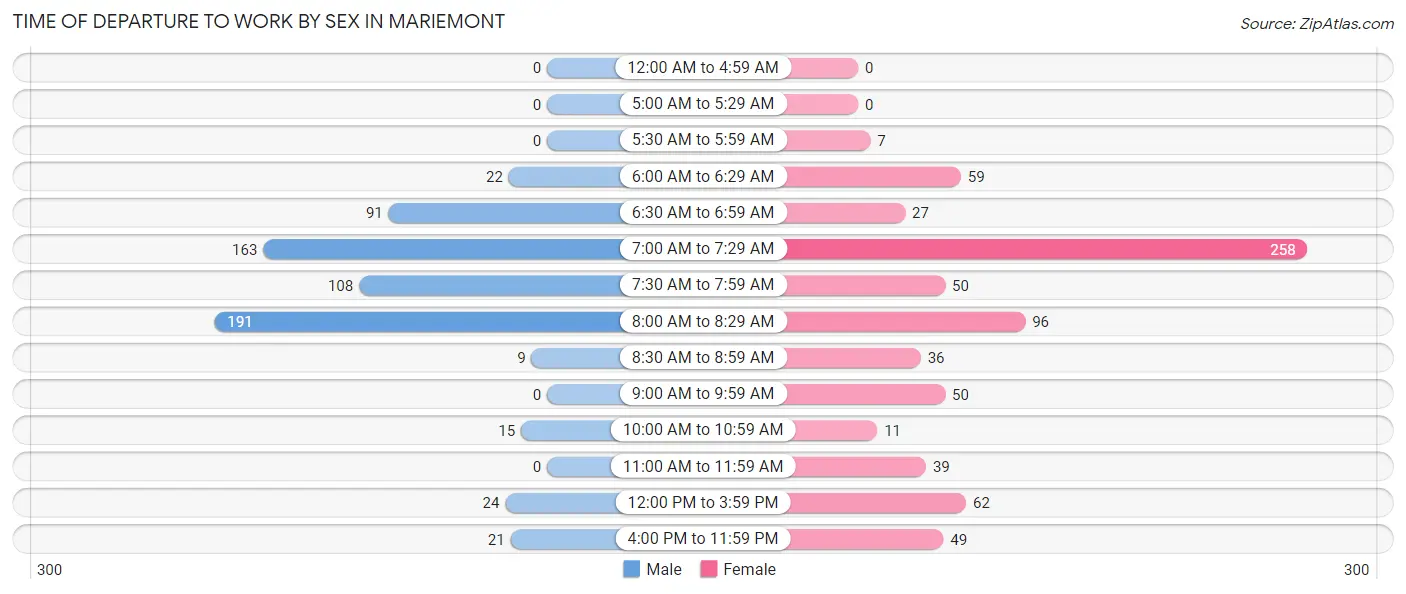
| Time of Departure | Male | Female |
| 12:00 AM to 4:59 AM | 0 (0.0%) | 0 (0.0%) |
| 5:00 AM to 5:29 AM | 0 (0.0%) | 0 (0.0%) |
| 5:30 AM to 5:59 AM | 0 (0.0%) | 7 (0.9%) |
| 6:00 AM to 6:29 AM | 22 (3.4%) | 59 (7.9%) |
| 6:30 AM to 6:59 AM | 91 (14.1%) | 27 (3.6%) |
| 7:00 AM to 7:29 AM | 163 (25.3%) | 258 (34.7%) |
| 7:30 AM to 7:59 AM | 108 (16.8%) | 50 (6.7%) |
| 8:00 AM to 8:29 AM | 191 (29.7%) | 96 (12.9%) |
| 8:30 AM to 8:59 AM | 9 (1.4%) | 36 (4.8%) |
| 9:00 AM to 9:59 AM | 0 (0.0%) | 50 (6.7%) |
| 10:00 AM to 10:59 AM | 15 (2.3%) | 11 (1.5%) |
| 11:00 AM to 11:59 AM | 0 (0.0%) | 39 (5.2%) |
| 12:00 PM to 3:59 PM | 24 (3.7%) | 62 (8.3%) |
| 4:00 PM to 11:59 PM | 21 (3.3%) | 49 (6.6%) |
| Total | 644 (100.0%) | 744 (100.0%) |
Housing Occupancy in Mariemont
Occupancy by Ownership in Mariemont
Of the total 1,410 dwellings in Mariemont, owner-occupied units account for 1,009 (71.6%), while renter-occupied units make up 401 (28.4%).
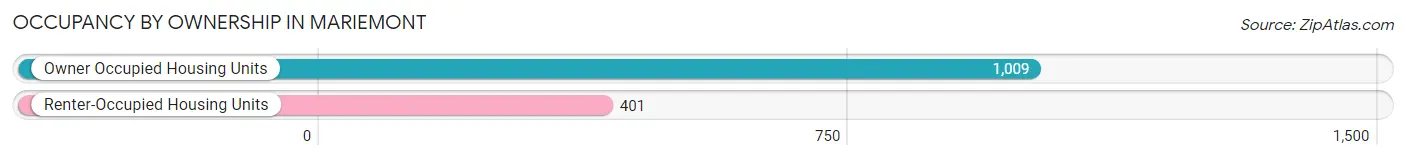
| Occupancy | # Housing Units | % Housing Units |
| Owner Occupied Housing Units | 1,009 | 71.6% |
| Renter-Occupied Housing Units | 401 | 28.4% |
| Total Occupied Housing Units | 1,410 | 100.0% |
Occupancy by Household Size in Mariemont
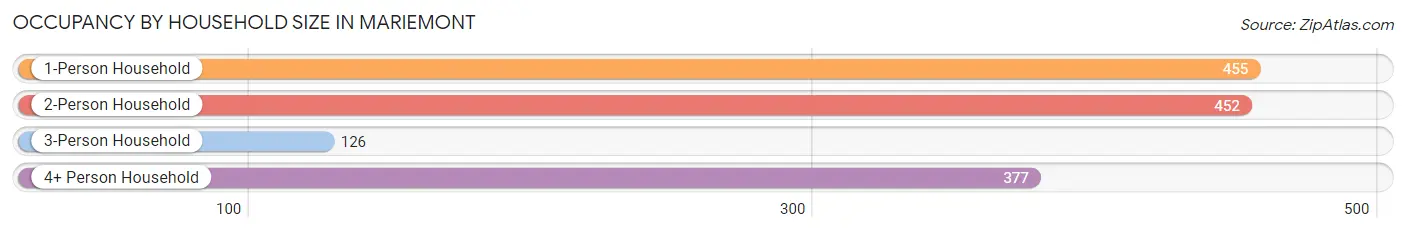
| Household Size | # Housing Units | % Housing Units |
| 1-Person Household | 455 | 32.3% |
| 2-Person Household | 452 | 32.1% |
| 3-Person Household | 126 | 8.9% |
| 4+ Person Household | 377 | 26.7% |
| Total Housing Units | 1,410 | 100.0% |
Occupancy by Ownership by Household Size in Mariemont
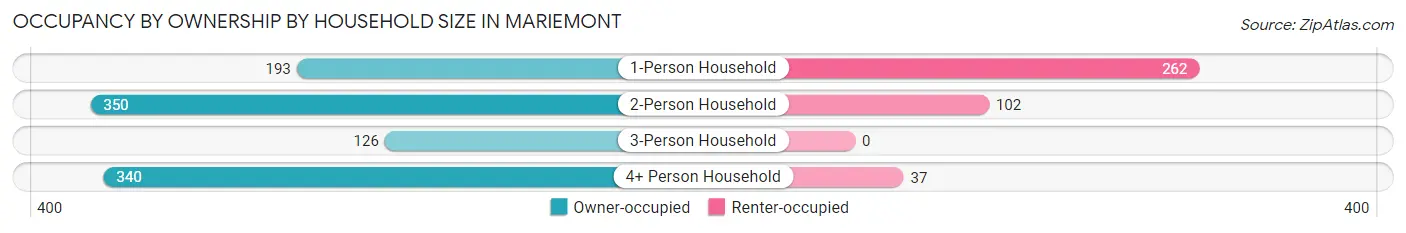
| Household Size | Owner-occupied | Renter-occupied |
| 1-Person Household | 193 (42.4%) | 262 (57.6%) |
| 2-Person Household | 350 (77.4%) | 102 (22.6%) |
| 3-Person Household | 126 (100.0%) | 0 (0.0%) |
| 4+ Person Household | 340 (90.2%) | 37 (9.8%) |
| Total Housing Units | 1,009 (71.6%) | 401 (28.4%) |
Occupancy by Educational Attainment in Mariemont
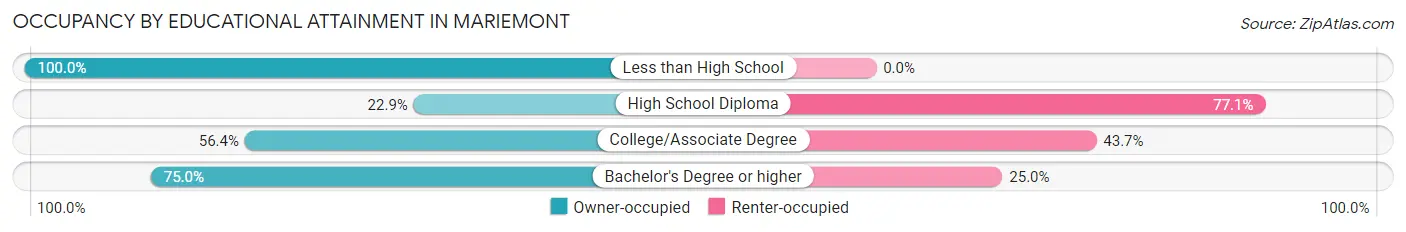
| Household Size | Owner-occupied | Renter-occupied |
| Less than High School | 15 (100.0%) | 0 (0.0%) |
| High School Diploma | 8 (22.9%) | 27 (77.1%) |
| College/Associate Degree | 102 (56.4%) | 79 (43.6%) |
| Bachelor's Degree or higher | 884 (75.0%) | 295 (25.0%) |
Occupancy by Age of Householder in Mariemont
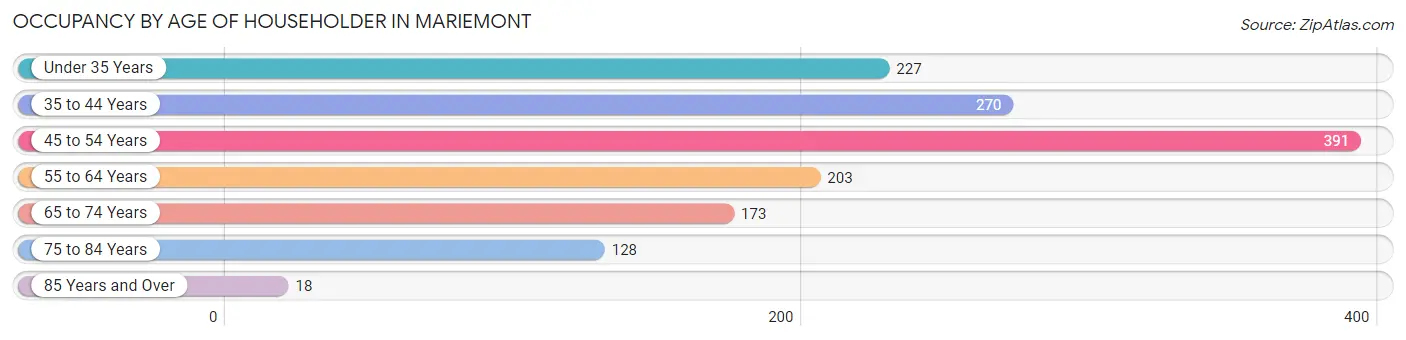
| Age Bracket | # Households | % Households |
| Under 35 Years | 227 | 16.1% |
| 35 to 44 Years | 270 | 19.2% |
| 45 to 54 Years | 391 | 27.7% |
| 55 to 64 Years | 203 | 14.4% |
| 65 to 74 Years | 173 | 12.3% |
| 75 to 84 Years | 128 | 9.1% |
| 85 Years and Over | 18 | 1.3% |
| Total | 1,410 | 100.0% |
Housing Finances in Mariemont
Median Income by Occupancy in Mariemont
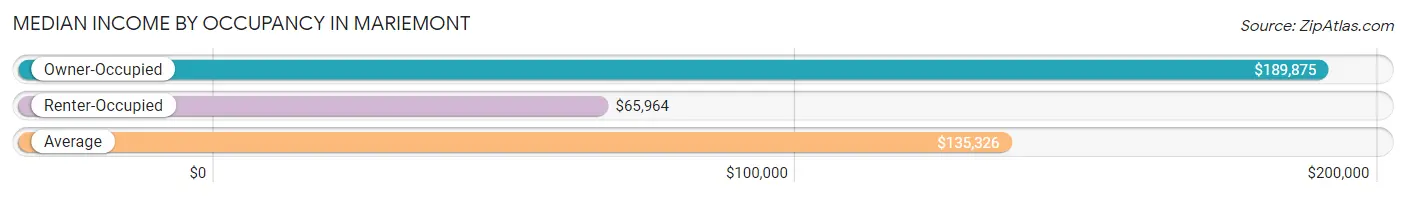
| Occupancy Type | # Households | Median Income |
| Owner-Occupied | 1,009 (71.6%) | $189,875 |
| Renter-Occupied | 401 (28.4%) | $65,964 |
| Average | 1,410 (100.0%) | $135,326 |
Occupancy by Householder Income Bracket in Mariemont
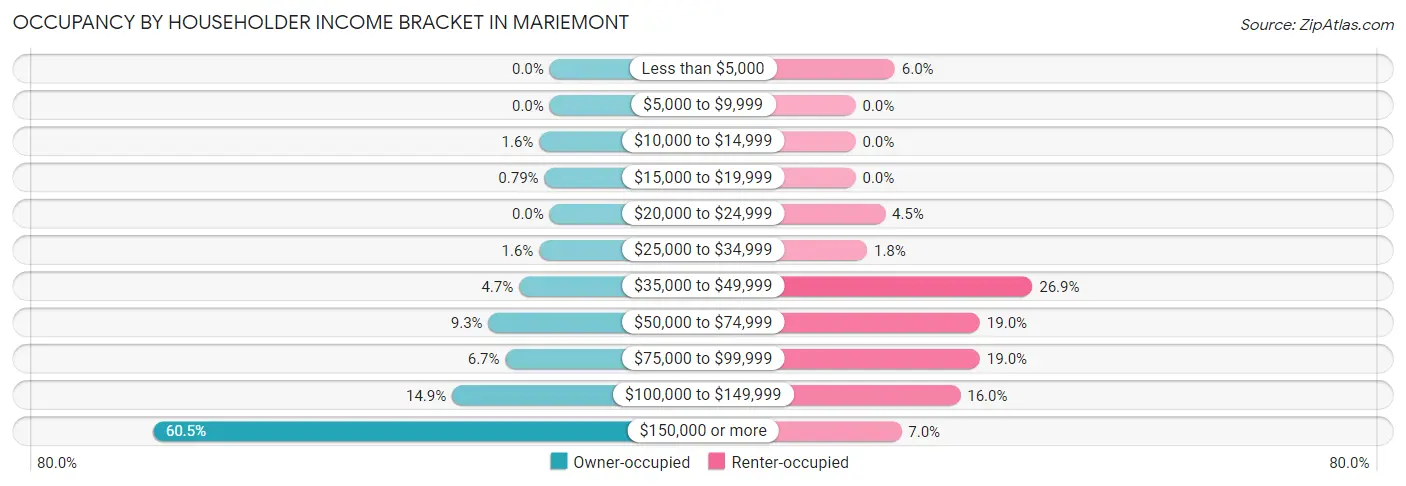
| Income Bracket | Owner-occupied | Renter-occupied |
| Less than $5,000 | 0 (0.0%) | 24 (6.0%) |
| $5,000 to $9,999 | 0 (0.0%) | 0 (0.0%) |
| $10,000 to $14,999 | 16 (1.6%) | 0 (0.0%) |
| $15,000 to $19,999 | 8 (0.8%) | 0 (0.0%) |
| $20,000 to $24,999 | 0 (0.0%) | 18 (4.5%) |
| $25,000 to $34,999 | 16 (1.6%) | 7 (1.8%) |
| $35,000 to $49,999 | 47 (4.7%) | 108 (26.9%) |
| $50,000 to $74,999 | 94 (9.3%) | 76 (19.0%) |
| $75,000 to $99,999 | 68 (6.7%) | 76 (19.0%) |
| $100,000 to $149,999 | 150 (14.9%) | 64 (16.0%) |
| $150,000 or more | 610 (60.5%) | 28 (7.0%) |
| Total | 1,009 (100.0%) | 401 (100.0%) |
Monthly Housing Cost Tiers in Mariemont
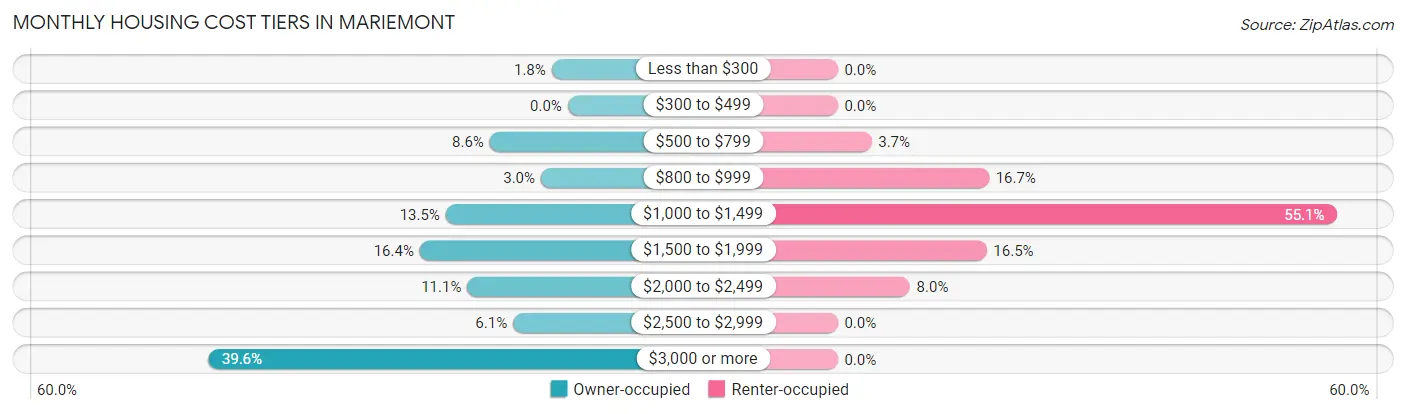
| Monthly Cost | Owner-occupied | Renter-occupied |
| Less than $300 | 18 (1.8%) | 0 (0.0%) |
| $300 to $499 | 0 (0.0%) | 0 (0.0%) |
| $500 to $799 | 87 (8.6%) | 15 (3.7%) |
| $800 to $999 | 30 (3.0%) | 67 (16.7%) |
| $1,000 to $1,499 | 136 (13.5%) | 221 (55.1%) |
| $1,500 to $1,999 | 165 (16.4%) | 66 (16.5%) |
| $2,000 to $2,499 | 112 (11.1%) | 32 (8.0%) |
| $2,500 to $2,999 | 61 (6.0%) | 0 (0.0%) |
| $3,000 or more | 400 (39.6%) | 0 (0.0%) |
| Total | 1,009 (100.0%) | 401 (100.0%) |
Physical Housing Characteristics in Mariemont
Housing Structures in Mariemont
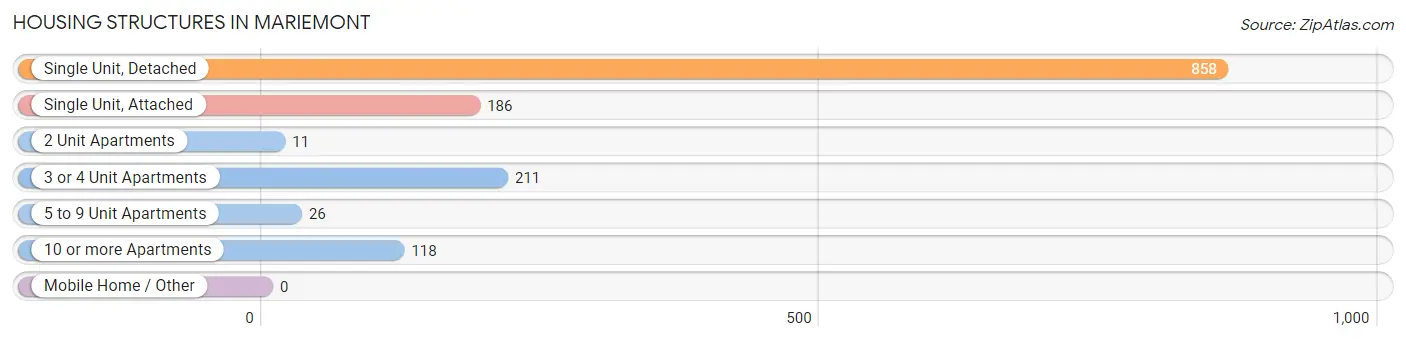
| Structure Type | # Housing Units | % Housing Units |
| Single Unit, Detached | 858 | 60.9% |
| Single Unit, Attached | 186 | 13.2% |
| 2 Unit Apartments | 11 | 0.8% |
| 3 or 4 Unit Apartments | 211 | 15.0% |
| 5 to 9 Unit Apartments | 26 | 1.8% |
| 10 or more Apartments | 118 | 8.4% |
| Mobile Home / Other | 0 | 0.0% |
| Total | 1,410 | 100.0% |
Housing Structures by Occupancy in Mariemont
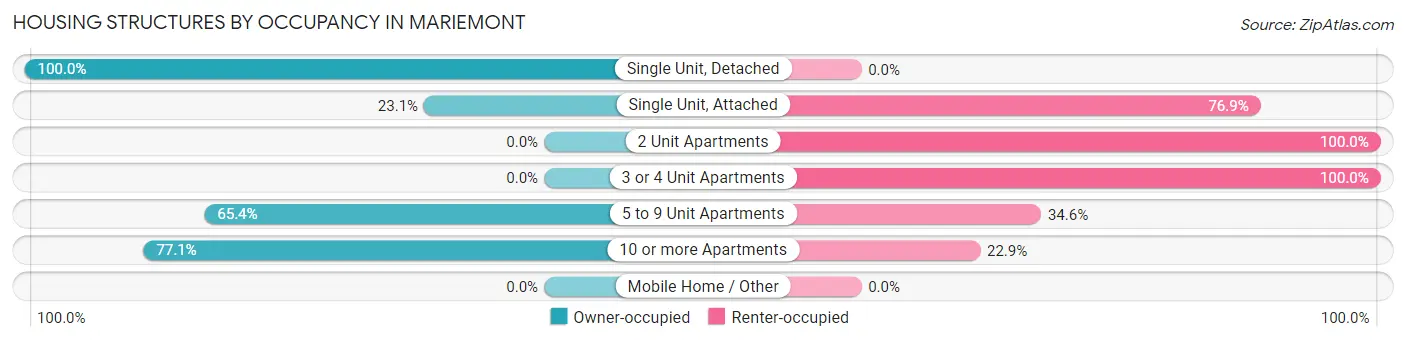
| Structure Type | Owner-occupied | Renter-occupied |
| Single Unit, Detached | 858 (100.0%) | 0 (0.0%) |
| Single Unit, Attached | 43 (23.1%) | 143 (76.9%) |
| 2 Unit Apartments | 0 (0.0%) | 11 (100.0%) |
| 3 or 4 Unit Apartments | 0 (0.0%) | 211 (100.0%) |
| 5 to 9 Unit Apartments | 17 (65.4%) | 9 (34.6%) |
| 10 or more Apartments | 91 (77.1%) | 27 (22.9%) |
| Mobile Home / Other | 0 (0.0%) | 0 (0.0%) |
| Total | 1,009 (71.6%) | 401 (28.4%) |
Housing Structures by Number of Rooms in Mariemont
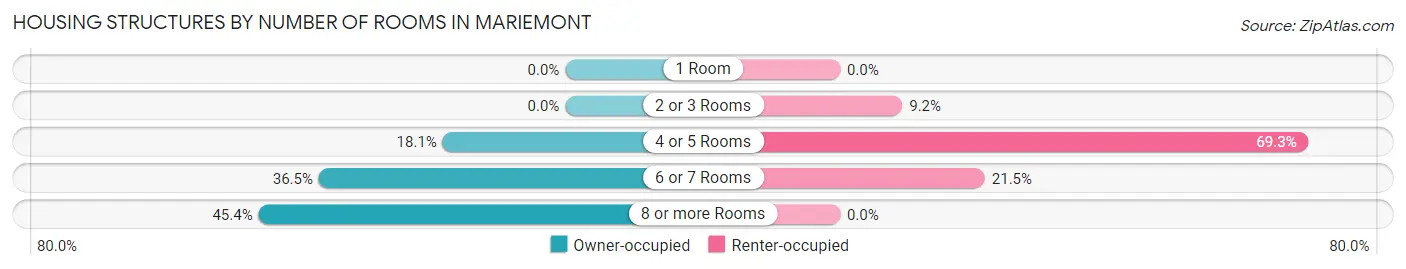
| Number of Rooms | Owner-occupied | Renter-occupied |
| 1 Room | 0 (0.0%) | 0 (0.0%) |
| 2 or 3 Rooms | 0 (0.0%) | 37 (9.2%) |
| 4 or 5 Rooms | 183 (18.1%) | 278 (69.3%) |
| 6 or 7 Rooms | 368 (36.5%) | 86 (21.4%) |
| 8 or more Rooms | 458 (45.4%) | 0 (0.0%) |
| Total | 1,009 (100.0%) | 401 (100.0%) |
Housing Structure by Heating Type in Mariemont
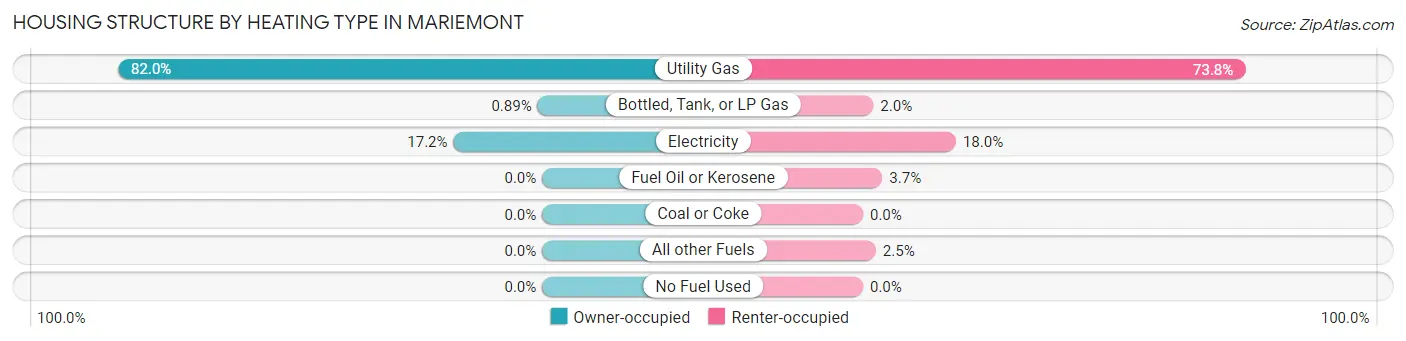
| Heating Type | Owner-occupied | Renter-occupied |
| Utility Gas | 827 (82.0%) | 296 (73.8%) |
| Bottled, Tank, or LP Gas | 9 (0.9%) | 8 (2.0%) |
| Electricity | 173 (17.2%) | 72 (18.0%) |
| Fuel Oil or Kerosene | 0 (0.0%) | 15 (3.7%) |
| Coal or Coke | 0 (0.0%) | 0 (0.0%) |
| All other Fuels | 0 (0.0%) | 10 (2.5%) |
| No Fuel Used | 0 (0.0%) | 0 (0.0%) |
| Total | 1,009 (100.0%) | 401 (100.0%) |
Household Vehicle Usage in Mariemont
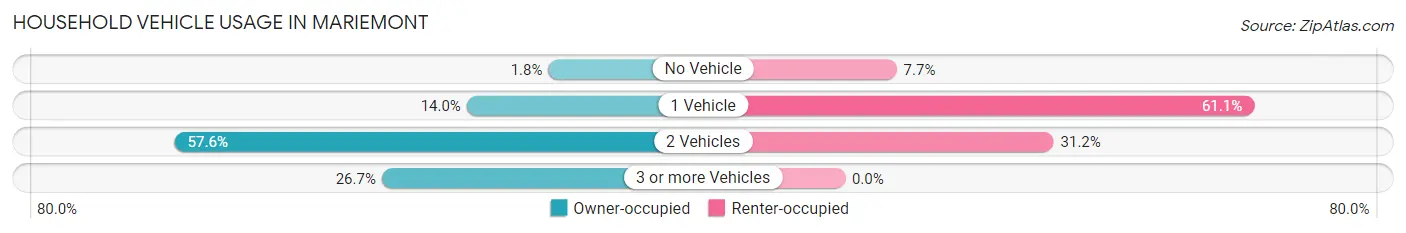
| Vehicles per Household | Owner-occupied | Renter-occupied |
| No Vehicle | 18 (1.8%) | 31 (7.7%) |
| 1 Vehicle | 141 (14.0%) | 245 (61.1%) |
| 2 Vehicles | 581 (57.6%) | 125 (31.2%) |
| 3 or more Vehicles | 269 (26.7%) | 0 (0.0%) |
| Total | 1,009 (100.0%) | 401 (100.0%) |
Real Estate & Mortgages in Mariemont
Real Estate and Mortgage Overview in Mariemont
| Characteristic | Without Mortgage | With Mortgage |
| Housing Units | 328 | 681 |
| Median Property Value | $440,500 | $524,000 |
| Median Household Income | $117,143 | $464 |
| Monthly Housing Costs | $1,192 | $400 |
| Real Estate Taxes | $9,955 | $0 |
Property Value by Mortgage Status in Mariemont
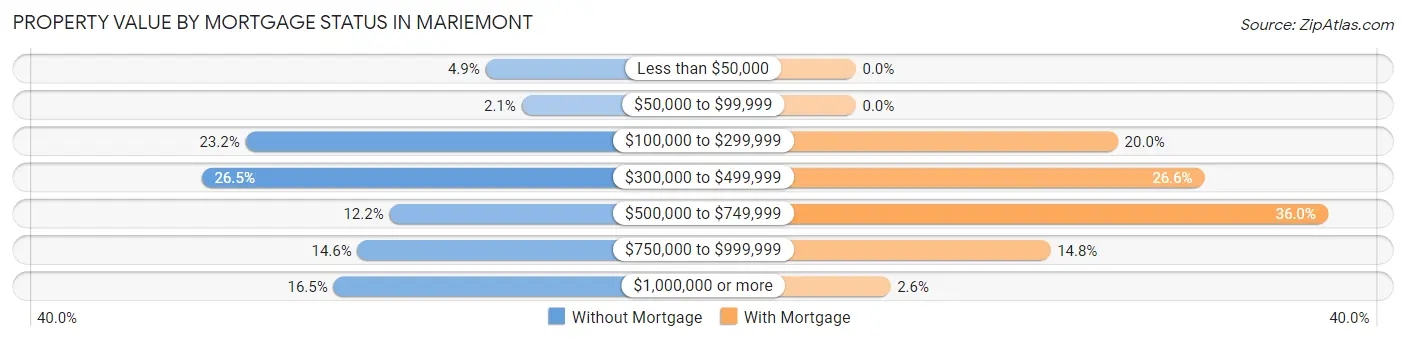
| Property Value | Without Mortgage | With Mortgage |
| Less than $50,000 | 16 (4.9%) | 0 (0.0%) |
| $50,000 to $99,999 | 7 (2.1%) | 0 (0.0%) |
| $100,000 to $299,999 | 76 (23.2%) | 136 (20.0%) |
| $300,000 to $499,999 | 87 (26.5%) | 181 (26.6%) |
| $500,000 to $749,999 | 40 (12.2%) | 245 (36.0%) |
| $750,000 to $999,999 | 48 (14.6%) | 101 (14.8%) |
| $1,000,000 or more | 54 (16.5%) | 18 (2.6%) |
| Total | 328 (100.0%) | 681 (100.0%) |
Household Income by Mortgage Status in Mariemont
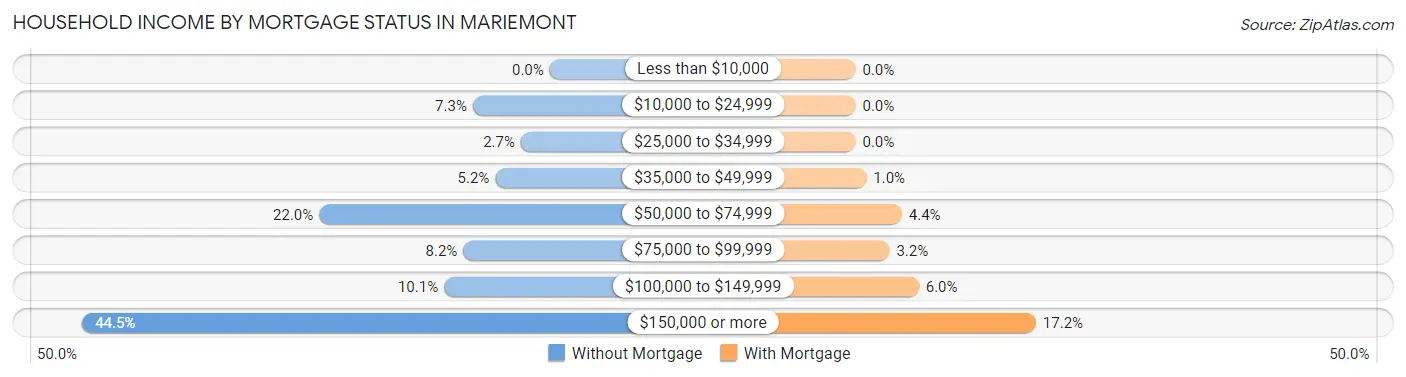
| Household Income | Without Mortgage | With Mortgage |
| Less than $10,000 | 0 (0.0%) | 0 (0.0%) |
| $10,000 to $24,999 | 24 (7.3%) | 0 (0.0%) |
| $25,000 to $34,999 | 9 (2.7%) | 0 (0.0%) |
| $35,000 to $49,999 | 17 (5.2%) | 7 (1.0%) |
| $50,000 to $74,999 | 72 (22.0%) | 30 (4.4%) |
| $75,000 to $99,999 | 27 (8.2%) | 22 (3.2%) |
| $100,000 to $149,999 | 33 (10.1%) | 41 (6.0%) |
| $150,000 or more | 146 (44.5%) | 117 (17.2%) |
| Total | 328 (100.0%) | 681 (100.0%) |
Property Value to Household Income Ratio in Mariemont
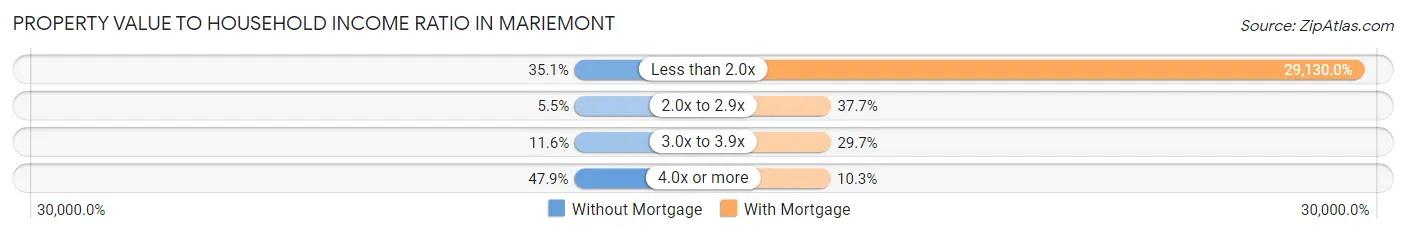
| Value-to-Income Ratio | Without Mortgage | With Mortgage |
| Less than 2.0x | 115 (35.1%) | 198,375 (29,130.0%) |
| 2.0x to 2.9x | 18 (5.5%) | 257 (37.7%) |
| 3.0x to 3.9x | 38 (11.6%) | 202 (29.7%) |
| 4.0x or more | 157 (47.9%) | 70 (10.3%) |
| Total | 328 (100.0%) | 681 (100.0%) |
Real Estate Taxes by Mortgage Status in Mariemont
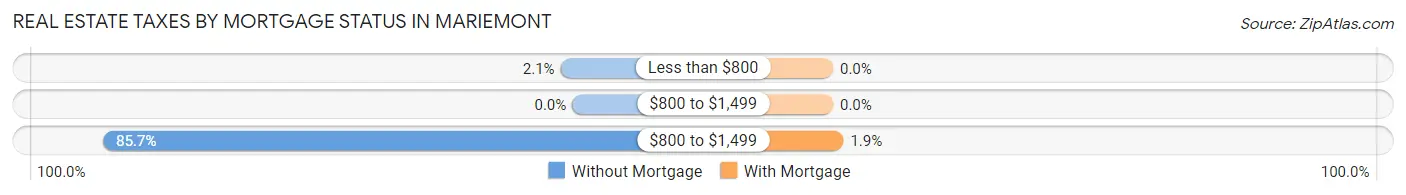
| Property Taxes | Without Mortgage | With Mortgage |
| Less than $800 | 7 (2.1%) | 0 (0.0%) |
| $800 to $1,499 | 0 (0.0%) | 0 (0.0%) |
| $800 to $1,499 | 281 (85.7%) | 13 (1.9%) |
| Total | 328 (100.0%) | 681 (100.0%) |
Health & Disability in Mariemont
Health Insurance Coverage by Age in Mariemont
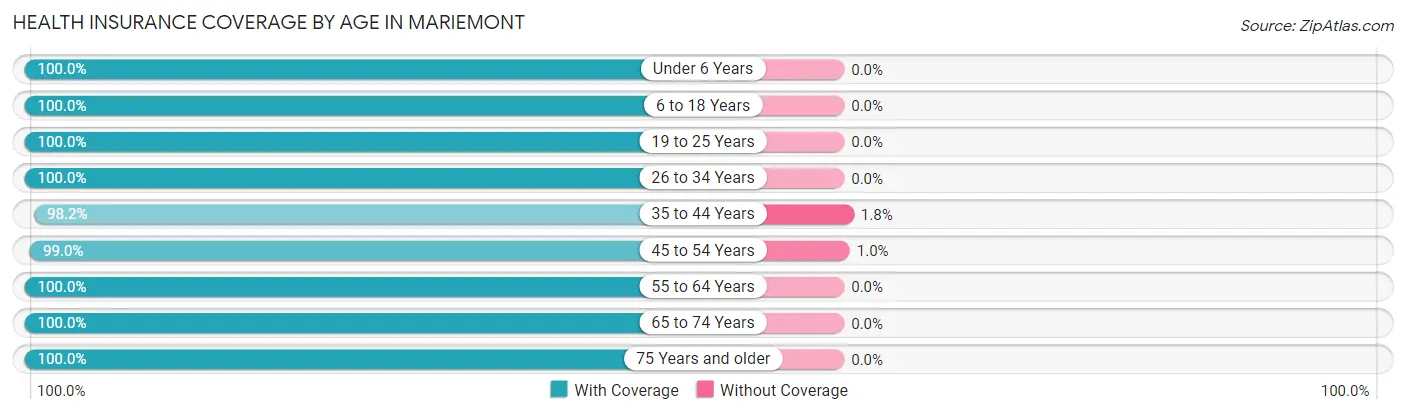
| Age Bracket | With Coverage | Without Coverage |
| Under 6 Years | 296 (100.0%) | 0 (0.0%) |
| 6 to 18 Years | 760 (100.0%) | 0 (0.0%) |
| 19 to 25 Years | 89 (100.0%) | 0 (0.0%) |
| 26 to 34 Years | 417 (100.0%) | 0 (0.0%) |
| 35 to 44 Years | 495 (98.2%) | 9 (1.8%) |
| 45 to 54 Years | 579 (99.0%) | 6 (1.0%) |
| 55 to 64 Years | 327 (100.0%) | 0 (0.0%) |
| 65 to 74 Years | 258 (100.0%) | 0 (0.0%) |
| 75 Years and older | 210 (100.0%) | 0 (0.0%) |
| Total | 3,431 (99.6%) | 15 (0.4%) |
Health Insurance Coverage by Citizenship Status in Mariemont
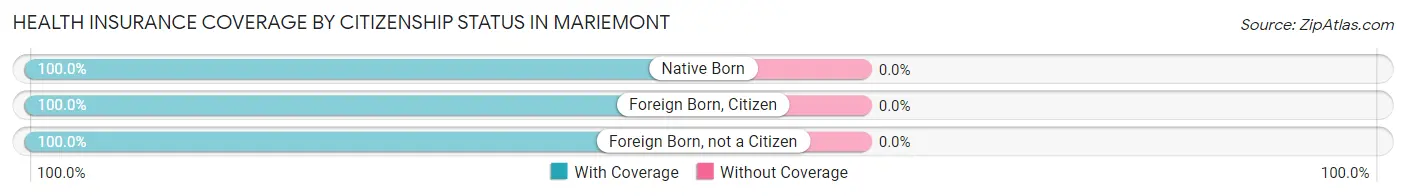
| Citizenship Status | With Coverage | Without Coverage |
| Native Born | 296 (100.0%) | 0 (0.0%) |
| Foreign Born, Citizen | 760 (100.0%) | 0 (0.0%) |
| Foreign Born, not a Citizen | 89 (100.0%) | 0 (0.0%) |
Health Insurance Coverage by Household Income in Mariemont
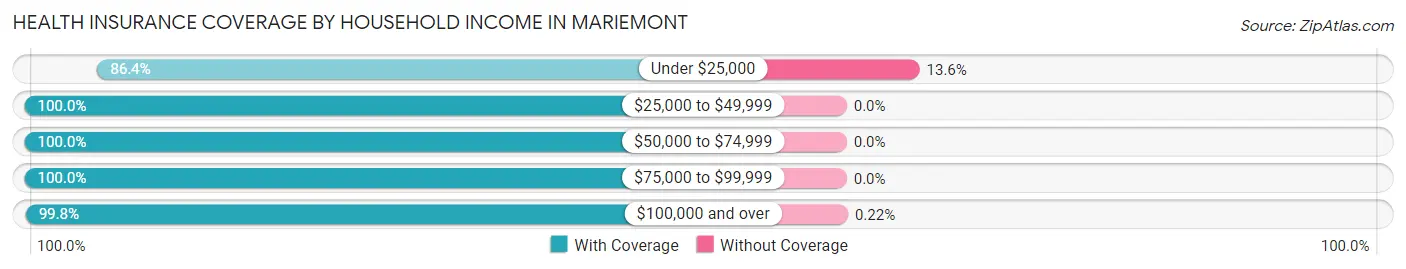
| Household Income | With Coverage | Without Coverage |
| Under $25,000 | 57 (86.4%) | 9 (13.6%) |
| $25,000 to $49,999 | 203 (100.0%) | 0 (0.0%) |
| $50,000 to $74,999 | 241 (100.0%) | 0 (0.0%) |
| $75,000 to $99,999 | 259 (100.0%) | 0 (0.0%) |
| $100,000 and over | 2,671 (99.8%) | 6 (0.2%) |
Public vs Private Health Insurance Coverage by Age in Mariemont
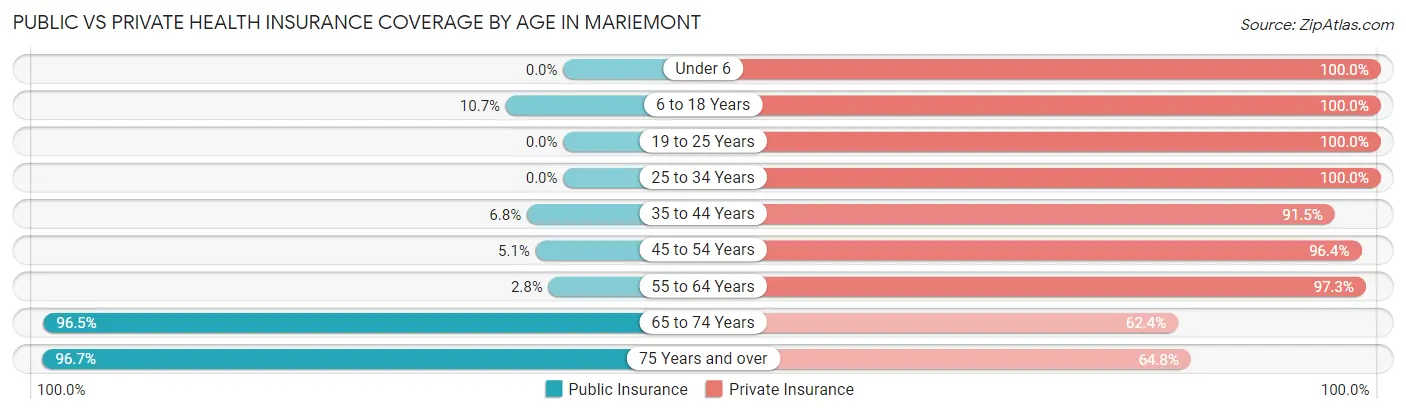
| Age Bracket | Public Insurance | Private Insurance |
| Under 6 | 0 (0.0%) | 296 (100.0%) |
| 6 to 18 Years | 81 (10.7%) | 760 (100.0%) |
| 19 to 25 Years | 0 (0.0%) | 89 (100.0%) |
| 25 to 34 Years | 0 (0.0%) | 417 (100.0%) |
| 35 to 44 Years | 34 (6.8%) | 461 (91.5%) |
| 45 to 54 Years | 30 (5.1%) | 564 (96.4%) |
| 55 to 64 Years | 9 (2.8%) | 318 (97.3%) |
| 65 to 74 Years | 249 (96.5%) | 161 (62.4%) |
| 75 Years and over | 203 (96.7%) | 136 (64.8%) |
| Total | 606 (17.6%) | 3,202 (92.9%) |
Disability Status by Sex by Age in Mariemont
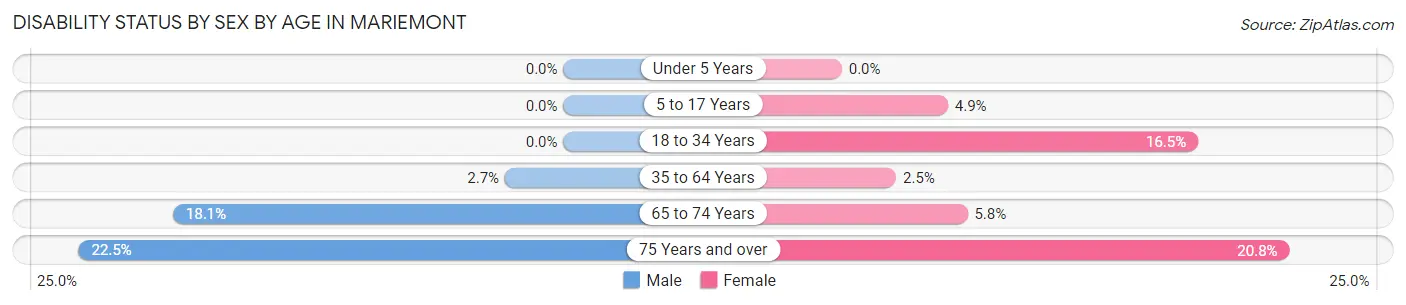
| Age Bracket | Male | Female |
| Under 5 Years | 0 (0.0%) | 0 (0.0%) |
| 5 to 17 Years | 0 (0.0%) | 13 (4.9%) |
| 18 to 34 Years | 0 (0.0%) | 62 (16.5%) |
| 35 to 64 Years | 19 (2.7%) | 18 (2.5%) |
| 65 to 74 Years | 25 (18.1%) | 7 (5.8%) |
| 75 Years and over | 18 (22.5%) | 27 (20.8%) |
Disability Class by Sex by Age in Mariemont
Disability Class: Hearing Difficulty
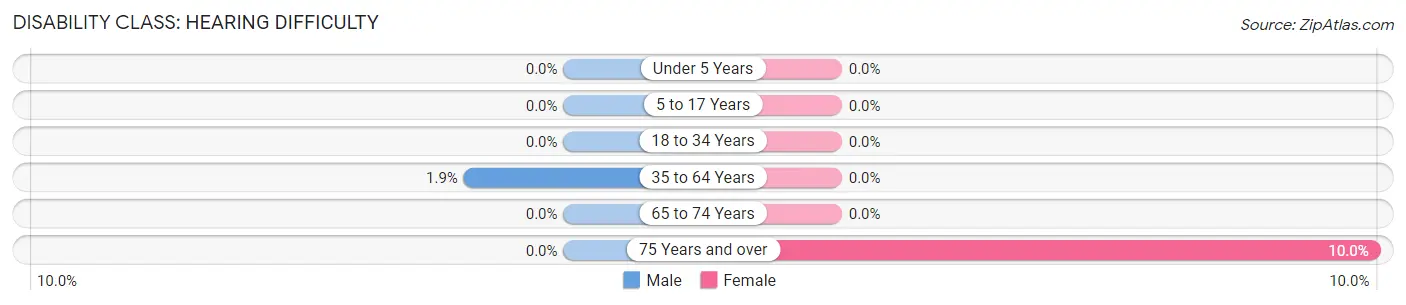
| Age Bracket | Male | Female |
| Under 5 Years | 0 (0.0%) | 0 (0.0%) |
| 5 to 17 Years | 0 (0.0%) | 0 (0.0%) |
| 18 to 34 Years | 0 (0.0%) | 0 (0.0%) |
| 35 to 64 Years | 13 (1.8%) | 0 (0.0%) |
| 65 to 74 Years | 0 (0.0%) | 0 (0.0%) |
| 75 Years and over | 0 (0.0%) | 13 (10.0%) |
Disability Class: Vision Difficulty
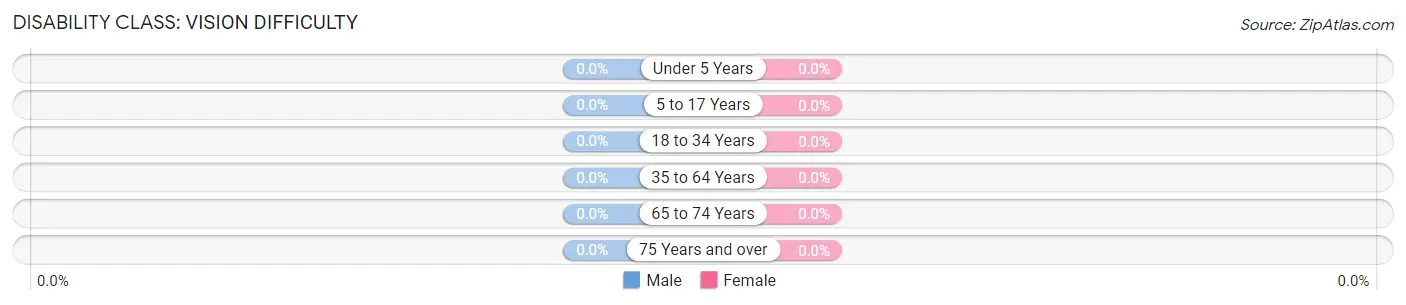
| Age Bracket | Male | Female |
| Under 5 Years | 0 (0.0%) | 0 (0.0%) |
| 5 to 17 Years | 0 (0.0%) | 0 (0.0%) |
| 18 to 34 Years | 0 (0.0%) | 0 (0.0%) |
| 35 to 64 Years | 0 (0.0%) | 0 (0.0%) |
| 65 to 74 Years | 0 (0.0%) | 0 (0.0%) |
| 75 Years and over | 0 (0.0%) | 0 (0.0%) |
Disability Class: Cognitive Difficulty
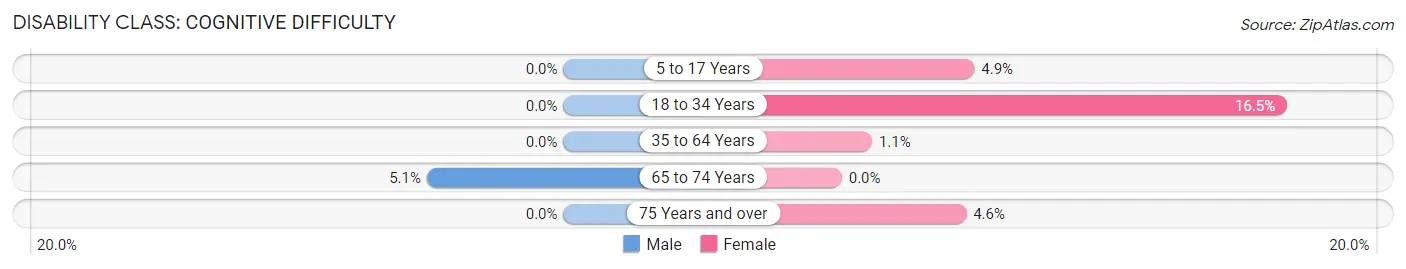
| Age Bracket | Male | Female |
| 5 to 17 Years | 0 (0.0%) | 13 (4.9%) |
| 18 to 34 Years | 0 (0.0%) | 62 (16.5%) |
| 35 to 64 Years | 0 (0.0%) | 8 (1.1%) |
| 65 to 74 Years | 7 (5.1%) | 0 (0.0%) |
| 75 Years and over | 0 (0.0%) | 6 (4.6%) |
Disability Class: Ambulatory Difficulty
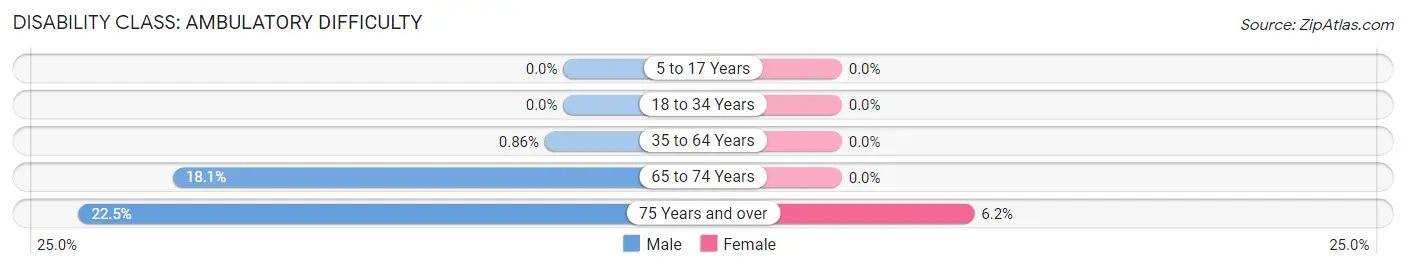
| Age Bracket | Male | Female |
| 5 to 17 Years | 0 (0.0%) | 0 (0.0%) |
| 18 to 34 Years | 0 (0.0%) | 0 (0.0%) |
| 35 to 64 Years | 6 (0.9%) | 0 (0.0%) |
| 65 to 74 Years | 25 (18.1%) | 0 (0.0%) |
| 75 Years and over | 18 (22.5%) | 8 (6.1%) |
Disability Class: Self-Care Difficulty
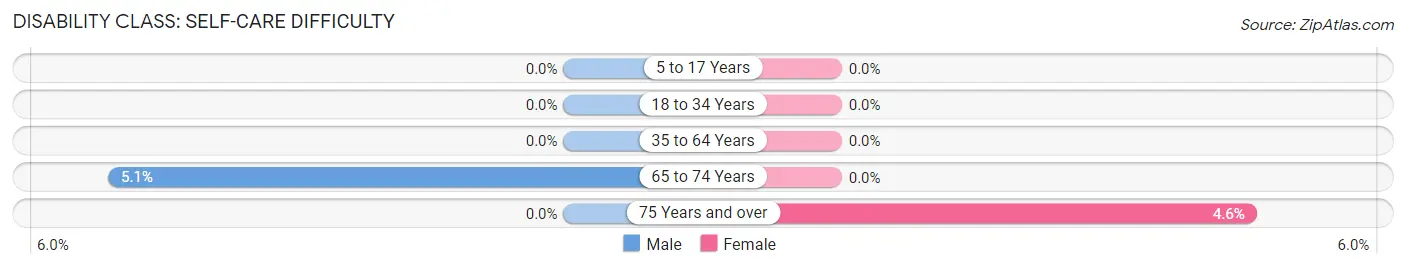
| Age Bracket | Male | Female |
| 5 to 17 Years | 0 (0.0%) | 0 (0.0%) |
| 18 to 34 Years | 0 (0.0%) | 0 (0.0%) |
| 35 to 64 Years | 0 (0.0%) | 0 (0.0%) |
| 65 to 74 Years | 7 (5.1%) | 0 (0.0%) |
| 75 Years and over | 0 (0.0%) | 6 (4.6%) |
Technology Access in Mariemont
Computing Device Access in Mariemont
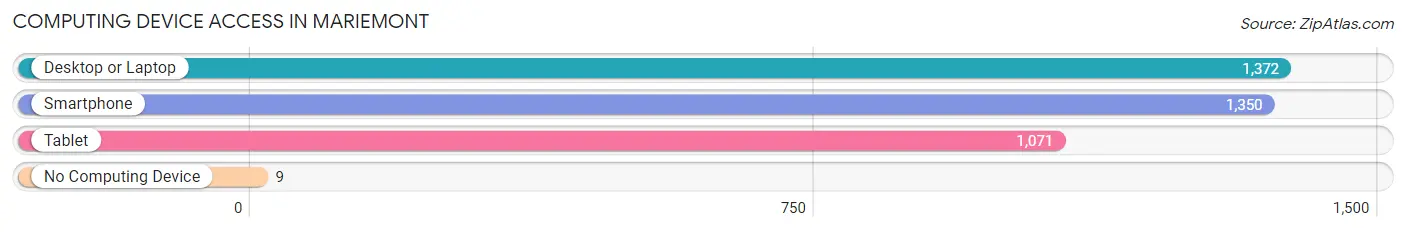
| Device Type | # Households | % Households |
| Desktop or Laptop | 1,372 | 97.3% |
| Smartphone | 1,350 | 95.7% |
| Tablet | 1,071 | 76.0% |
| No Computing Device | 9 | 0.6% |
| Total | 1,410 | 100.0% |
Internet Access in Mariemont
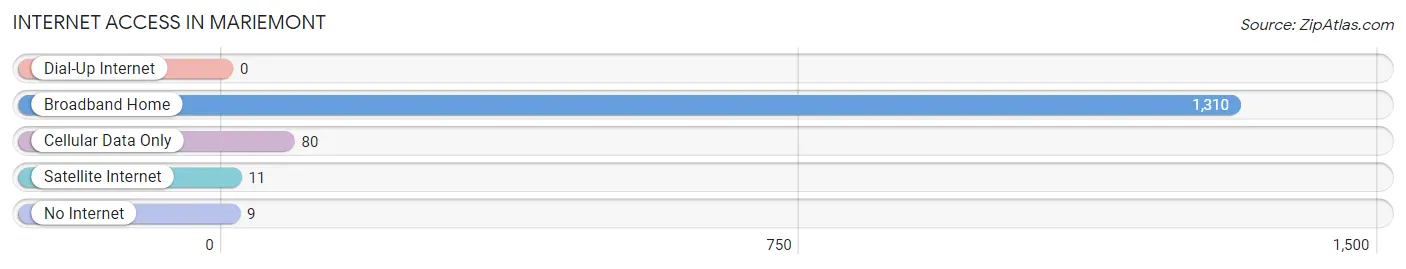
| Internet Type | # Households | % Households |
| Dial-Up Internet | 0 | 0.0% |
| Broadband Home | 1,310 | 92.9% |
| Cellular Data Only | 80 | 5.7% |
| Satellite Internet | 11 | 0.8% |
| No Internet | 9 | 0.6% |
| Total | 1,410 | 100.0% |
Mariemont Summary
Mariemont is a village located in Hamilton County, Ohio, United States. It is a suburb of Cincinnati and is part of the Cincinnati Metropolitan Statistical Area. The population was 2,097 at the 2010 census.
History
Mariemont was founded in 1923 by Mary Emery, a wealthy philanthropist from Cincinnati. Emery wanted to create a model community that would be a refuge from the hustle and bustle of the city. She purchased 1,000 acres of land and hired the Olmsted Brothers, a landscape architecture firm, to design the village. The village was designed to be a self-contained community with its own schools, churches, parks, and businesses.
The village was named after Emery's daughter, Marie. The name was later changed to Mariemont to avoid confusion with the nearby city of Marysville.
Geography
Mariemont is located at 39 10 25 North 84 25 45 West 39 173611 84 429167
According to the United States Census Bureau, the village has a total area of 1.2 square miles (3.1 km2), all land.
Economy
Mariemont is a primarily residential community, with most of its residents commuting to nearby Cincinnati for work. The village does have a few small businesses, including a grocery store, a hardware store, and a few restaurants.
Demographics
As of the census of 2010, there were 2,097 people, 845 households, and 602 families residing in the village. The population density was 1,744.2 people per square mile (672.7/km2). There were 890 housing units at an average density of 741.7 per square mile (286.3/km2). The racial makeup of the village was 95.2% White, 1.2% African American, 0.2% Native American, 1.7% Asian, 0.1% Pacific Islander, 0.4% from other races, and 1.2% from two or more races. Hispanic or Latino of any race were 1.7% of the population.
There were 845 households, out of which 33.2% had children under the age of 18 living with them, 59.2% were married couples living together, 8.2% had a female householder with no husband present, and 29.3% were non-families. 24.7% of all households were made up of individuals, and 10.2% had someone living alone who was 65 years of age or older. The average household size was 2.48 and the average family size was 2.99.
In the village, the population was spread out, with 25.2% under the age of 18, 4.2% from 18 to 24, 28.2% from 25 to 44, 28.2% from 45 to 64, and 14.2% who were 65 years of age or older. The median age was 40 years. For every 100 females, there were 92.2 males. For every 100 females age 18 and over, there were 88.2 males.
The median income for a household in the village was $76,944, and the median income for a family was $90,938. Males had a median income of $60,000 versus $41,250 for females. The per capita income for the village was $37,945. About 1.7% of families and 2.7% of the population were below the poverty line, including 2.2% of those under age 18 and 4.2% of those age 65 or over.
Common Questions
What is the Total Population of Mariemont?
Total Population of Mariemont is 3,493.
What is the Total Male Population of Mariemont?
Total Male Population of Mariemont is 1,745.
What is the Total Female Population of Mariemont?
Total Female Population of Mariemont is 1,748.
What is the Ratio of Males per 100 Females in Mariemont?
There are 99.83 Males per 100 Females in Mariemont.
What is the Ratio of Females per 100 Males in Mariemont?
There are 100.17 Females per 100 Males in Mariemont.
What is the Median Population Age in Mariemont?
Median Population Age in Mariemont is 37.8 Years.
What is the Average Family Size in Mariemont
Average Family Size in Mariemont is 3.2 People.
What is the Average Household Size in Mariemont
Average Household Size in Mariemont is 2.4 People.
What is Per Capita Income in Mariemont?
Per Capita income in Mariemont is $77,053.
What is the Median Family Income in Mariemont?
Median Family Income in Mariemont is $198,712.
What is the Median Household income in Mariemont?
Median Household Income in Mariemont is $135,326.
What is Income or Wage Gap in Mariemont?
Income or Wage Gap in Mariemont is 29.0%.
Women in Mariemont earn 71.0 cents for every dollar earned by a man.
What is Inequality or Gini Index in Mariemont?
Inequality or Gini Index in Mariemont is 0.47.
How Large is the Labor Force in Mariemont?
There are 1,812 People in the Labor Forcein in Mariemont.
What is the Percentage of People in the Labor Force in Mariemont?
67.1% of People are in the Labor Force in Mariemont.
What is the Unemployment Rate in Mariemont?
Unemployment Rate in Mariemont is 1.6%.