Pomona, NJ
Pomona Map
Pomona Overview
8,878
TOTAL POPULATION
4,316
MALE POPULATION
4,562
FEMALE POPULATION
94.61
MALES / 100 FEMALES
105.70
FEMALES / 100 MALES
38.2
MEDIAN AGE
3.8
AVG FAMILY SIZE
3.5
AVG HOUSEHOLD SIZE
$32,561
PER CAPITA INCOME
$96,637
AVG FAMILY INCOME
$95,161
AVG HOUSEHOLD INCOME
24.3%
WAGE / INCOME GAP [ % ]
75.7¢/ $1
WAGE / INCOME GAP [ $ ]
0.37
INEQUALITY / GINI INDEX
3,941
LABOR FORCE [ PEOPLE ]
57.4%
PERCENT IN LABOR FORCE
2.3%
UNEMPLOYMENT RATE
Pomona Zip Codes
Pomona Area Codes
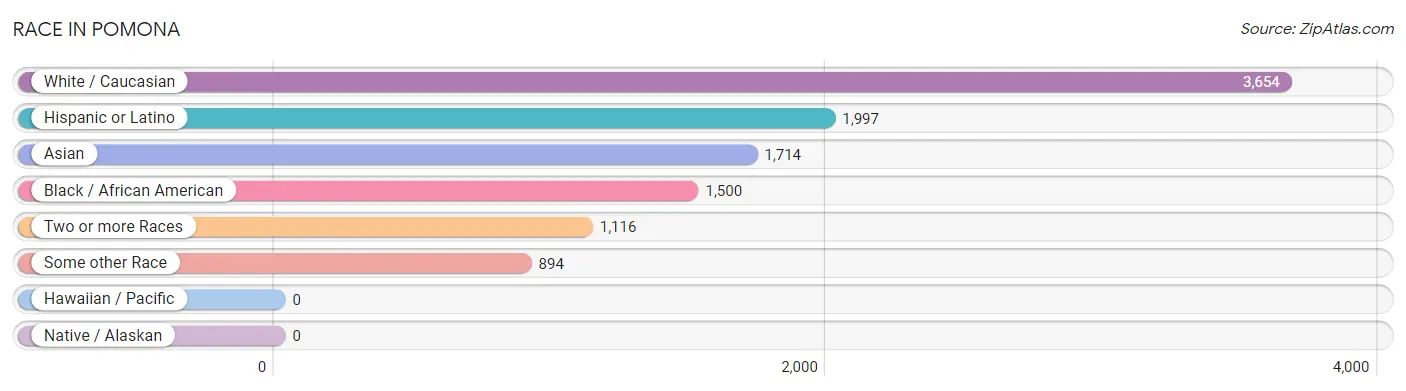
Race in Pomona
The most populous races in Pomona are White / Caucasian (3,654 | 41.2%), Hispanic or Latino (1,997 | 22.5%), and Asian (1,714 | 19.3%).
| Race | # Population | % Population |
| Asian | 1,714 | 19.3% |
| Black / African American | 1,500 | 16.9% |
| Hawaiian / Pacific | 0 | 0.0% |
| Hispanic or Latino | 1,997 | 22.5% |
| Native / Alaskan | 0 | 0.0% |
| White / Caucasian | 3,654 | 41.2% |
| Two or more Races | 1,116 | 12.6% |
| Some other Race | 894 | 10.1% |
| Total | 8,878 | 100.0% |
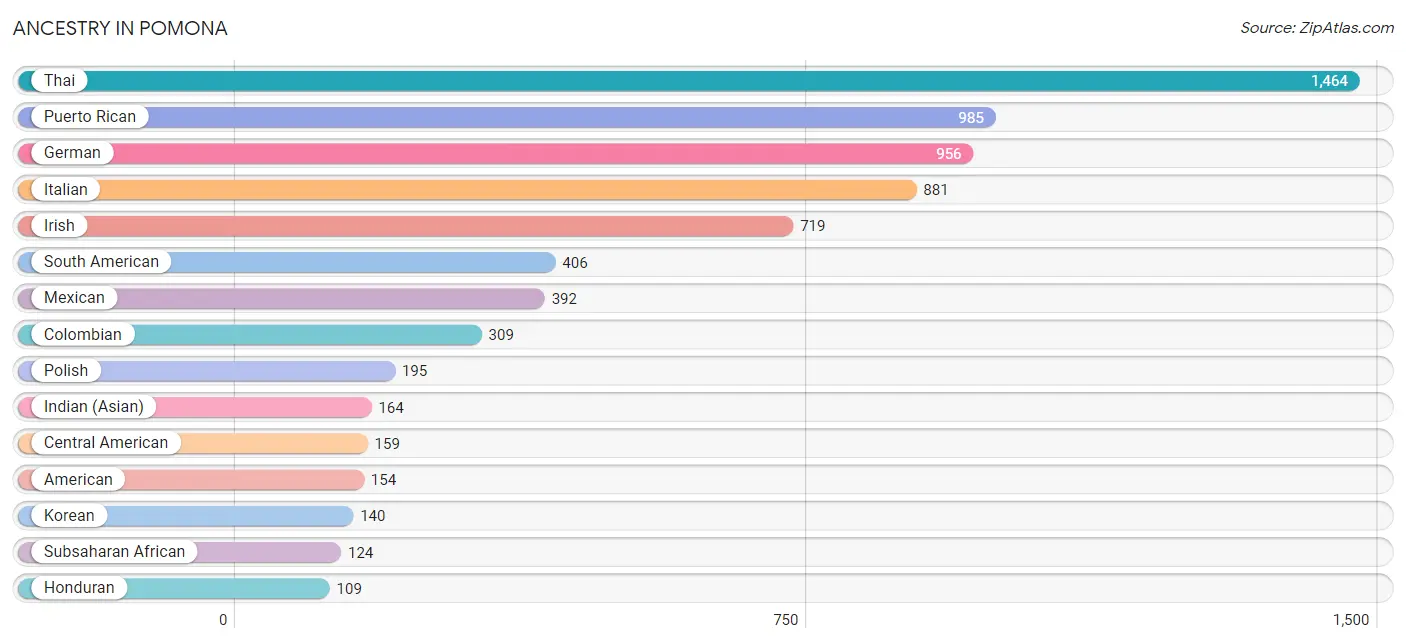
Ancestry in Pomona
The most populous ancestries reported in Pomona are Thai (1,464 | 16.5%), Puerto Rican (985 | 11.1%), German (956 | 10.8%), Italian (881 | 9.9%), and Irish (719 | 8.1%), together accounting for 56.4% of all Pomona residents.
| Ancestry | # Population | % Population |
| African | 59 | 0.7% |
| Albanian | 86 | 1.0% |
| American | 154 | 1.7% |
| Bulgarian | 28 | 0.3% |
| Burmese | 50 | 0.6% |
| Central American | 159 | 1.8% |
| Cherokee | 32 | 0.4% |
| Colombian | 309 | 3.5% |
| Dominican | 51 | 0.6% |
| Eastern European | 15 | 0.2% |
| English | 56 | 0.6% |
| European | 18 | 0.2% |
| German | 956 | 10.8% |
| Ghanaian | 65 | 0.7% |
| Guatemalan | 50 | 0.6% |
| Haitian | 35 | 0.4% |
| Honduran | 109 | 1.2% |
| Hungarian | 18 | 0.2% |
| Indian (Asian) | 164 | 1.8% |
| Irish | 719 | 8.1% |
| Italian | 881 | 9.9% |
| Jamaican | 52 | 0.6% |
| Korean | 140 | 1.6% |
| Mexican | 392 | 4.4% |
| Norwegian | 38 | 0.4% |
| Peruvian | 97 | 1.1% |
| Polish | 195 | 2.2% |
| Puerto Rican | 985 | 11.1% |
| Romanian | 32 | 0.4% |
| Russian | 36 | 0.4% |
| Slovene | 17 | 0.2% |
| South American | 406 | 4.6% |
| South American Indian | 56 | 0.6% |
| Subsaharan African | 124 | 1.4% |
| Thai | 1,464 | 16.5% | View All 35 Rows |
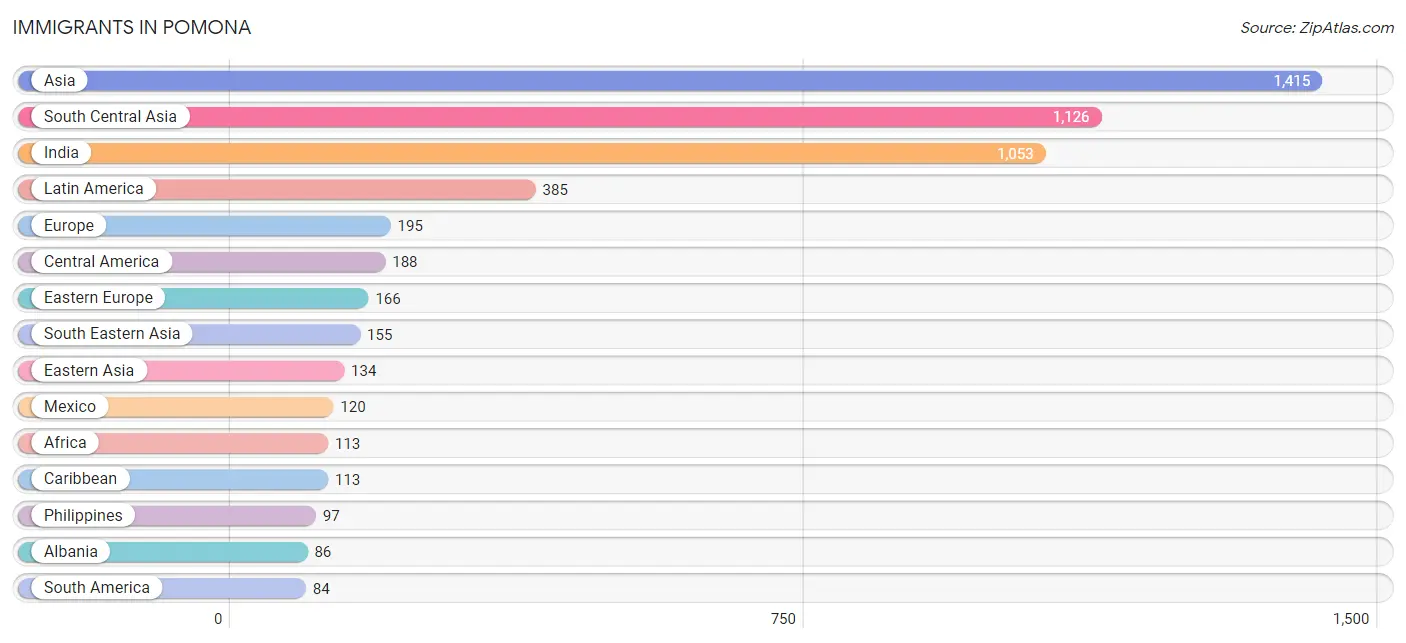
Immigrants in Pomona
The most numerous immigrant groups reported in Pomona came from Asia (1,415 | 15.9%), South Central Asia (1,126 | 12.7%), India (1,053 | 11.9%), Latin America (385 | 4.3%), and Europe (195 | 2.2%), together accounting for 47.0% of all Pomona residents.
| Immigration Origin | # Population | % Population |
| Africa | 113 | 1.3% |
| Albania | 86 | 1.0% |
| Asia | 1,415 | 15.9% |
| Bangladesh | 17 | 0.2% |
| Bulgaria | 28 | 0.3% |
| Canada | 4 | 0.1% |
| Caribbean | 113 | 1.3% |
| Central America | 188 | 2.1% |
| China | 83 | 0.9% |
| Colombia | 49 | 0.5% |
| Dominican Republic | 51 | 0.6% |
| Eastern Africa | 75 | 0.8% |
| Eastern Asia | 134 | 1.5% |
| Eastern Europe | 166 | 1.9% |
| Europe | 195 | 2.2% |
| Ghana | 38 | 0.4% |
| Guatemala | 50 | 0.6% |
| Haiti | 35 | 0.4% |
| Honduras | 18 | 0.2% |
| Hong Kong | 17 | 0.2% |
| India | 1,053 | 11.9% |
| Jamaica | 27 | 0.3% |
| Kenya | 2 | 0.0% |
| Korea | 51 | 0.6% |
| Latin America | 385 | 4.3% |
| Malaysia | 17 | 0.2% |
| Mexico | 120 | 1.3% |
| Northern Europe | 29 | 0.3% |
| Pakistan | 56 | 0.6% |
| Peru | 35 | 0.4% |
| Philippines | 97 | 1.1% |
| Poland | 20 | 0.2% |
| Romania | 32 | 0.4% |
| South America | 84 | 0.9% |
| South Central Asia | 1,126 | 12.7% |
| South Eastern Asia | 155 | 1.8% |
| Uganda | 73 | 0.8% |
| Vietnam | 41 | 0.5% |
| Western Africa | 38 | 0.4% | View All 39 Rows |
Sex and Age in Pomona
Sex and Age in Pomona
The most populous age groups in Pomona are 10 to 14 Years (406 | 9.4%) for men and 10 to 14 Years (542 | 11.9%) for women.
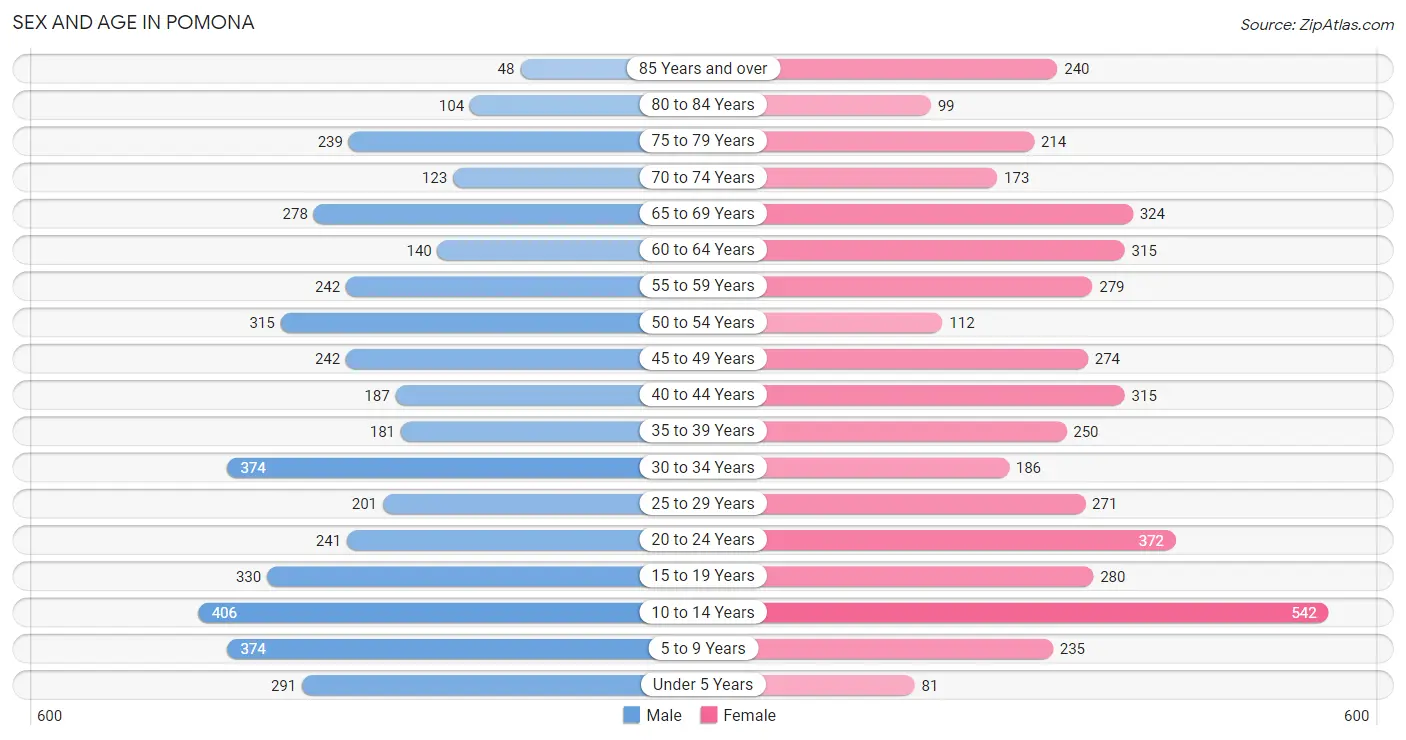
| Age Bracket | Male | Female |
| Under 5 Years | 291 (6.7%) | 81 (1.8%) |
| 5 to 9 Years | 374 (8.7%) | 235 (5.1%) |
| 10 to 14 Years | 406 (9.4%) | 542 (11.9%) |
| 15 to 19 Years | 330 (7.6%) | 280 (6.1%) |
| 20 to 24 Years | 241 (5.6%) | 372 (8.2%) |
| 25 to 29 Years | 201 (4.7%) | 271 (5.9%) |
| 30 to 34 Years | 374 (8.7%) | 186 (4.1%) |
| 35 to 39 Years | 181 (4.2%) | 250 (5.5%) |
| 40 to 44 Years | 187 (4.3%) | 315 (6.9%) |
| 45 to 49 Years | 242 (5.6%) | 274 (6.0%) |
| 50 to 54 Years | 315 (7.3%) | 112 (2.5%) |
| 55 to 59 Years | 242 (5.6%) | 279 (6.1%) |
| 60 to 64 Years | 140 (3.2%) | 315 (6.9%) |
| 65 to 69 Years | 278 (6.4%) | 324 (7.1%) |
| 70 to 74 Years | 123 (2.9%) | 173 (3.8%) |
| 75 to 79 Years | 239 (5.5%) | 214 (4.7%) |
| 80 to 84 Years | 104 (2.4%) | 99 (2.2%) |
| 85 Years and over | 48 (1.1%) | 240 (5.3%) |
| Total | 4,316 (100.0%) | 4,562 (100.0%) |
Families and Households in Pomona
Median Family Size in Pomona
The median family size in Pomona is 3.77 persons per family, with single female/mother families (345 | 17.0%) accounting for the largest median family size of 4.46 persons per family. On the other hand, single male/father families (95 | 4.7%) represent the smallest median family size with 2.66 persons per family.
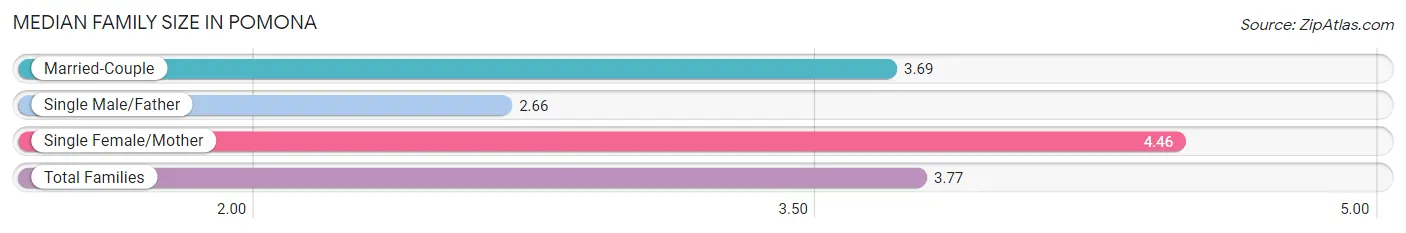
| Family Type | # Families | Family Size |
| Married-Couple | 1,592 (78.3%) | 3.69 |
| Single Male/Father | 95 (4.7%) | 2.66 |
| Single Female/Mother | 345 (17.0%) | 4.46 |
| Total Families | 2,032 (100.0%) | 3.77 |
Median Household Size in Pomona
The median household size in Pomona is 3.47 persons per household, with single female/mother households (345 | 14.1%) accounting for the largest median household size of 4.84 persons per household. non-family households (414 | 16.9%) represent the smallest median household size with 1.42 persons per household.
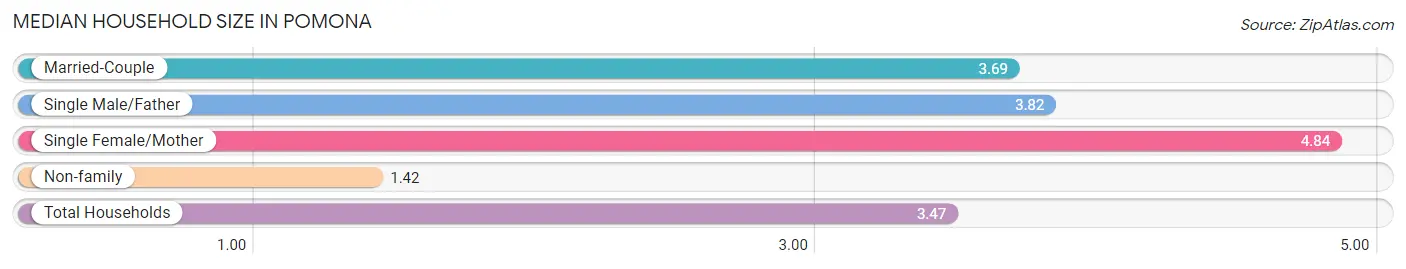
| Household Type | # Households | Household Size |
| Married-Couple | 1,592 (65.1%) | 3.69 |
| Single Male/Father | 95 (3.9%) | 3.82 |
| Single Female/Mother | 345 (14.1%) | 4.84 |
| Non-family | 414 (16.9%) | 1.42 |
| Total Households | 2,446 (100.0%) | 3.47 |
Household Size by Marriage Status in Pomona
Out of a total of 2,446 households in Pomona, 2,032 (83.1%) are family households, while 414 (16.9%) are nonfamily households. The most numerous type of family households are 2-person households, comprising 515, and the most common type of nonfamily households are 1-person households, comprising 334.
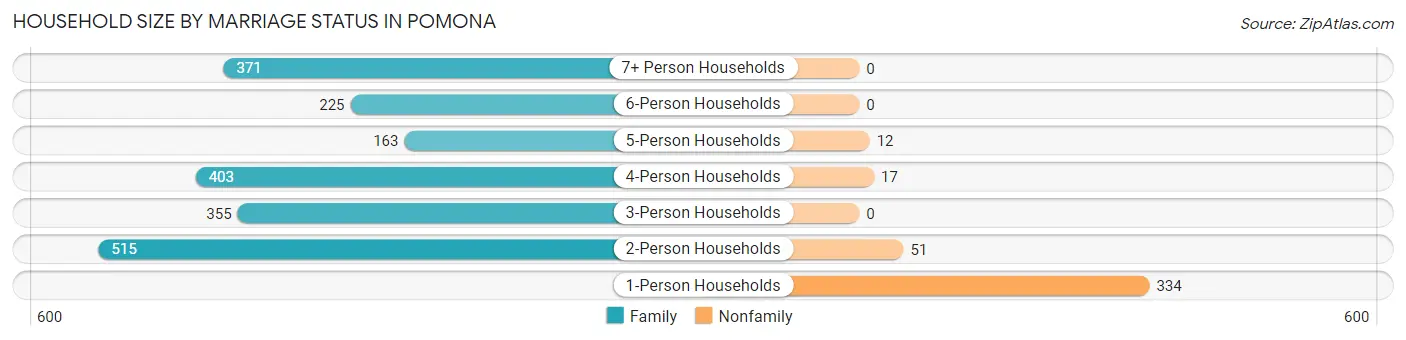
| Household Size | Family Households | Nonfamily Households |
| 1-Person Households | - | 334 (13.7%) |
| 2-Person Households | 515 (21.0%) | 51 (2.1%) |
| 3-Person Households | 355 (14.5%) | 0 (0.0%) |
| 4-Person Households | 403 (16.5%) | 17 (0.7%) |
| 5-Person Households | 163 (6.7%) | 12 (0.5%) |
| 6-Person Households | 225 (9.2%) | 0 (0.0%) |
| 7+ Person Households | 371 (15.2%) | 0 (0.0%) |
| Total | 2,032 (83.1%) | 414 (16.9%) |
Female Fertility in Pomona
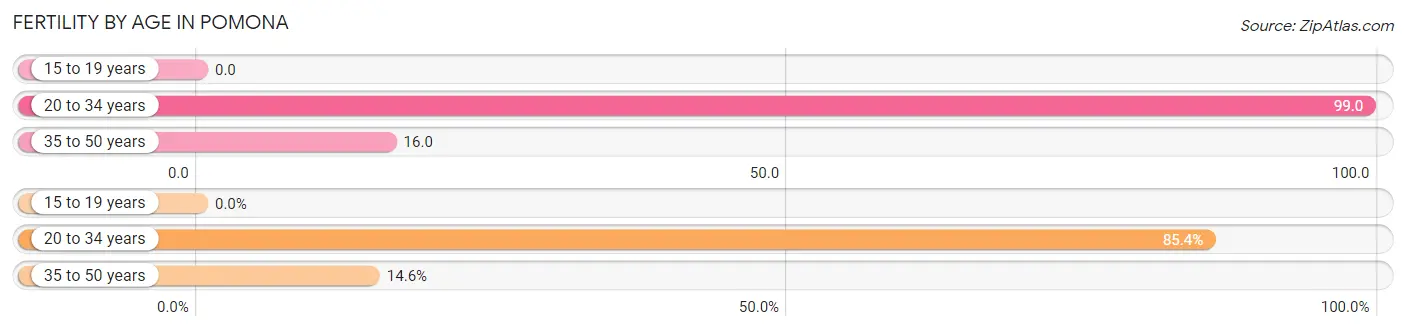
Fertility by Age in Pomona
Average fertility rate in Pomona is 49.0 births per 1,000 women. Women in the age bracket of 20 to 34 years have the highest fertility rate with 99.0 births per 1,000 women. Women in the age bracket of 20 to 34 years acount for 85.4% of all women with births.
| Age Bracket | Women with Births | Births / 1,000 Women |
| 15 to 19 years | 0 (0.0%) | 0.0 |
| 20 to 34 years | 82 (85.4%) | 99.0 |
| 35 to 50 years | 14 (14.6%) | 16.0 |
| Total | 96 (100.0%) | 49.0 |
Fertility by Age by Marriage Status in Pomona
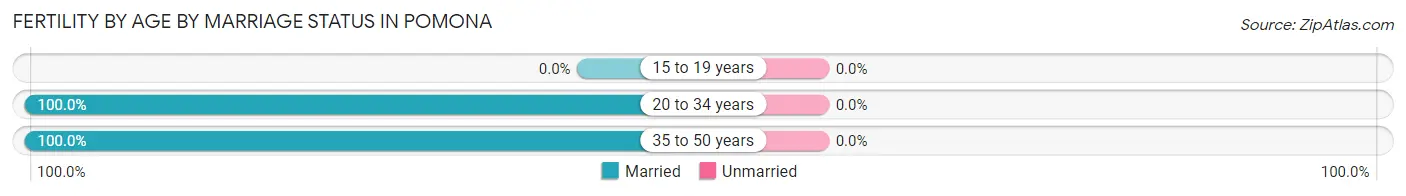
| Age Bracket | Married | Unmarried |
| 15 to 19 years | 0 (0.0%) | 0 (0.0%) |
| 20 to 34 years | 82 (100.0%) | 0 (0.0%) |
| 35 to 50 years | 14 (100.0%) | 0 (0.0%) |
| Total | 96 (100.0%) | 0 (0.0%) |
Fertility by Education in Pomona
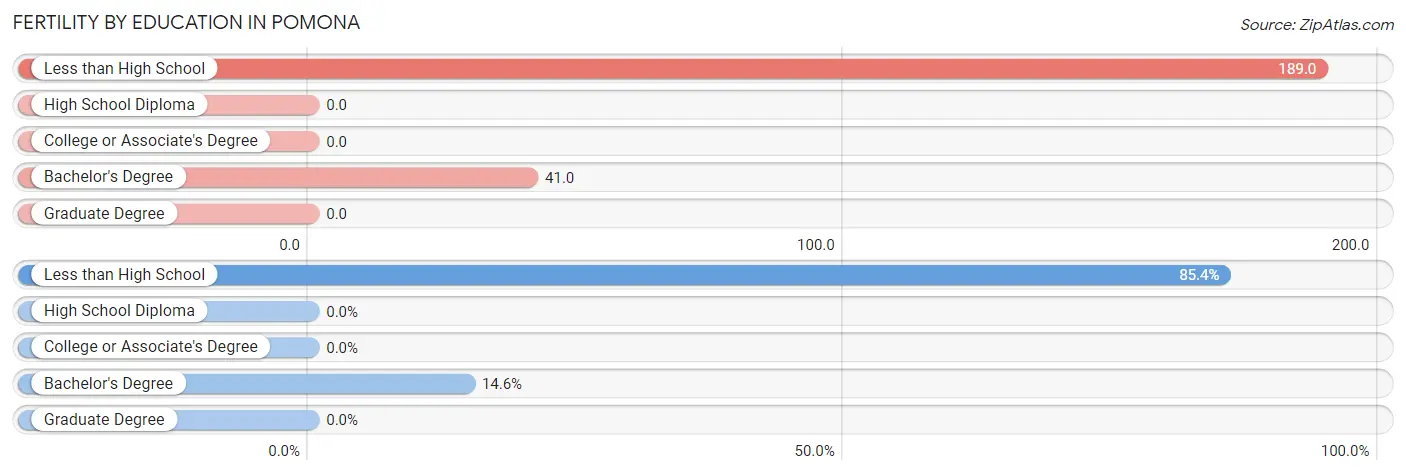
| Educational Attainment | Women with Births | Births / 1,000 Women |
| Less than High School | 82 (85.4%) | 189.0 |
| High School Diploma | 0 (0.0%) | 0.0 |
| College or Associate's Degree | 0 (0.0%) | 0.0 |
| Bachelor's Degree | 14 (14.6%) | 41.0 |
| Graduate Degree | 0 (0.0%) | 0.0 |
| Total | 96 (100.0%) | 49.0 |
Fertility by Education by Marriage Status in Pomona
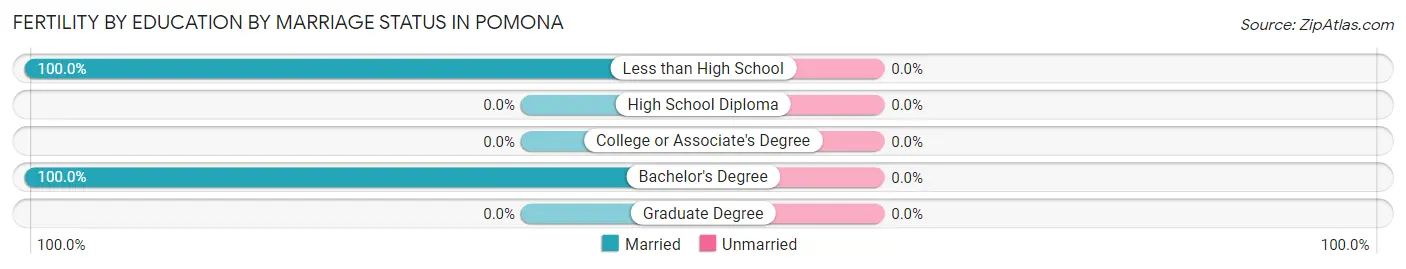
| Educational Attainment | Married | Unmarried |
| Less than High School | 82 (100.0%) | 0 (0.0%) |
| High School Diploma | 0 (0.0%) | 0 (0.0%) |
| College or Associate's Degree | 0 (0.0%) | 0 (0.0%) |
| Bachelor's Degree | 14 (100.0%) | 0 (0.0%) |
| Graduate Degree | 0 (0.0%) | 0 (0.0%) |
| Total | 96 (100.0%) | 0 (0.0%) |
Income in Pomona
Income Overview in Pomona
Per Capita Income in Pomona is $32,561, while median incomes of families and households are $96,637 and $95,161 respectively.
| Characteristic | Number | Measure |
| Per Capita Income | 8,878 | $32,561 |
| Median Family Income | 2,032 | $96,637 |
| Mean Family Income | 2,032 | $124,049 |
| Median Household Income | 2,446 | $95,161 |
| Mean Household Income | 2,446 | $115,952 |
| Income Deficit | 2,032 | $0 |
| Wage / Income Gap (%) | 8,878 | 24.31% |
| Wage / Income Gap ($) | 8,878 | 75.69¢ per $1 |
| Gini / Inequality Index | 8,878 | 0.37 |
Earnings by Sex in Pomona
Average Earnings in Pomona are $38,883, $47,757 for men and $36,145 for women, a difference of 24.3%.
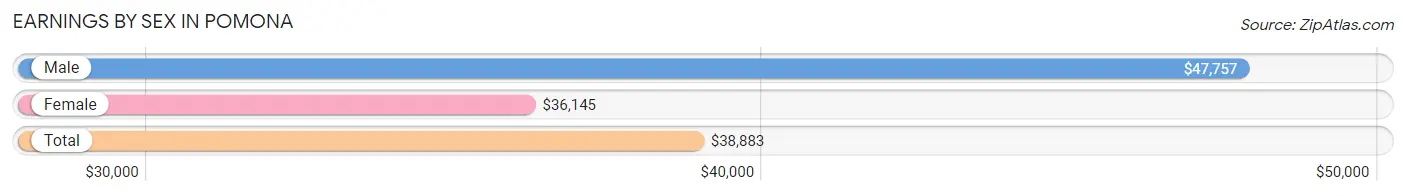
| Sex | Number | Average Earnings |
| Male | 2,087 (51.6%) | $47,757 |
| Female | 1,955 (48.4%) | $36,145 |
| Total | 4,042 (100.0%) | $38,883 |
Earnings by Sex by Income Bracket in Pomona
The most common earnings brackets in Pomona are $75,000 to $99,999 for men (343 | 16.4%) and $25,000 to $29,999 for women (275 | 14.1%).
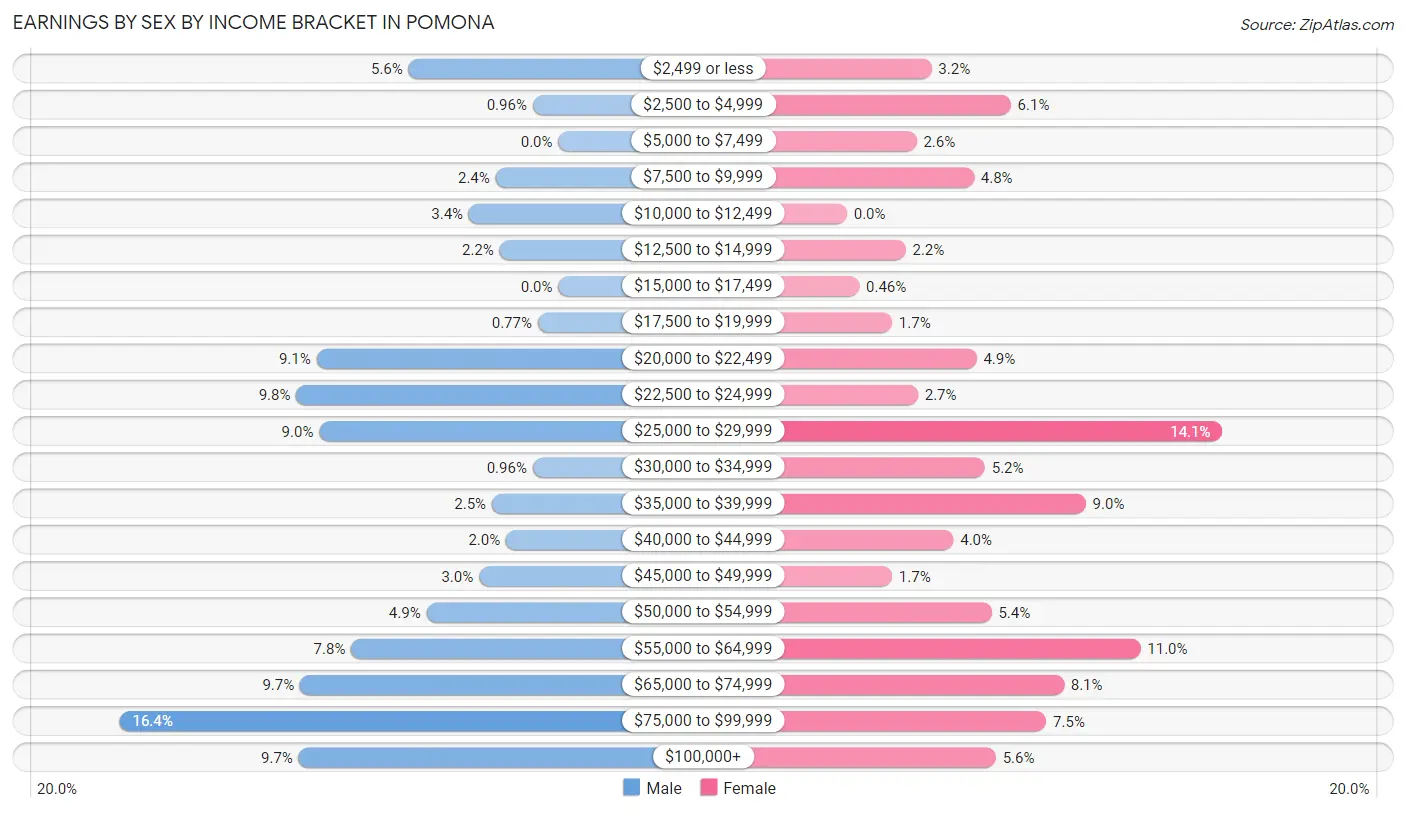
| Income | Male | Female |
| $2,499 or less | 117 (5.6%) | 62 (3.2%) |
| $2,500 to $4,999 | 20 (1.0%) | 120 (6.1%) |
| $5,000 to $7,499 | 0 (0.0%) | 51 (2.6%) |
| $7,500 to $9,999 | 49 (2.4%) | 93 (4.8%) |
| $10,000 to $12,499 | 70 (3.4%) | 0 (0.0%) |
| $12,500 to $14,999 | 46 (2.2%) | 43 (2.2%) |
| $15,000 to $17,499 | 0 (0.0%) | 9 (0.5%) |
| $17,500 to $19,999 | 16 (0.8%) | 33 (1.7%) |
| $20,000 to $22,499 | 189 (9.1%) | 95 (4.9%) |
| $22,500 to $24,999 | 205 (9.8%) | 52 (2.7%) |
| $25,000 to $29,999 | 187 (9.0%) | 275 (14.1%) |
| $30,000 to $34,999 | 20 (1.0%) | 101 (5.2%) |
| $35,000 to $39,999 | 52 (2.5%) | 175 (8.9%) |
| $40,000 to $44,999 | 41 (2.0%) | 78 (4.0%) |
| $45,000 to $49,999 | 62 (3.0%) | 33 (1.7%) |
| $50,000 to $54,999 | 103 (4.9%) | 106 (5.4%) |
| $55,000 to $64,999 | 162 (7.8%) | 215 (11.0%) |
| $65,000 to $74,999 | 202 (9.7%) | 159 (8.1%) |
| $75,000 to $99,999 | 343 (16.4%) | 146 (7.5%) |
| $100,000+ | 203 (9.7%) | 109 (5.6%) |
| Total | 2,087 (100.0%) | 1,955 (100.0%) |
Earnings by Sex by Educational Attainment in Pomona
Average earnings in Pomona are $52,052 for men and $38,609 for women, a difference of 25.8%. Men with an educational attainment of graduate degree enjoy the highest average annual earnings of $130,987, while those with high school diploma education earn the least with $29,020. Women with an educational attainment of graduate degree earn the most with the average annual earnings of $72,321, while those with less than high school education have the smallest earnings of $26,012.
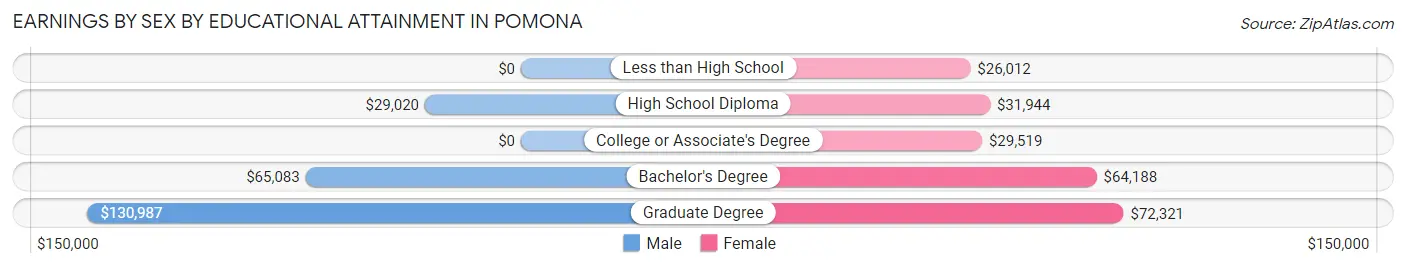
| Educational Attainment | Male Income | Female Income |
| Less than High School | - | - |
| High School Diploma | $29,020 | $31,944 |
| College or Associate's Degree | - | - |
| Bachelor's Degree | $65,083 | $64,188 |
| Graduate Degree | $130,987 | $72,321 |
| Total | $52,052 | $38,609 |
Family Income in Pomona
Family Income Brackets in Pomona
According to the Pomona family income data, there are 549 families falling into the $75,000 to $99,999 income range, which is the most common income bracket and makes up 27.0% of all families.
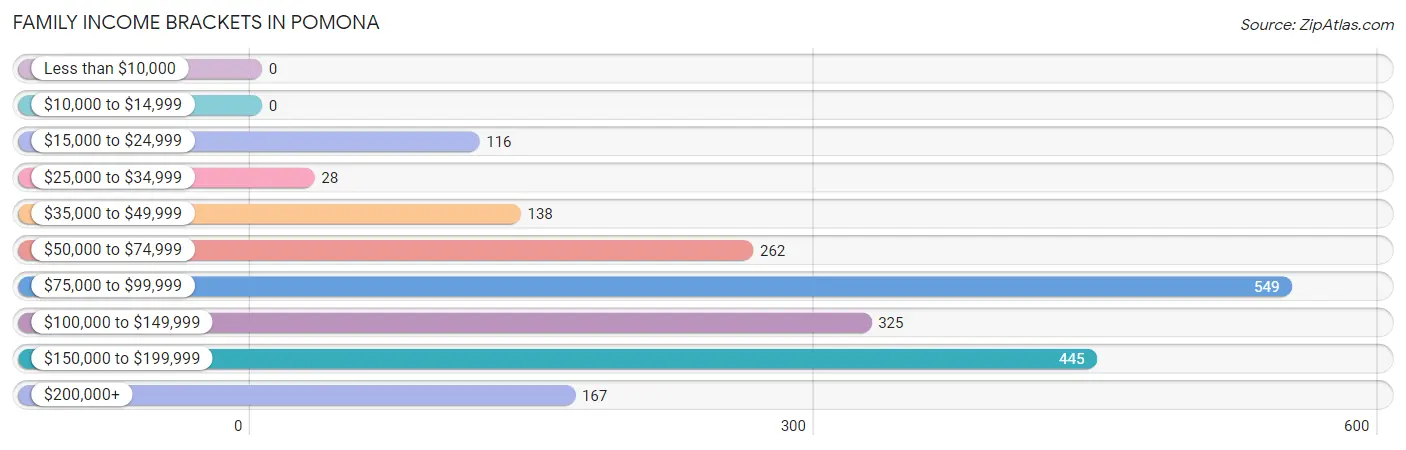
| Income Bracket | # Families | % Families |
| Less than $10,000 | 0 | 0.0% |
| $10,000 to $14,999 | 0 | 0.0% |
| $15,000 to $24,999 | 116 | 5.7% |
| $25,000 to $34,999 | 28 | 1.4% |
| $35,000 to $49,999 | 138 | 6.8% |
| $50,000 to $74,999 | 262 | 12.9% |
| $75,000 to $99,999 | 549 | 27.0% |
| $100,000 to $149,999 | 325 | 16.0% |
| $150,000 to $199,999 | 445 | 21.9% |
| $200,000+ | 167 | 8.2% |
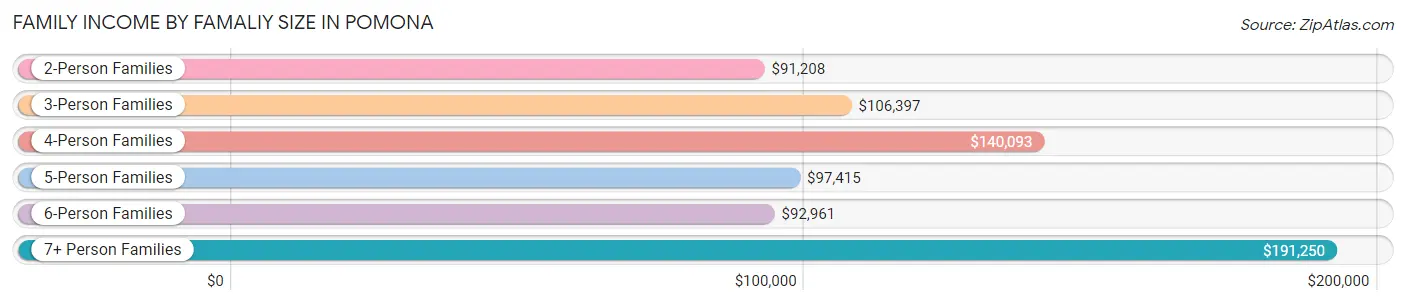
Family Income by Famaliy Size in Pomona
7+ person families (279 | 13.7%) account for the highest median family income in Pomona with $191,250 per family, while 2-person families (609 | 30.0%) have the highest median income of $45,604 per family member.
| Income Bracket | # Families | Median Income |
| 2-Person Families | 609 (30.0%) | $91,208 |
| 3-Person Families | 277 (13.6%) | $106,397 |
| 4-Person Families | 405 (19.9%) | $140,093 |
| 5-Person Families | 163 (8.0%) | $97,415 |
| 6-Person Families | 299 (14.7%) | $92,961 |
| 7+ Person Families | 279 (13.7%) | $191,250 |
| Total | 2,032 (100.0%) | $96,637 |
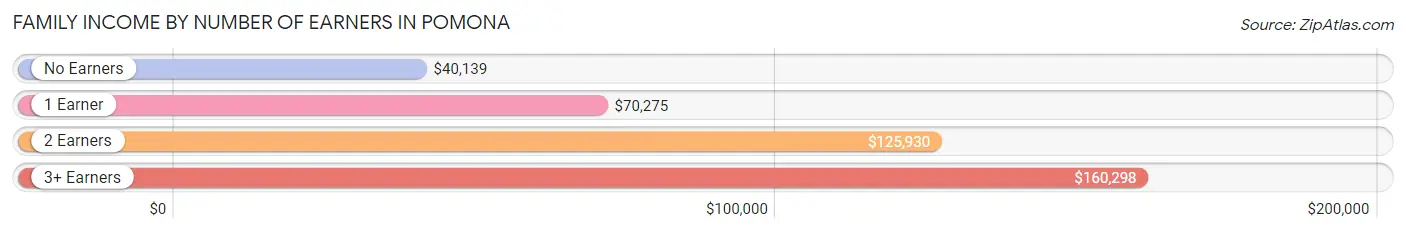
Family Income by Number of Earners in Pomona
The median family income in Pomona is $96,637, with families comprising 3+ earners (579) having the highest median family income of $160,298, while families with no earners (158) have the lowest median family income of $40,139, accounting for 28.5% and 7.8% of families, respectively.
| Number of Earners | # Families | Median Income |
| No Earners | 158 (7.8%) | $40,139 |
| 1 Earner | 613 (30.2%) | $70,275 |
| 2 Earners | 682 (33.6%) | $125,930 |
| 3+ Earners | 579 (28.5%) | $160,298 |
| Total | 2,032 (100.0%) | $96,637 |
Household Income in Pomona
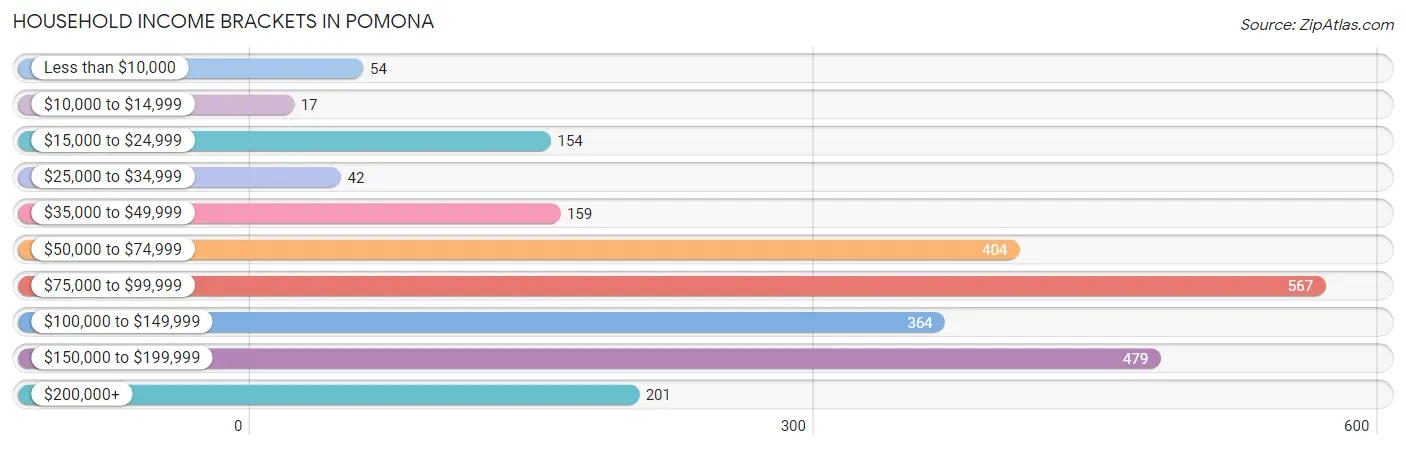
Household Income Brackets in Pomona
With 567 households falling in the category, the $75,000 to $99,999 income range is the most frequent in Pomona, accounting for 23.2% of all households. In contrast, only 17 households (0.7%) fall into the $10,000 to $14,999 income bracket, making it the least populous group.
| Income Bracket | # Households | % Households |
| Less than $10,000 | 54 | 2.2% |
| $10,000 to $14,999 | 17 | 0.7% |
| $15,000 to $24,999 | 154 | 6.3% |
| $25,000 to $34,999 | 42 | 1.7% |
| $35,000 to $49,999 | 159 | 6.5% |
| $50,000 to $74,999 | 404 | 16.5% |
| $75,000 to $99,999 | 567 | 23.2% |
| $100,000 to $149,999 | 364 | 14.9% |
| $150,000 to $199,999 | 479 | 19.6% |
| $200,000+ | 201 | 8.2% |
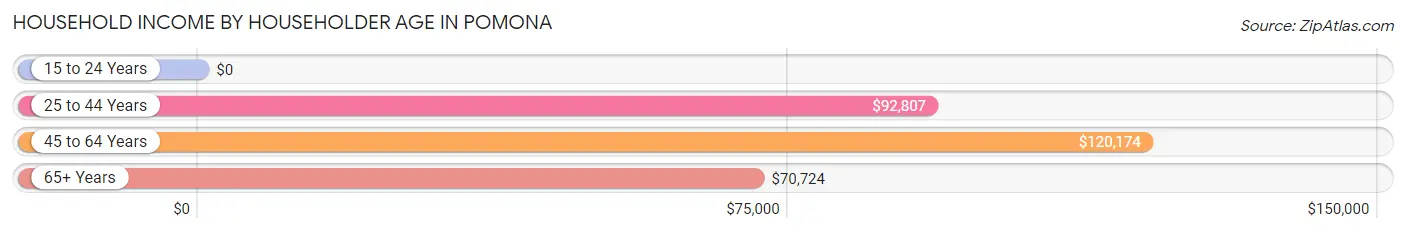
Household Income by Householder Age in Pomona
The median household income in Pomona is $95,161, with the highest median household income of $120,174 found in the 45 to 64 years age bracket for the primary householder. A total of 848 households (34.7%) fall into this category. Meanwhile, the 15 to 24 years age bracket for the primary householder has the lowest median household income of $0, with 62 households (2.5%) in this group.
| Income Bracket | # Households | Median Income |
| 15 to 24 Years | 62 (2.5%) | $0 |
| 25 to 44 Years | 636 (26.0%) | $92,807 |
| 45 to 64 Years | 848 (34.7%) | $120,174 |
| 65+ Years | 900 (36.8%) | $70,724 |
| Total | 2,446 (100.0%) | $95,161 |
Poverty in Pomona
Income Below Poverty by Sex and Age in Pomona
With 6.8% poverty level for males and 8.0% for females among the residents of Pomona, under 5 year old males and 15 year old females are the most vulnerable to poverty, with 75 males (25.8%) and 39 females (70.9%) in their respective age groups living below the poverty level.
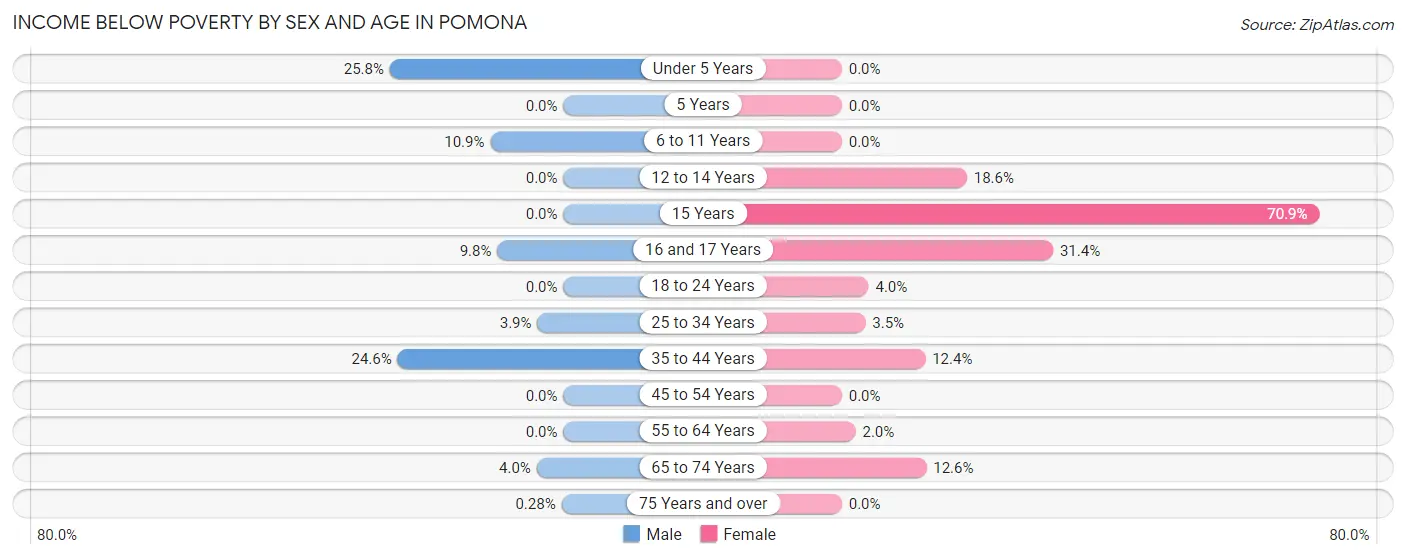
| Age Bracket | Male | Female |
| Under 5 Years | 75 (25.8%) | 0 (0.0%) |
| 5 Years | 0 (0.0%) | 0 (0.0%) |
| 6 to 11 Years | 64 (10.8%) | 0 (0.0%) |
| 12 to 14 Years | 0 (0.0%) | 80 (18.6%) |
| 15 Years | 0 (0.0%) | 39 (70.9%) |
| 16 and 17 Years | 21 (9.8%) | 53 (31.4%) |
| 18 to 24 Years | 0 (0.0%) | 17 (4.0%) |
| 25 to 34 Years | 22 (3.9%) | 16 (3.5%) |
| 35 to 44 Years | 82 (24.6%) | 70 (12.4%) |
| 45 to 54 Years | 0 (0.0%) | 0 (0.0%) |
| 55 to 64 Years | 0 (0.0%) | 12 (2.0%) |
| 65 to 74 Years | 15 (4.0%) | 59 (12.6%) |
| 75 Years and over | 1 (0.3%) | 0 (0.0%) |
| Total | 280 (6.8%) | 346 (8.0%) |
Income Above Poverty by Sex and Age in Pomona
According to the poverty statistics in Pomona, males aged 5 years and females aged under 5 years are the age groups that are most secure financially, with 100.0% of males and 100.0% of females in these age groups living above the poverty line.
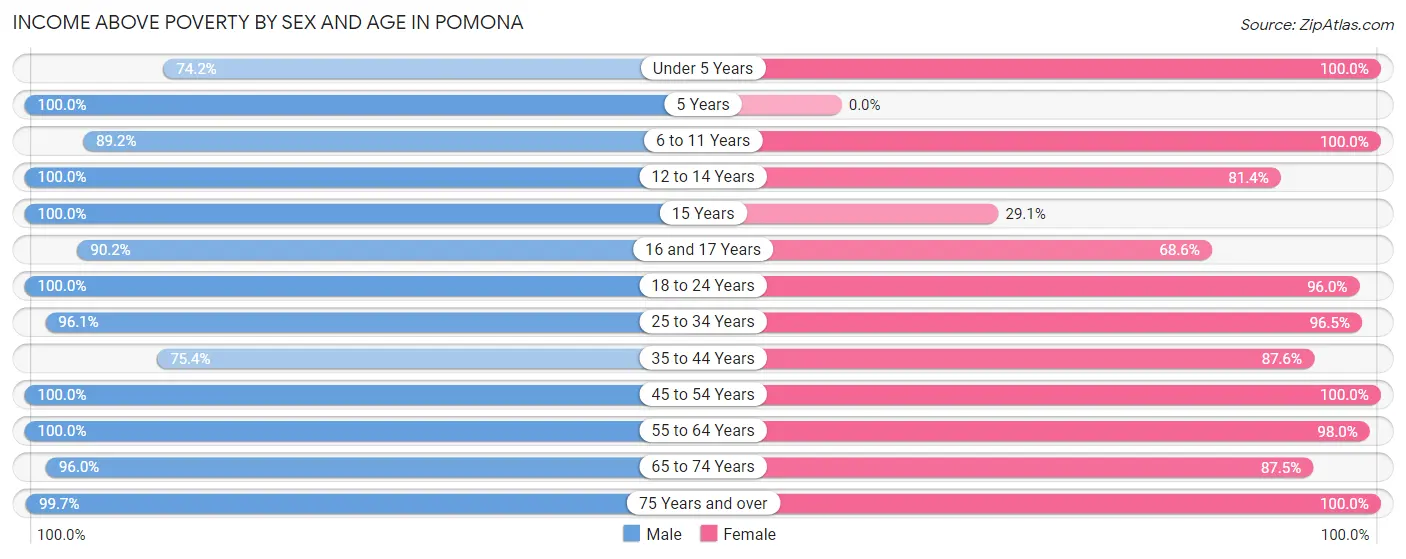
| Age Bracket | Male | Female |
| Under 5 Years | 216 (74.2%) | 81 (100.0%) |
| 5 Years | 53 (100.0%) | 0 (0.0%) |
| 6 to 11 Years | 526 (89.1%) | 346 (100.0%) |
| 12 to 14 Years | 100 (100.0%) | 351 (81.4%) |
| 15 Years | 28 (100.0%) | 16 (29.1%) |
| 16 and 17 Years | 193 (90.2%) | 116 (68.6%) |
| 18 to 24 Years | 329 (100.0%) | 411 (96.0%) |
| 25 to 34 Years | 548 (96.1%) | 441 (96.5%) |
| 35 to 44 Years | 251 (75.4%) | 495 (87.6%) |
| 45 to 54 Years | 552 (100.0%) | 386 (100.0%) |
| 55 to 64 Years | 345 (100.0%) | 577 (98.0%) |
| 65 to 74 Years | 364 (96.0%) | 411 (87.5%) |
| 75 Years and over | 351 (99.7%) | 345 (100.0%) |
| Total | 3,856 (93.2%) | 3,976 (92.0%) |
Income Below Poverty Among Married-Couple Families in Pomona
The poverty statistics for married-couple families in Pomona show that 4.1% or 65 of the total 1,592 families live below the poverty line. Families with 3 or 4 children have the highest poverty rate of 53.7%, comprising of 65 families. On the other hand, families with no children have the lowest poverty rate of 0.0%, which includes 0 families.
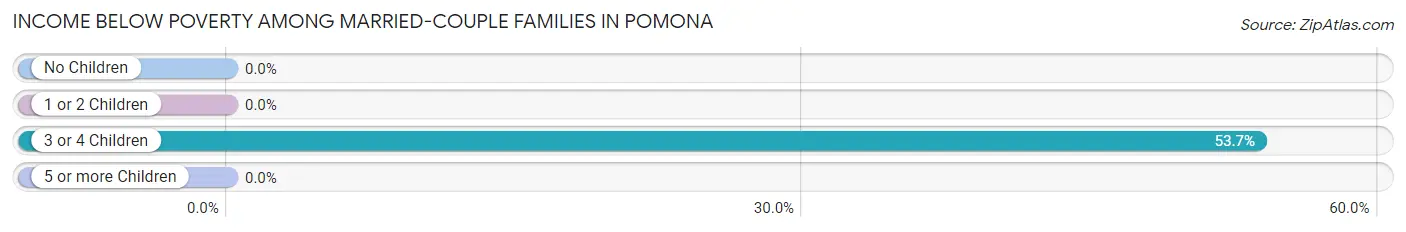
| Children | Above Poverty | Below Poverty |
| No Children | 738 (100.0%) | 0 (0.0%) |
| 1 or 2 Children | 733 (100.0%) | 0 (0.0%) |
| 3 or 4 Children | 56 (46.3%) | 65 (53.7%) |
| 5 or more Children | 0 (0.0%) | 0 (0.0%) |
| Total | 1,527 (95.9%) | 65 (4.1%) |
Income Below Poverty Among Single-Parent Households in Pomona
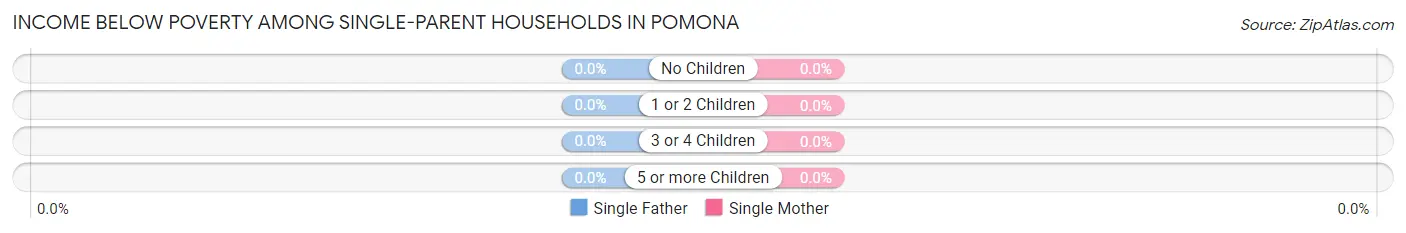
| Children | Single Father | Single Mother |
| No Children | 0 (0.0%) | 0 (0.0%) |
| 1 or 2 Children | 0 (0.0%) | 0 (0.0%) |
| 3 or 4 Children | 0 (0.0%) | 0 (0.0%) |
| 5 or more Children | 0 (0.0%) | 0 (0.0%) |
| Total | 0 (0.0%) | 0 (0.0%) |
Income Below Poverty Among Married-Couple vs Single-Parent Households in Pomona
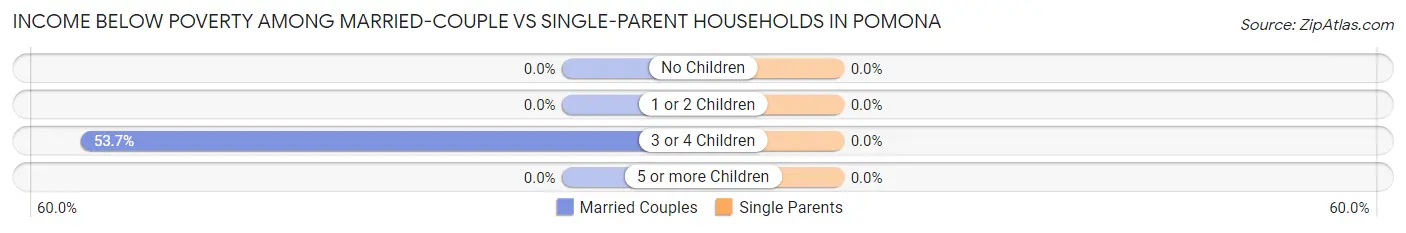
| Children | Married-Couple Families | Single-Parent Households |
| No Children | 0 (0.0%) | 0 (0.0%) |
| 1 or 2 Children | 0 (0.0%) | 0 (0.0%) |
| 3 or 4 Children | 65 (53.7%) | 0 (0.0%) |
| 5 or more Children | 0 (0.0%) | 0 (0.0%) |
| Total | 65 (4.1%) | 0 (0.0%) |
Employment Characteristics in Pomona
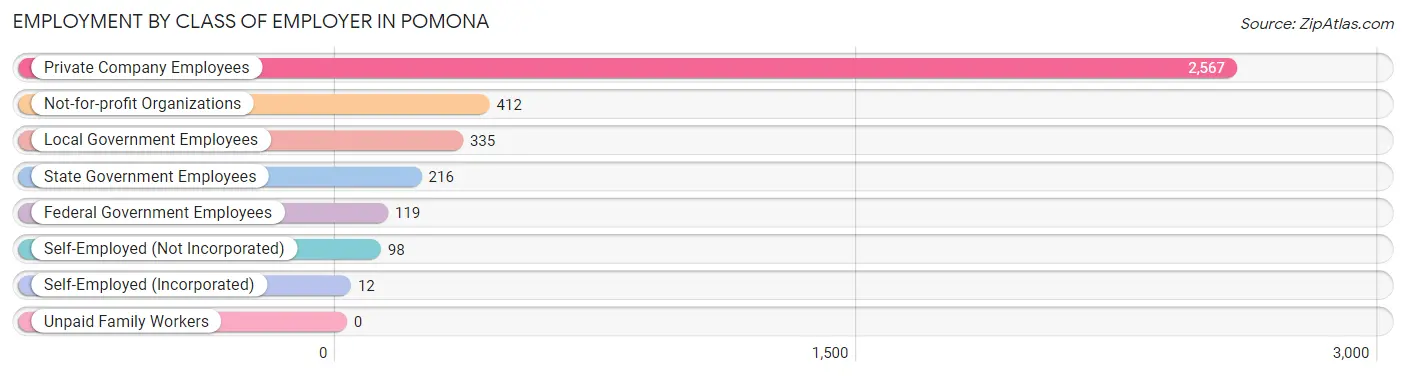
Employment by Class of Employer in Pomona
Among the 3,759 employed individuals in Pomona, private company employees (2,567 | 68.3%), not-for-profit organizations (412 | 11.0%), and local government employees (335 | 8.9%) make up the most common classes of employment.
| Employer Class | # Employees | % Employees |
| Private Company Employees | 2,567 | 68.3% |
| Self-Employed (Incorporated) | 12 | 0.3% |
| Self-Employed (Not Incorporated) | 98 | 2.6% |
| Not-for-profit Organizations | 412 | 11.0% |
| Local Government Employees | 335 | 8.9% |
| State Government Employees | 216 | 5.8% |
| Federal Government Employees | 119 | 3.2% |
| Unpaid Family Workers | 0 | 0.0% |
| Total | 3,759 | 100.0% |
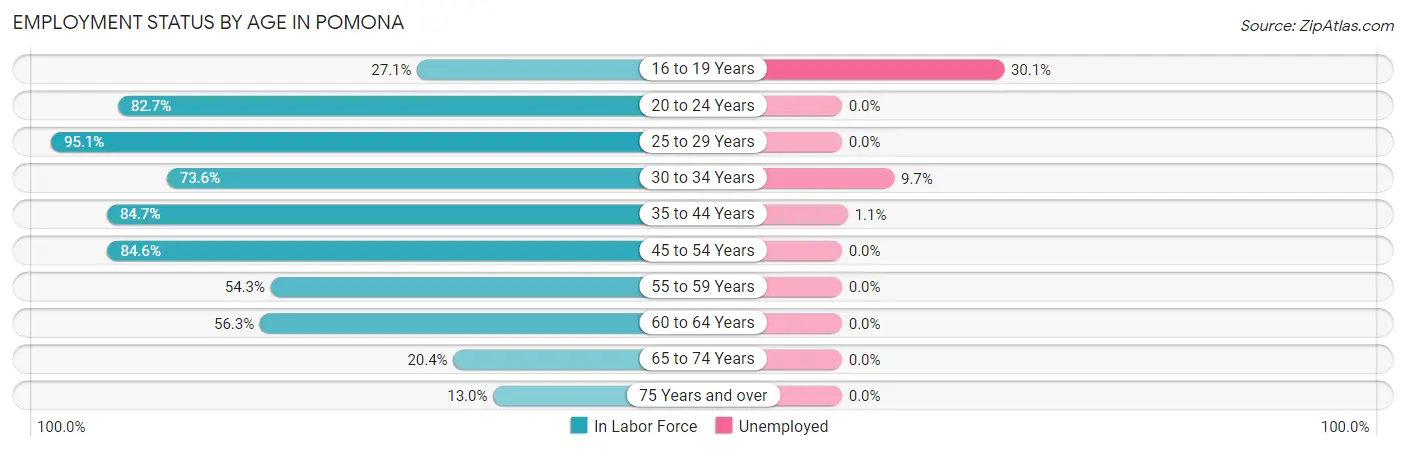
Employment Status by Age in Pomona
According to the labor force statistics for Pomona, out of the total population over 16 years of age (6,866), 57.4% or 3,941 individuals are in the labor force, with 2.3% or 91 of them unemployed. The age group with the highest labor force participation rate is 25 to 29 years, with 95.1% or 449 individuals in the labor force. Within the labor force, the 16 to 19 years age range has the highest percentage of unemployed individuals, with 30.1% or 43 of them being unemployed.
| Age Bracket | In Labor Force | Unemployed |
| 16 to 19 Years | 143 (27.1%) | 43 (30.1%) |
| 20 to 24 Years | 507 (82.7%) | 0 (0.0%) |
| 25 to 29 Years | 449 (95.1%) | 0 (0.0%) |
| 30 to 34 Years | 412 (73.6%) | 40 (9.7%) |
| 35 to 44 Years | 790 (84.7%) | 9 (1.1%) |
| 45 to 54 Years | 798 (84.6%) | 0 (0.0%) |
| 55 to 59 Years | 283 (54.3%) | 0 (0.0%) |
| 60 to 64 Years | 256 (56.3%) | 0 (0.0%) |
| 65 to 74 Years | 183 (20.4%) | 0 (0.0%) |
| 75 Years and over | 123 (13.0%) | 0 (0.0%) |
| Total | 3,941 (57.4%) | 91 (2.3%) |
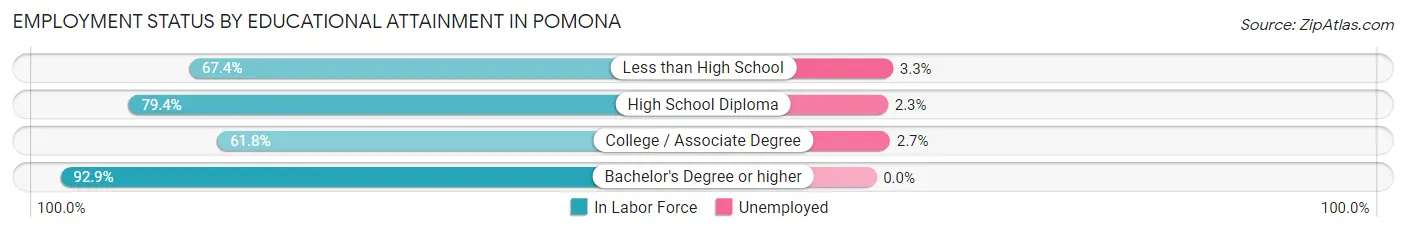
Employment Status by Educational Attainment in Pomona
According to labor force statistics for Pomona, 76.9% of individuals (2,987) out of the total population between 25 and 64 years of age (3,884) are in the labor force, with 1.6% or 48 of them being unemployed. The group with the highest labor force participation rate are those with the educational attainment of bachelor's degree or higher, with 92.9% or 1,074 individuals in the labor force. Within the labor force, individuals with less than high school education have the highest percentage of unemployment, with 3.3% or 9 of them being unemployed.
| Educational Attainment | In Labor Force | Unemployed |
| Less than High School | 275 (67.4%) | 13 (3.3%) |
| High School Diploma | 925 (79.4%) | 27 (2.3%) |
| College / Associate Degree | 714 (61.8%) | 31 (2.7%) |
| Bachelor's Degree or higher | 1,074 (92.9%) | 0 (0.0%) |
| Total | 2,987 (76.9%) | 62 (1.6%) |
Employment Occupations by Sex in Pomona
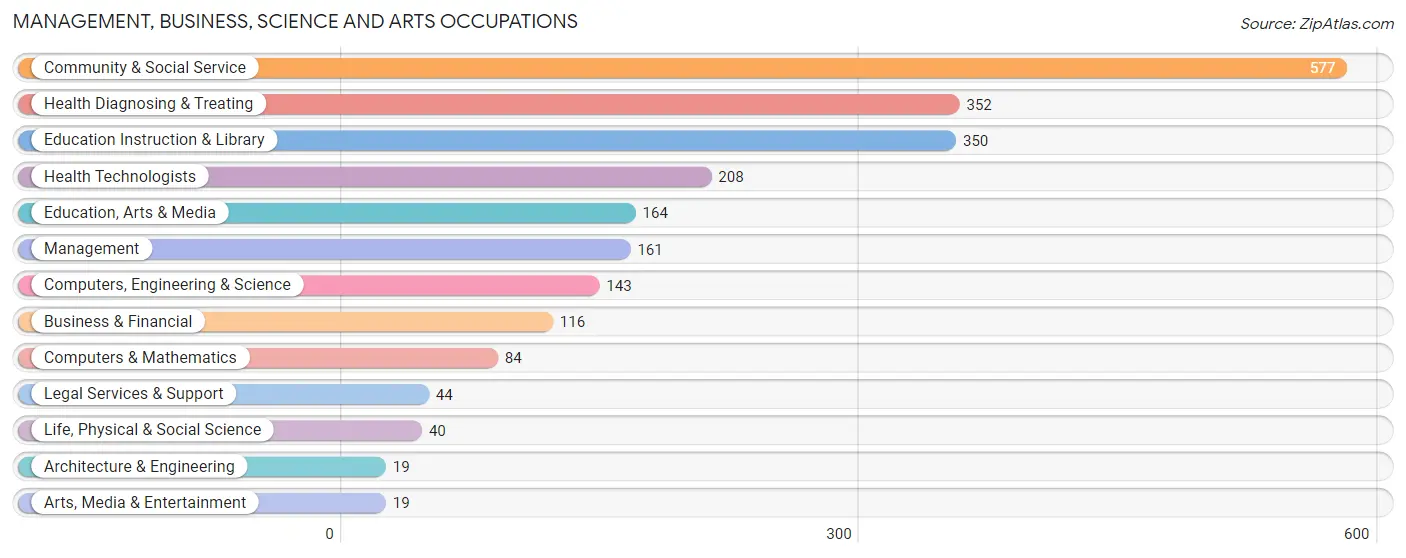
Management, Business, Science and Arts Occupations
The most common Management, Business, Science and Arts occupations in Pomona are Community & Social Service (577 | 15.0%), Health Diagnosing & Treating (352 | 9.1%), Education Instruction & Library (350 | 9.1%), Health Technologists (208 | 5.4%), and Education, Arts & Media (164 | 4.3%).
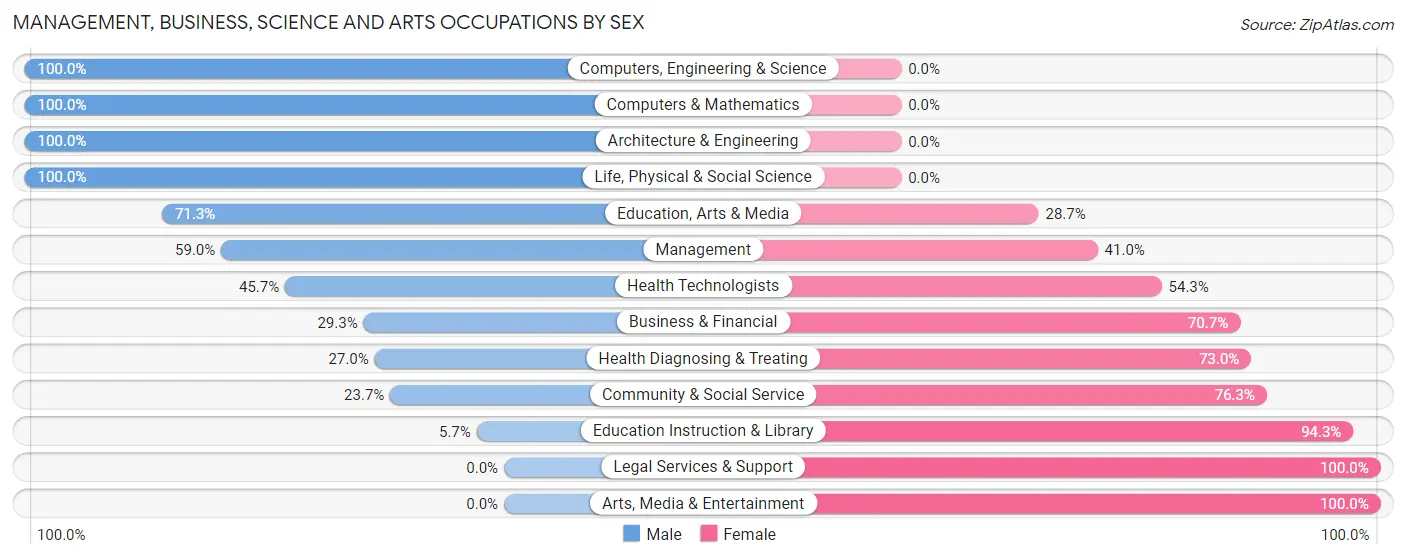
Management, Business, Science and Arts Occupations by Sex
Within the Management, Business, Science and Arts occupations in Pomona, the most male-oriented occupations are Computers, Engineering & Science (100.0%), Computers & Mathematics (100.0%), and Architecture & Engineering (100.0%), while the most female-oriented occupations are Legal Services & Support (100.0%), Arts, Media & Entertainment (100.0%), and Education Instruction & Library (94.3%).
| Occupation | Male | Female |
| Management | 95 (59.0%) | 66 (41.0%) |
| Business & Financial | 34 (29.3%) | 82 (70.7%) |
| Computers, Engineering & Science | 143 (100.0%) | 0 (0.0%) |
| Computers & Mathematics | 84 (100.0%) | 0 (0.0%) |
| Architecture & Engineering | 19 (100.0%) | 0 (0.0%) |
| Life, Physical & Social Science | 40 (100.0%) | 0 (0.0%) |
| Community & Social Service | 137 (23.7%) | 440 (76.3%) |
| Education, Arts & Media | 117 (71.3%) | 47 (28.7%) |
| Legal Services & Support | 0 (0.0%) | 44 (100.0%) |
| Education Instruction & Library | 20 (5.7%) | 330 (94.3%) |
| Arts, Media & Entertainment | 0 (0.0%) | 19 (100.0%) |
| Health Diagnosing & Treating | 95 (27.0%) | 257 (73.0%) |
| Health Technologists | 95 (45.7%) | 113 (54.3%) |
| Total (Category) | 504 (37.4%) | 845 (62.6%) |
| Total (Overall) | 2,015 (52.3%) | 1,837 (47.7%) |
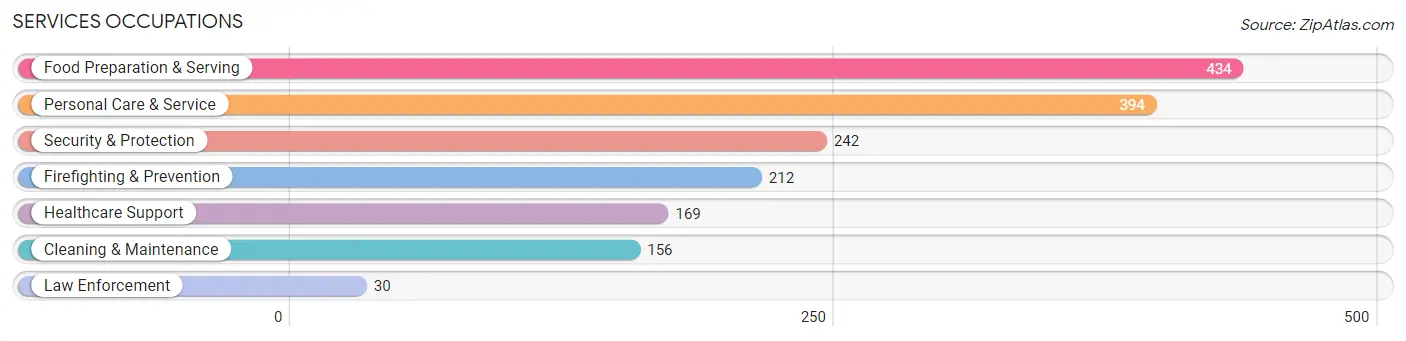
Services Occupations
The most common Services occupations in Pomona are Food Preparation & Serving (434 | 11.3%), Personal Care & Service (394 | 10.2%), Security & Protection (242 | 6.3%), Firefighting & Prevention (212 | 5.5%), and Healthcare Support (169 | 4.4%).
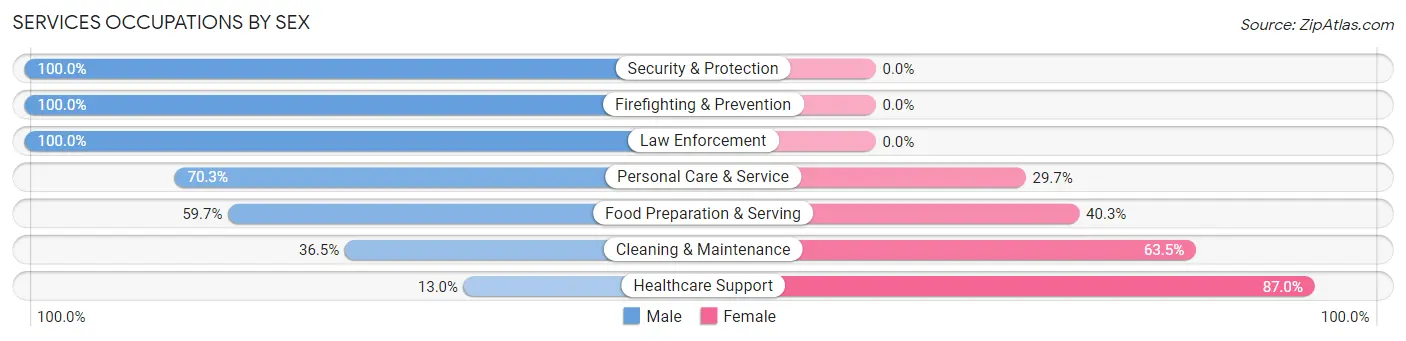
Services Occupations by Sex
Within the Services occupations in Pomona, the most male-oriented occupations are Security & Protection (100.0%), Firefighting & Prevention (100.0%), and Law Enforcement (100.0%), while the most female-oriented occupations are Healthcare Support (87.0%), Cleaning & Maintenance (63.5%), and Food Preparation & Serving (40.3%).
| Occupation | Male | Female |
| Healthcare Support | 22 (13.0%) | 147 (87.0%) |
| Security & Protection | 242 (100.0%) | 0 (0.0%) |
| Firefighting & Prevention | 212 (100.0%) | 0 (0.0%) |
| Law Enforcement | 30 (100.0%) | 0 (0.0%) |
| Food Preparation & Serving | 259 (59.7%) | 175 (40.3%) |
| Cleaning & Maintenance | 57 (36.5%) | 99 (63.5%) |
| Personal Care & Service | 277 (70.3%) | 117 (29.7%) |
| Total (Category) | 857 (61.4%) | 538 (38.6%) |
| Total (Overall) | 2,015 (52.3%) | 1,837 (47.7%) |
Sales and Office Occupations
The most common Sales and Office occupations in Pomona are Office & Administration (452 | 11.7%), and Sales & Related (92 | 2.4%).
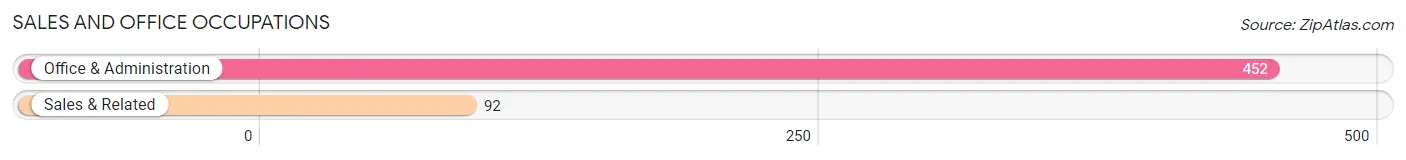
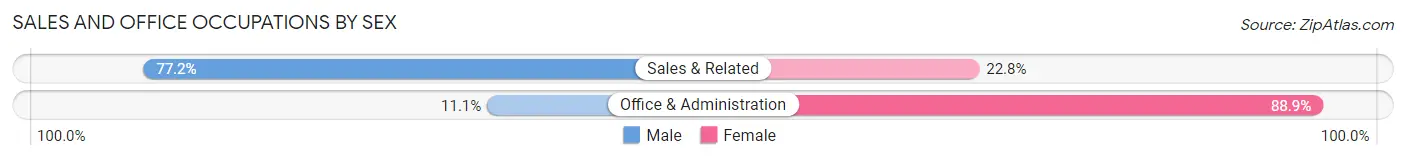
Sales and Office Occupations by Sex
| Occupation | Male | Female |
| Sales & Related | 71 (77.2%) | 21 (22.8%) |
| Office & Administration | 50 (11.1%) | 402 (88.9%) |
| Total (Category) | 121 (22.2%) | 423 (77.8%) |
| Total (Overall) | 2,015 (52.3%) | 1,837 (47.7%) |
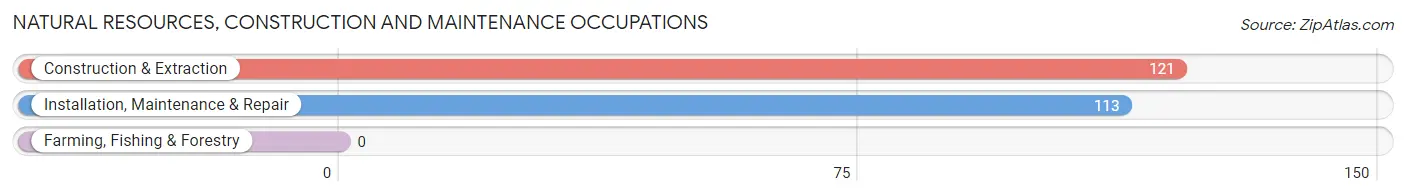
Natural Resources, Construction and Maintenance Occupations
The most common Natural Resources, Construction and Maintenance occupations in Pomona are Construction & Extraction (121 | 3.1%), and Installation, Maintenance & Repair (113 | 2.9%).
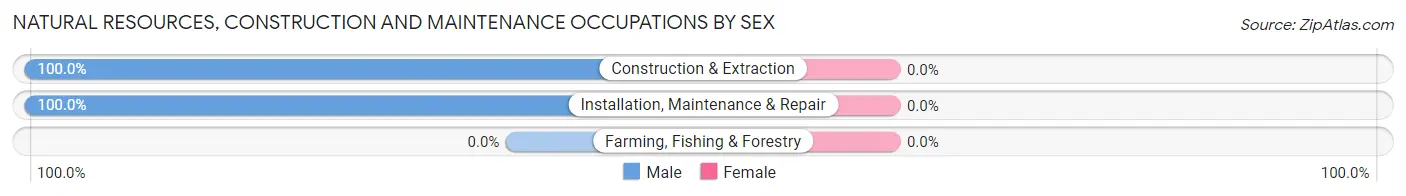
Natural Resources, Construction and Maintenance Occupations by Sex
| Occupation | Male | Female |
| Farming, Fishing & Forestry | 0 (0.0%) | 0 (0.0%) |
| Construction & Extraction | 121 (100.0%) | 0 (0.0%) |
| Installation, Maintenance & Repair | 113 (100.0%) | 0 (0.0%) |
| Total (Category) | 234 (100.0%) | 0 (0.0%) |
| Total (Overall) | 2,015 (52.3%) | 1,837 (47.7%) |
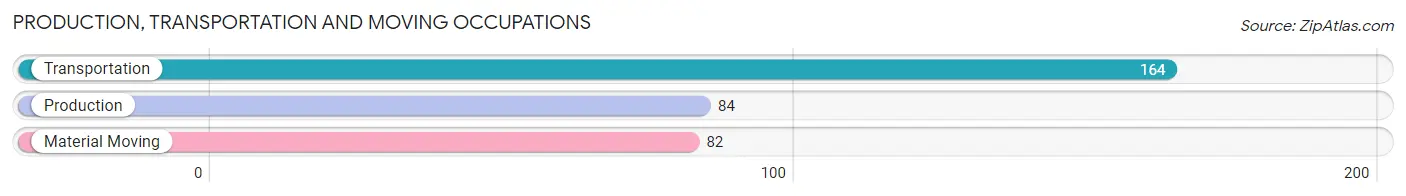
Production, Transportation and Moving Occupations
The most common Production, Transportation and Moving occupations in Pomona are Transportation (164 | 4.3%), Production (84 | 2.2%), and Material Moving (82 | 2.1%).
Production, Transportation and Moving Occupations by Sex
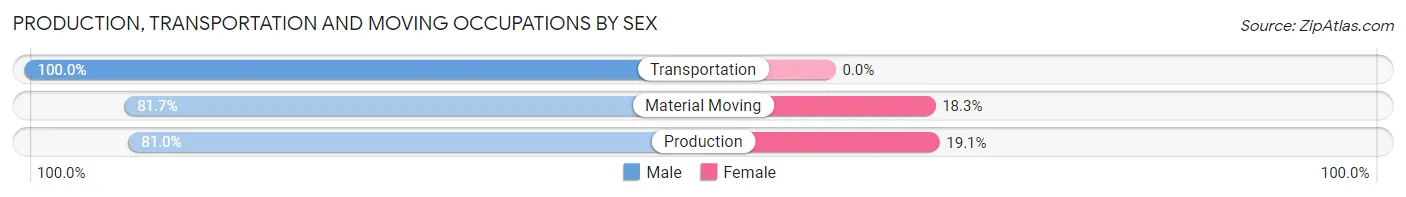
| Occupation | Male | Female |
| Production | 68 (80.9%) | 16 (19.1%) |
| Transportation | 164 (100.0%) | 0 (0.0%) |
| Material Moving | 67 (81.7%) | 15 (18.3%) |
| Total (Category) | 299 (90.6%) | 31 (9.4%) |
| Total (Overall) | 2,015 (52.3%) | 1,837 (47.7%) |
Employment Industries by Sex in Pomona
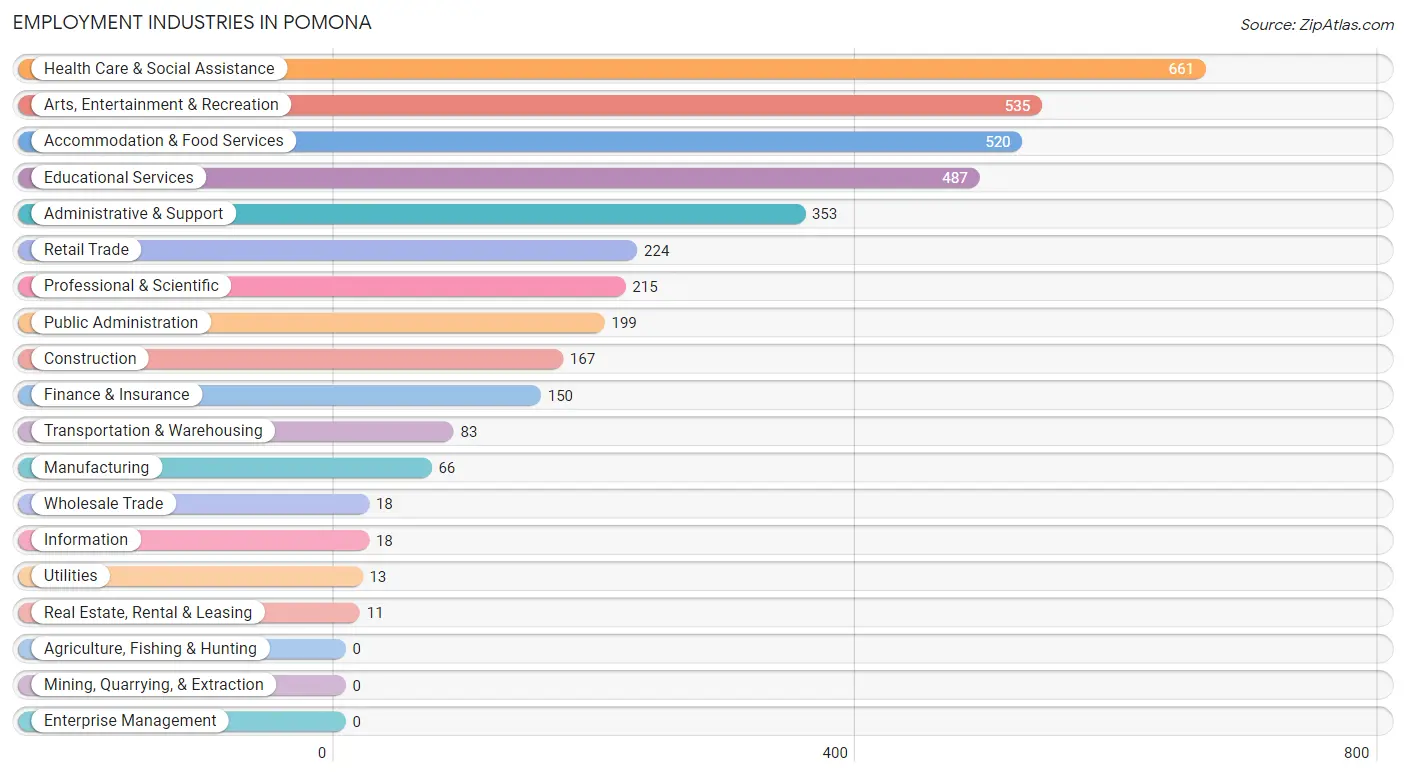
Employment Industries in Pomona
The major employment industries in Pomona include Health Care & Social Assistance (661 | 17.2%), Arts, Entertainment & Recreation (535 | 13.9%), Accommodation & Food Services (520 | 13.5%), Educational Services (487 | 12.6%), and Administrative & Support (353 | 9.2%).
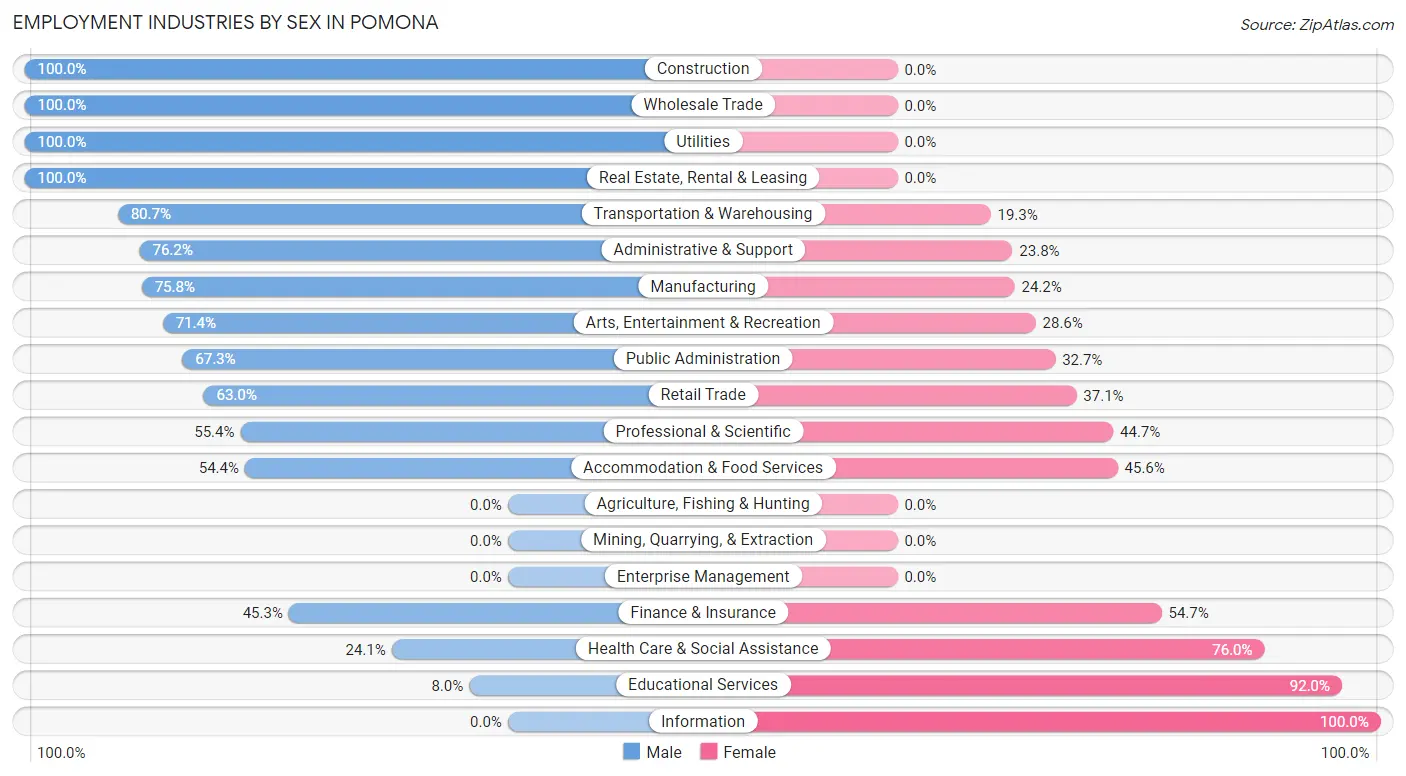
Employment Industries by Sex in Pomona
The Pomona industries that see more men than women are Construction (100.0%), Wholesale Trade (100.0%), and Utilities (100.0%), whereas the industries that tend to have a higher number of women are Information (100.0%), Educational Services (92.0%), and Health Care & Social Assistance (75.9%).
| Industry | Male | Female |
| Agriculture, Fishing & Hunting | 0 (0.0%) | 0 (0.0%) |
| Mining, Quarrying, & Extraction | 0 (0.0%) | 0 (0.0%) |
| Construction | 167 (100.0%) | 0 (0.0%) |
| Manufacturing | 50 (75.8%) | 16 (24.2%) |
| Wholesale Trade | 18 (100.0%) | 0 (0.0%) |
| Retail Trade | 141 (62.9%) | 83 (37.0%) |
| Transportation & Warehousing | 67 (80.7%) | 16 (19.3%) |
| Utilities | 13 (100.0%) | 0 (0.0%) |
| Information | 0 (0.0%) | 18 (100.0%) |
| Finance & Insurance | 68 (45.3%) | 82 (54.7%) |
| Real Estate, Rental & Leasing | 11 (100.0%) | 0 (0.0%) |
| Professional & Scientific | 119 (55.3%) | 96 (44.7%) |
| Enterprise Management | 0 (0.0%) | 0 (0.0%) |
| Administrative & Support | 269 (76.2%) | 84 (23.8%) |
| Educational Services | 39 (8.0%) | 448 (92.0%) |
| Health Care & Social Assistance | 159 (24.0%) | 502 (75.9%) |
| Arts, Entertainment & Recreation | 382 (71.4%) | 153 (28.6%) |
| Accommodation & Food Services | 283 (54.4%) | 237 (45.6%) |
| Public Administration | 134 (67.3%) | 65 (32.7%) |
| Total | 2,015 (52.3%) | 1,837 (47.7%) |
Education in Pomona
School Enrollment in Pomona
The most common levels of schooling among the 2,739 students in Pomona are elementary school (688 | 25.1%), high school (673 | 24.6%), and middle school (669 | 24.4%).
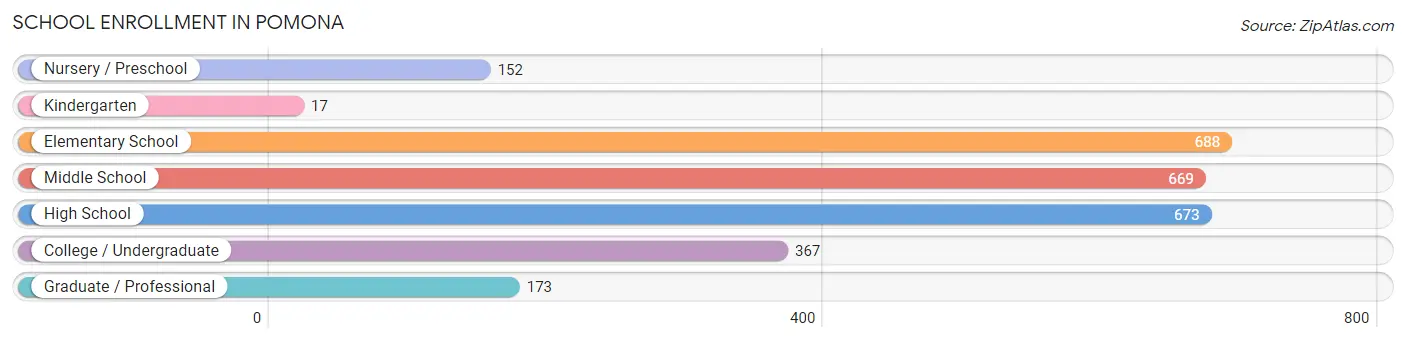
| School Level | # Students | % Students |
| Nursery / Preschool | 152 | 5.6% |
| Kindergarten | 17 | 0.6% |
| Elementary School | 688 | 25.1% |
| Middle School | 669 | 24.4% |
| High School | 673 | 24.6% |
| College / Undergraduate | 367 | 13.4% |
| Graduate / Professional | 173 | 6.3% |
| Total | 2,739 | 100.0% |
School Enrollment by Age by Funding Source in Pomona
Out of a total of 2,739 students who are enrolled in schools in Pomona, 463 (16.9%) attend a private institution, while the remaining 2,276 (83.1%) are enrolled in public schools. The age group of 35 years and over has the highest likelihood of being enrolled in private schools, with 74 (53.2% in the age bracket) enrolled. Conversely, the age group of 25 to 34 year olds has the lowest likelihood of being enrolled in a private school, with 204 (94.4% in the age bracket) attending a public institution.
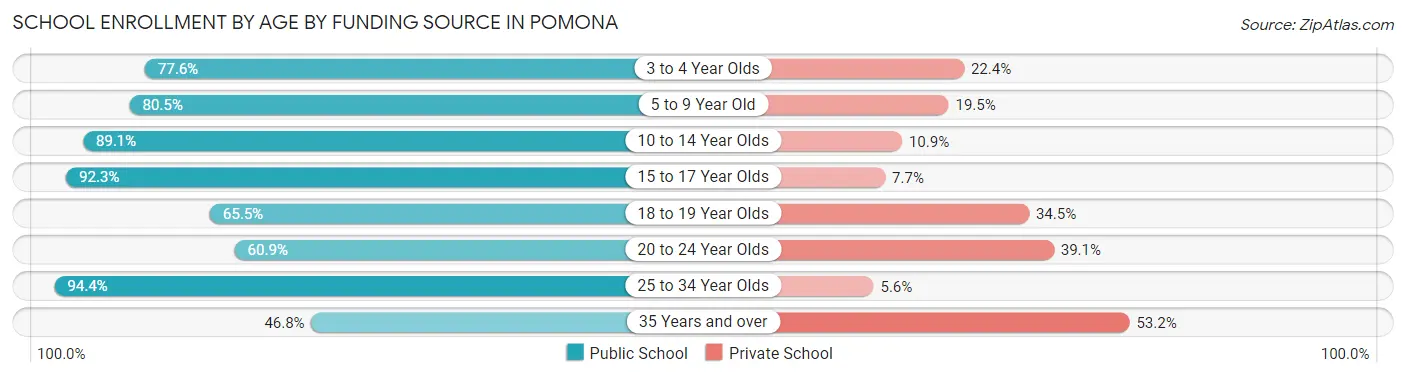
| Age Bracket | Public School | Private School |
| 3 to 4 Year Olds | 90 (77.6%) | 26 (22.4%) |
| 5 to 9 Year Old | 490 (80.5%) | 119 (19.5%) |
| 10 to 14 Year Olds | 845 (89.1%) | 103 (10.9%) |
| 15 to 17 Year Olds | 430 (92.3%) | 36 (7.7%) |
| 18 to 19 Year Olds | 55 (65.5%) | 29 (34.5%) |
| 20 to 24 Year Olds | 98 (60.9%) | 63 (39.1%) |
| 25 to 34 Year Olds | 204 (94.4%) | 12 (5.6%) |
| 35 Years and over | 65 (46.8%) | 74 (53.2%) |
| Total | 2,276 (83.1%) | 463 (16.9%) |
Educational Attainment by Field of Study in Pomona
Education (382 | 21.1%), bio, nature & agricultural (269 | 14.9%), business (207 | 11.4%), communications (146 | 8.1%), and social sciences (128 | 7.1%) are the most common fields of study among 1,810 individuals in Pomona who have obtained a bachelor's degree or higher.
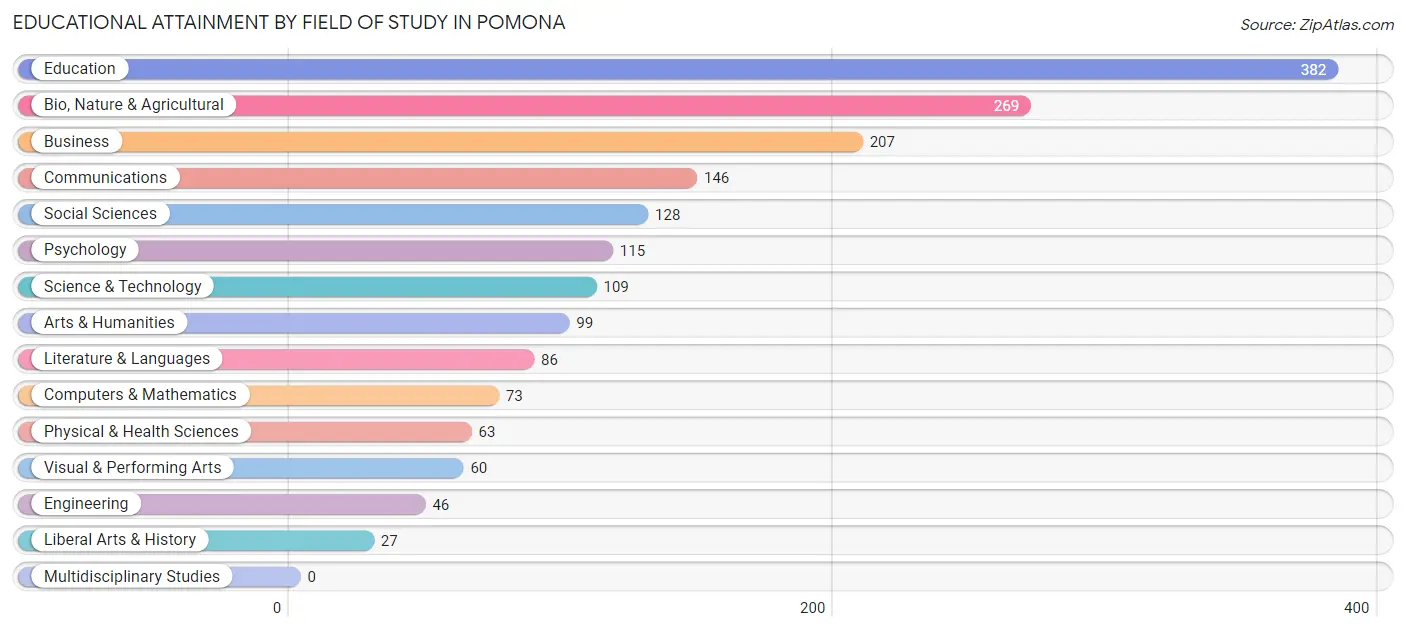
| Field of Study | # Graduates | % Graduates |
| Computers & Mathematics | 73 | 4.0% |
| Bio, Nature & Agricultural | 269 | 14.9% |
| Physical & Health Sciences | 63 | 3.5% |
| Psychology | 115 | 6.4% |
| Social Sciences | 128 | 7.1% |
| Engineering | 46 | 2.5% |
| Multidisciplinary Studies | 0 | 0.0% |
| Science & Technology | 109 | 6.0% |
| Business | 207 | 11.4% |
| Education | 382 | 21.1% |
| Literature & Languages | 86 | 4.8% |
| Liberal Arts & History | 27 | 1.5% |
| Visual & Performing Arts | 60 | 3.3% |
| Communications | 146 | 8.1% |
| Arts & Humanities | 99 | 5.5% |
| Total | 1,810 | 100.0% |
Transportation & Commute in Pomona
Vehicle Availability by Sex in Pomona
The most prevalent vehicle ownership categories in Pomona are males with 2 vehicles (761, accounting for 39.3%) and females with 2 vehicles (864, making up 41.8%).
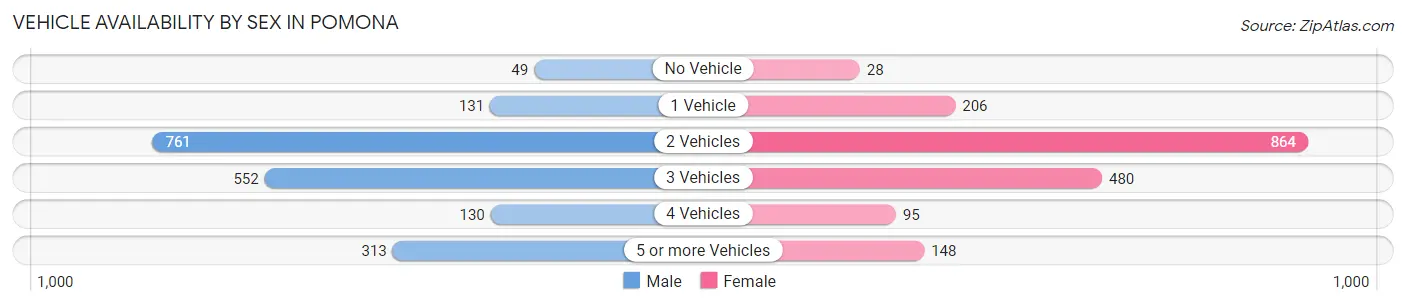
| Vehicles Available | Male | Female |
| No Vehicle | 49 (2.5%) | 28 (1.5%) |
| 1 Vehicle | 131 (6.8%) | 206 (11.3%) |
| 2 Vehicles | 761 (39.3%) | 864 (47.4%) |
| 3 Vehicles | 552 (28.5%) | 480 (26.4%) |
| 4 Vehicles | 130 (6.7%) | 95 (5.2%) |
| 5 or more Vehicles | 313 (16.2%) | 148 (8.1%) |
| Total | 1,936 (100.0%) | 1,821 (100.0%) |
Commute Time in Pomona
The most frequently occuring commute durations in Pomona are 15 to 19 minutes (885 commuters, 24.5%), 20 to 24 minutes (602 commuters, 16.7%), and 30 to 34 minutes (587 commuters, 16.3%).
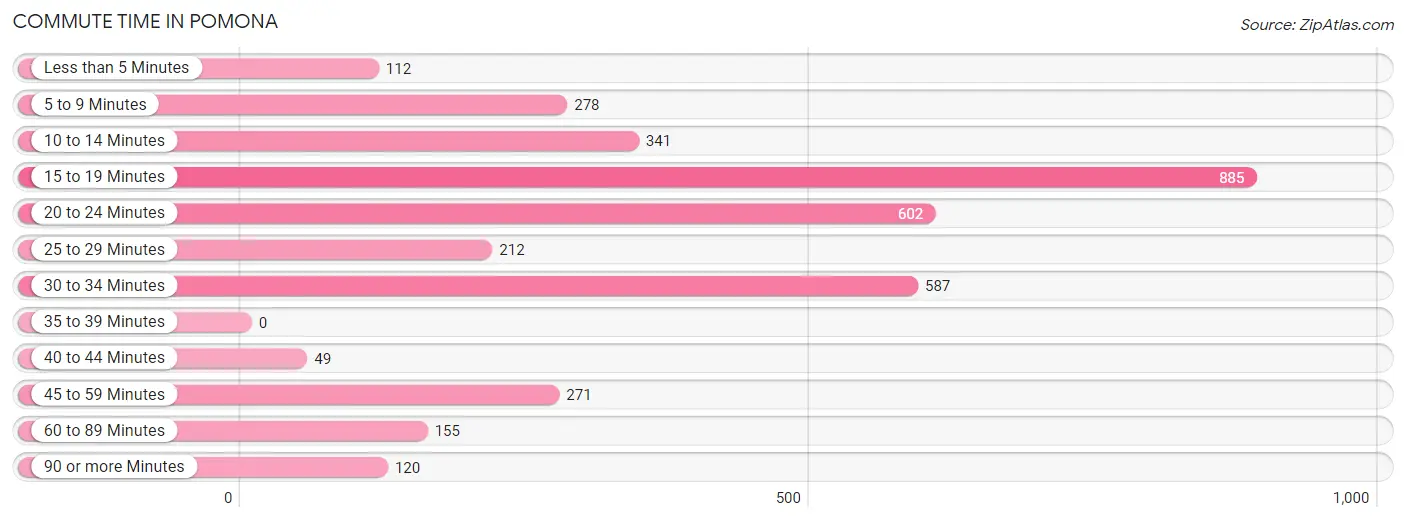
| Commute Time | # Commuters | % Commuters |
| Less than 5 Minutes | 112 | 3.1% |
| 5 to 9 Minutes | 278 | 7.7% |
| 10 to 14 Minutes | 341 | 9.4% |
| 15 to 19 Minutes | 885 | 24.5% |
| 20 to 24 Minutes | 602 | 16.7% |
| 25 to 29 Minutes | 212 | 5.9% |
| 30 to 34 Minutes | 587 | 16.3% |
| 35 to 39 Minutes | 0 | 0.0% |
| 40 to 44 Minutes | 49 | 1.4% |
| 45 to 59 Minutes | 271 | 7.5% |
| 60 to 89 Minutes | 155 | 4.3% |
| 90 or more Minutes | 120 | 3.3% |
Commute Time by Sex in Pomona
The most common commute times in Pomona are 15 to 19 minutes (430 commuters, 22.8%) for males and 15 to 19 minutes (455 commuters, 26.4%) for females.
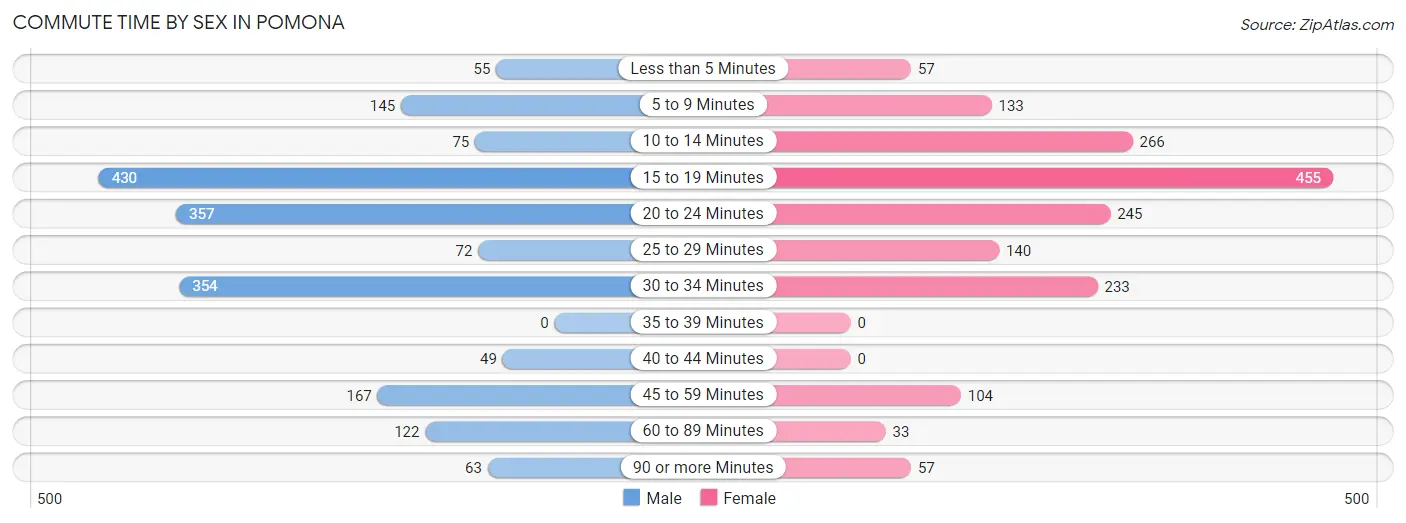
| Commute Time | Male | Female |
| Less than 5 Minutes | 55 (2.9%) | 57 (3.3%) |
| 5 to 9 Minutes | 145 (7.7%) | 133 (7.7%) |
| 10 to 14 Minutes | 75 (4.0%) | 266 (15.4%) |
| 15 to 19 Minutes | 430 (22.8%) | 455 (26.4%) |
| 20 to 24 Minutes | 357 (18.9%) | 245 (14.2%) |
| 25 to 29 Minutes | 72 (3.8%) | 140 (8.1%) |
| 30 to 34 Minutes | 354 (18.7%) | 233 (13.5%) |
| 35 to 39 Minutes | 0 (0.0%) | 0 (0.0%) |
| 40 to 44 Minutes | 49 (2.6%) | 0 (0.0%) |
| 45 to 59 Minutes | 167 (8.8%) | 104 (6.0%) |
| 60 to 89 Minutes | 122 (6.5%) | 33 (1.9%) |
| 90 or more Minutes | 63 (3.3%) | 57 (3.3%) |
Time of Departure to Work by Sex in Pomona
The most frequent times of departure to work in Pomona are 4:00 PM to 11:59 PM (479, 25.4%) for males and 8:00 AM to 8:29 AM (490, 28.4%) for females.
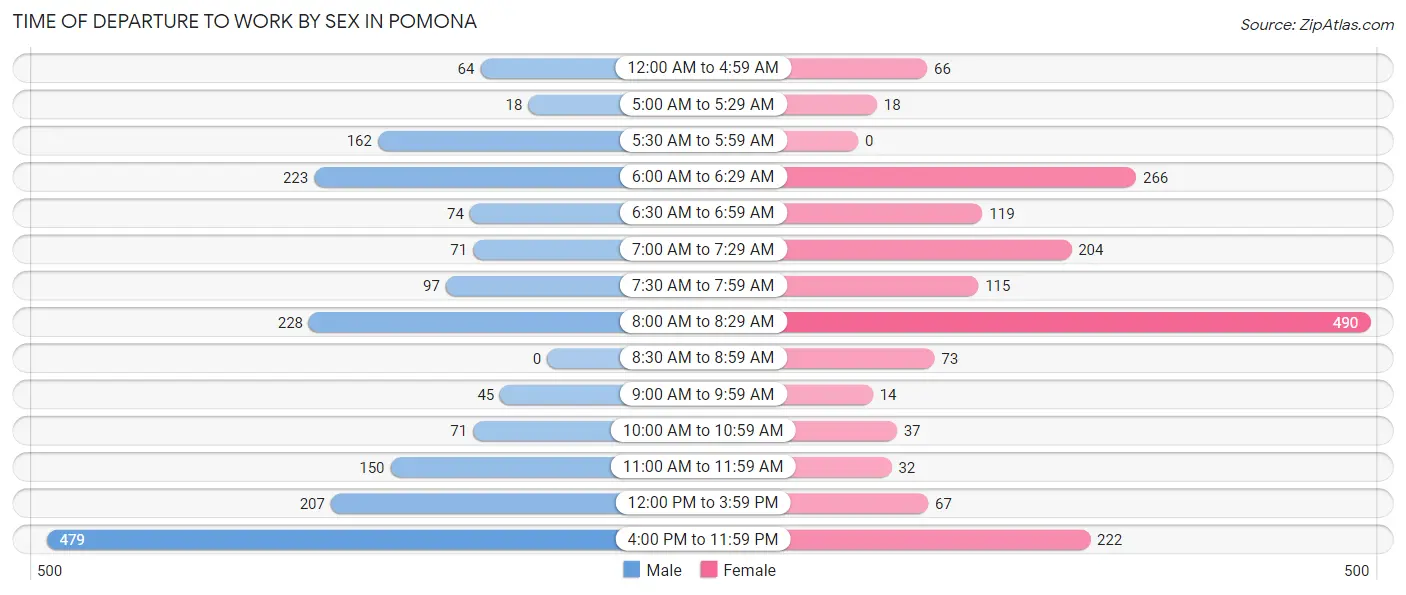
| Time of Departure | Male | Female |
| 12:00 AM to 4:59 AM | 64 (3.4%) | 66 (3.8%) |
| 5:00 AM to 5:29 AM | 18 (0.9%) | 18 (1.0%) |
| 5:30 AM to 5:59 AM | 162 (8.6%) | 0 (0.0%) |
| 6:00 AM to 6:29 AM | 223 (11.8%) | 266 (15.4%) |
| 6:30 AM to 6:59 AM | 74 (3.9%) | 119 (6.9%) |
| 7:00 AM to 7:29 AM | 71 (3.8%) | 204 (11.8%) |
| 7:30 AM to 7:59 AM | 97 (5.1%) | 115 (6.7%) |
| 8:00 AM to 8:29 AM | 228 (12.1%) | 490 (28.4%) |
| 8:30 AM to 8:59 AM | 0 (0.0%) | 73 (4.2%) |
| 9:00 AM to 9:59 AM | 45 (2.4%) | 14 (0.8%) |
| 10:00 AM to 10:59 AM | 71 (3.8%) | 37 (2.1%) |
| 11:00 AM to 11:59 AM | 150 (7.9%) | 32 (1.9%) |
| 12:00 PM to 3:59 PM | 207 (11.0%) | 67 (3.9%) |
| 4:00 PM to 11:59 PM | 479 (25.4%) | 222 (12.9%) |
| Total | 1,889 (100.0%) | 1,723 (100.0%) |
Housing Occupancy in Pomona
Occupancy by Ownership in Pomona
Of the total 2,446 dwellings in Pomona, owner-occupied units account for 2,019 (82.5%), while renter-occupied units make up 427 (17.5%).
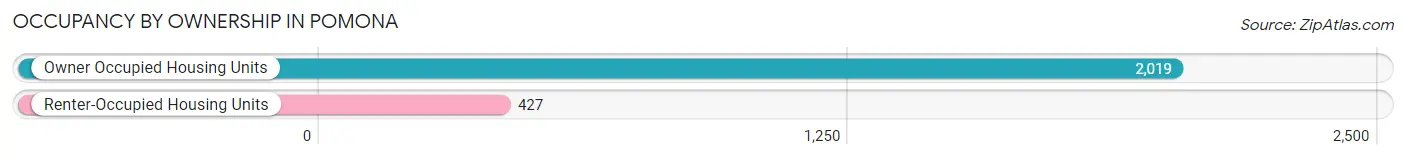
| Occupancy | # Housing Units | % Housing Units |
| Owner Occupied Housing Units | 2,019 | 82.5% |
| Renter-Occupied Housing Units | 427 | 17.5% |
| Total Occupied Housing Units | 2,446 | 100.0% |
Occupancy by Household Size in Pomona
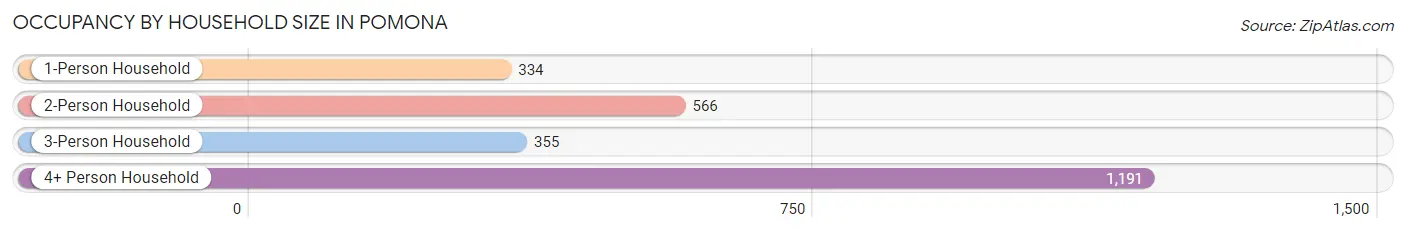
| Household Size | # Housing Units | % Housing Units |
| 1-Person Household | 334 | 13.7% |
| 2-Person Household | 566 | 23.1% |
| 3-Person Household | 355 | 14.5% |
| 4+ Person Household | 1,191 | 48.7% |
| Total Housing Units | 2,446 | 100.0% |
Occupancy by Ownership by Household Size in Pomona
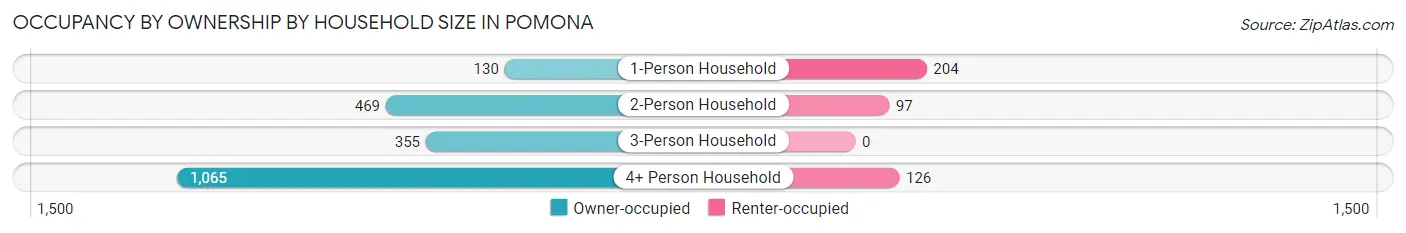
| Household Size | Owner-occupied | Renter-occupied |
| 1-Person Household | 130 (38.9%) | 204 (61.1%) |
| 2-Person Household | 469 (82.9%) | 97 (17.1%) |
| 3-Person Household | 355 (100.0%) | 0 (0.0%) |
| 4+ Person Household | 1,065 (89.4%) | 126 (10.6%) |
| Total Housing Units | 2,019 (82.5%) | 427 (17.5%) |
Occupancy by Educational Attainment in Pomona
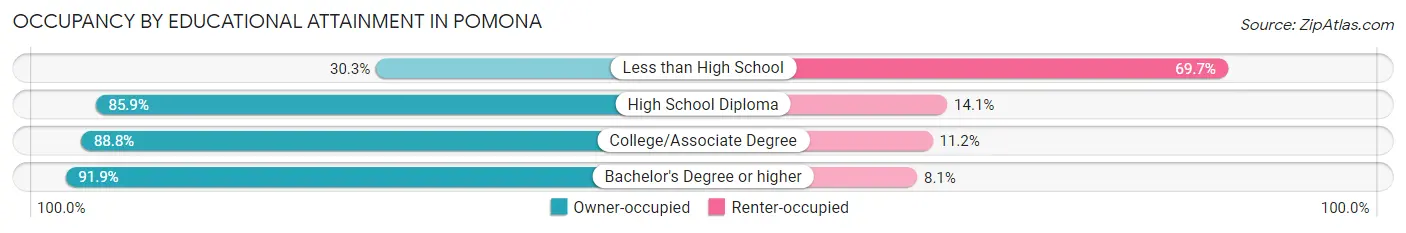
| Household Size | Owner-occupied | Renter-occupied |
| Less than High School | 84 (30.3%) | 193 (69.7%) |
| High School Diploma | 507 (85.9%) | 83 (14.1%) |
| College/Associate Degree | 668 (88.8%) | 84 (11.2%) |
| Bachelor's Degree or higher | 760 (91.9%) | 67 (8.1%) |
Occupancy by Age of Householder in Pomona
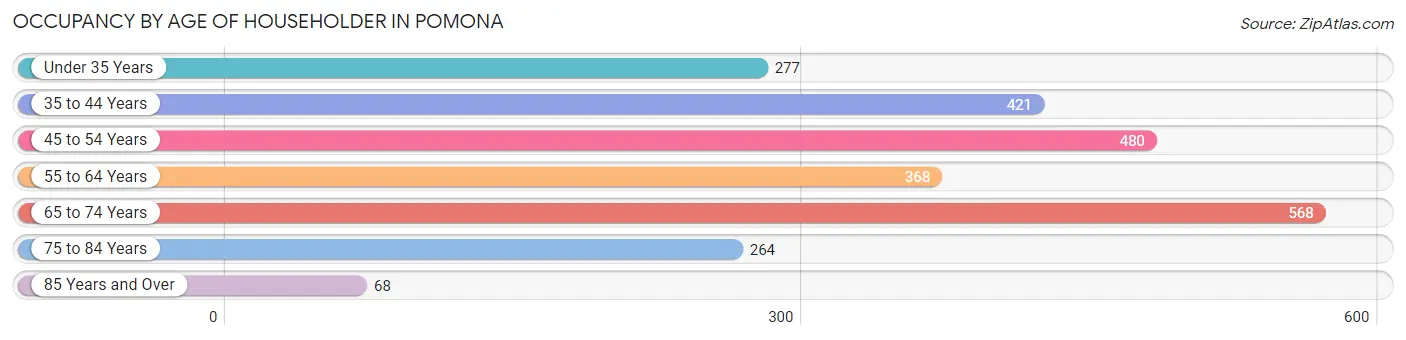
| Age Bracket | # Households | % Households |
| Under 35 Years | 277 | 11.3% |
| 35 to 44 Years | 421 | 17.2% |
| 45 to 54 Years | 480 | 19.6% |
| 55 to 64 Years | 368 | 15.0% |
| 65 to 74 Years | 568 | 23.2% |
| 75 to 84 Years | 264 | 10.8% |
| 85 Years and Over | 68 | 2.8% |
| Total | 2,446 | 100.0% |
Housing Finances in Pomona
Median Income by Occupancy in Pomona
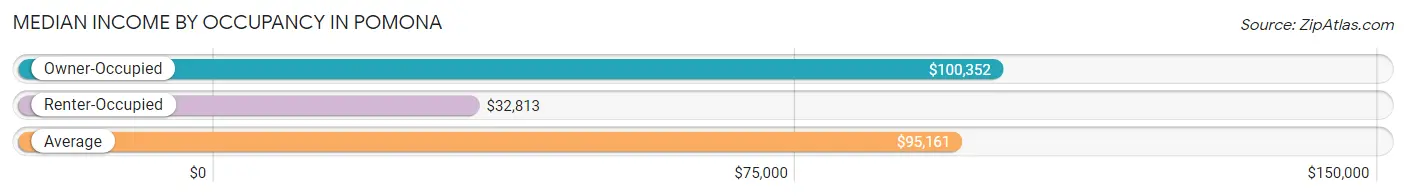
| Occupancy Type | # Households | Median Income |
| Owner-Occupied | 2,019 (82.5%) | $100,352 |
| Renter-Occupied | 427 (17.5%) | $32,813 |
| Average | 2,446 (100.0%) | $95,161 |
Occupancy by Householder Income Bracket in Pomona
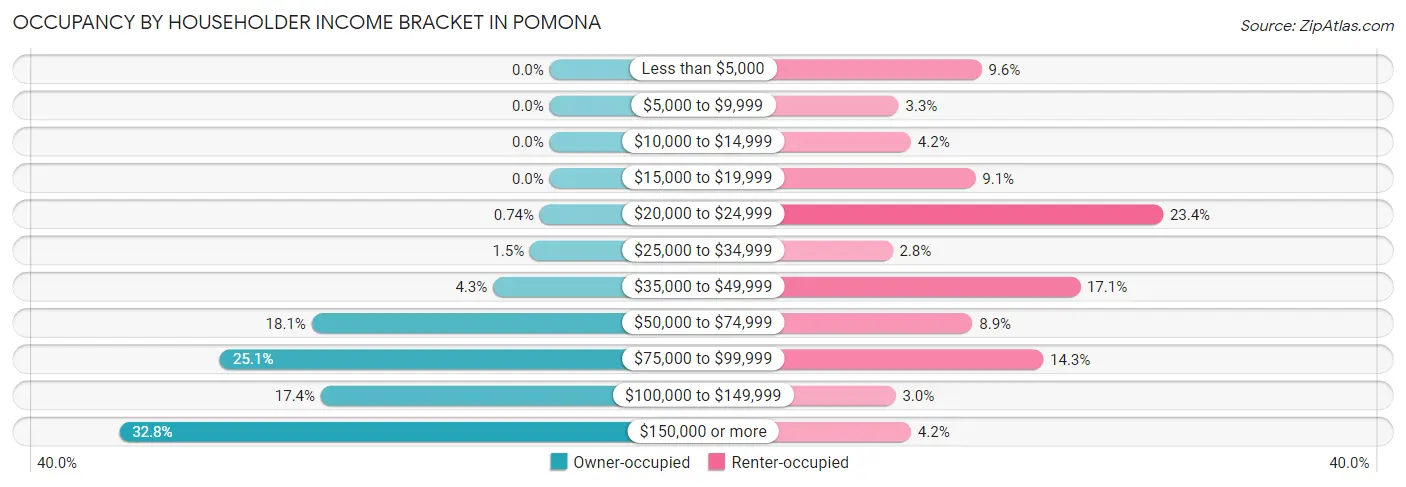
| Income Bracket | Owner-occupied | Renter-occupied |
| Less than $5,000 | 0 (0.0%) | 41 (9.6%) |
| $5,000 to $9,999 | 0 (0.0%) | 14 (3.3%) |
| $10,000 to $14,999 | 0 (0.0%) | 18 (4.2%) |
| $15,000 to $19,999 | 0 (0.0%) | 39 (9.1%) |
| $20,000 to $24,999 | 15 (0.7%) | 100 (23.4%) |
| $25,000 to $34,999 | 30 (1.5%) | 12 (2.8%) |
| $35,000 to $49,999 | 87 (4.3%) | 73 (17.1%) |
| $50,000 to $74,999 | 366 (18.1%) | 38 (8.9%) |
| $75,000 to $99,999 | 507 (25.1%) | 61 (14.3%) |
| $100,000 to $149,999 | 352 (17.4%) | 13 (3.0%) |
| $150,000 or more | 662 (32.8%) | 18 (4.2%) |
| Total | 2,019 (100.0%) | 427 (100.0%) |
Monthly Housing Cost Tiers in Pomona
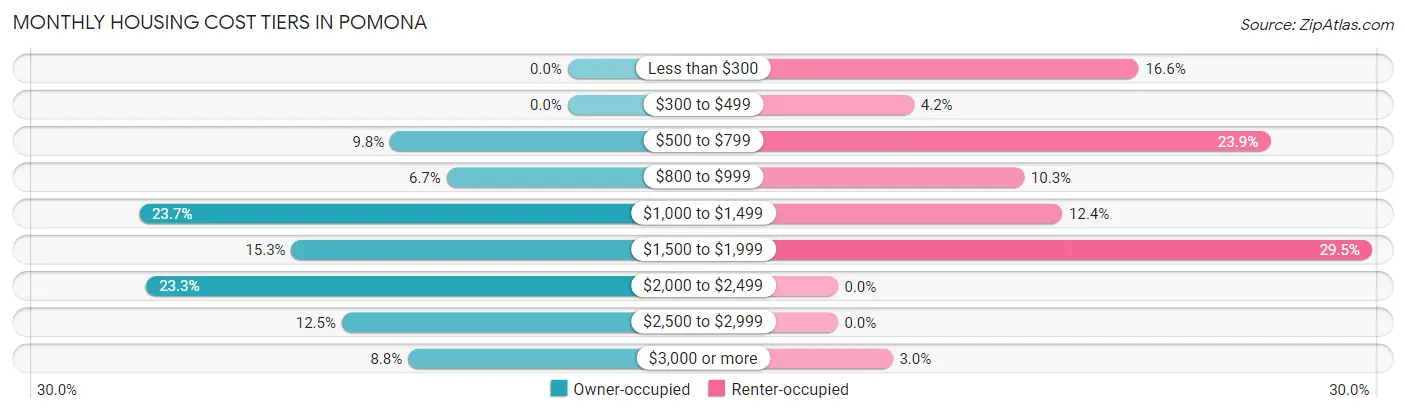
| Monthly Cost | Owner-occupied | Renter-occupied |
| Less than $300 | 0 (0.0%) | 71 (16.6%) |
| $300 to $499 | 0 (0.0%) | 18 (4.2%) |
| $500 to $799 | 198 (9.8%) | 102 (23.9%) |
| $800 to $999 | 135 (6.7%) | 44 (10.3%) |
| $1,000 to $1,499 | 478 (23.7%) | 53 (12.4%) |
| $1,500 to $1,999 | 308 (15.3%) | 126 (29.5%) |
| $2,000 to $2,499 | 470 (23.3%) | 0 (0.0%) |
| $2,500 to $2,999 | 252 (12.5%) | 0 (0.0%) |
| $3,000 or more | 178 (8.8%) | 13 (3.0%) |
| Total | 2,019 (100.0%) | 427 (100.0%) |
Physical Housing Characteristics in Pomona
Housing Structures in Pomona
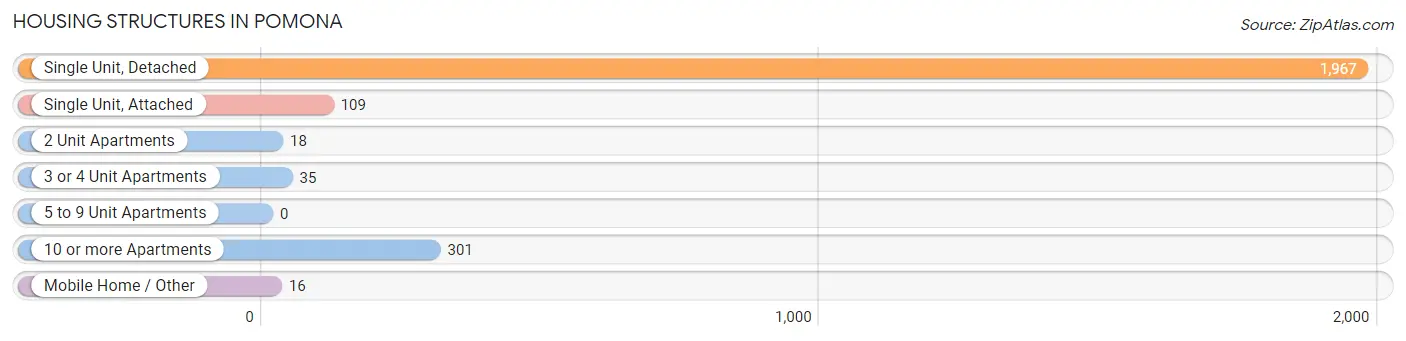
| Structure Type | # Housing Units | % Housing Units |
| Single Unit, Detached | 1,967 | 80.4% |
| Single Unit, Attached | 109 | 4.5% |
| 2 Unit Apartments | 18 | 0.7% |
| 3 or 4 Unit Apartments | 35 | 1.4% |
| 5 to 9 Unit Apartments | 0 | 0.0% |
| 10 or more Apartments | 301 | 12.3% |
| Mobile Home / Other | 16 | 0.6% |
| Total | 2,446 | 100.0% |
Housing Structures by Occupancy in Pomona
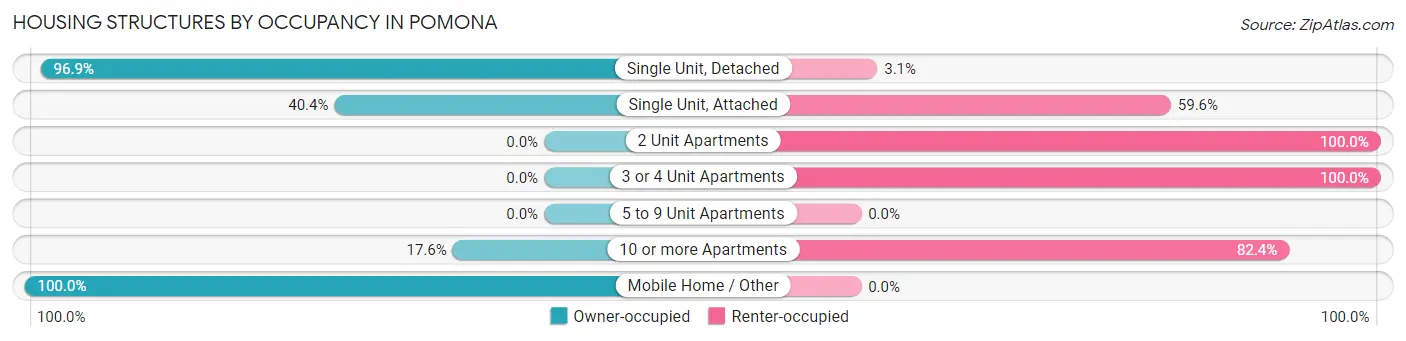
| Structure Type | Owner-occupied | Renter-occupied |
| Single Unit, Detached | 1,906 (96.9%) | 61 (3.1%) |
| Single Unit, Attached | 44 (40.4%) | 65 (59.6%) |
| 2 Unit Apartments | 0 (0.0%) | 18 (100.0%) |
| 3 or 4 Unit Apartments | 0 (0.0%) | 35 (100.0%) |
| 5 to 9 Unit Apartments | 0 (0.0%) | 0 (0.0%) |
| 10 or more Apartments | 53 (17.6%) | 248 (82.4%) |
| Mobile Home / Other | 16 (100.0%) | 0 (0.0%) |
| Total | 2,019 (82.5%) | 427 (17.5%) |
Housing Structures by Number of Rooms in Pomona
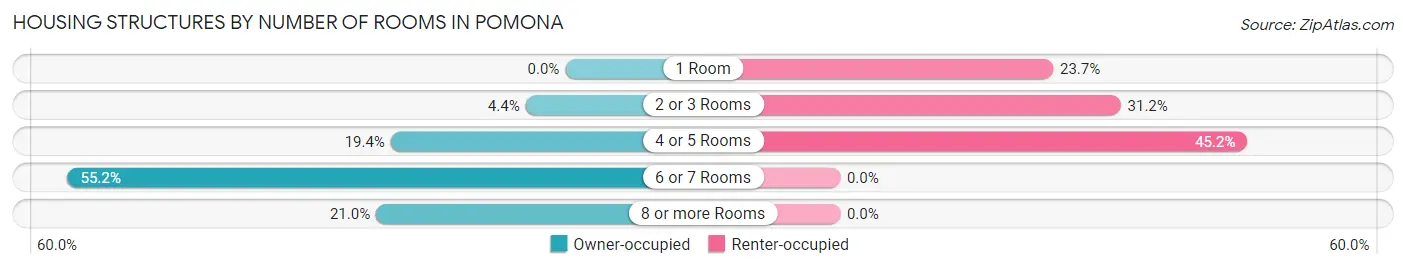
| Number of Rooms | Owner-occupied | Renter-occupied |
| 1 Room | 0 (0.0%) | 101 (23.6%) |
| 2 or 3 Rooms | 89 (4.4%) | 133 (31.1%) |
| 4 or 5 Rooms | 391 (19.4%) | 193 (45.2%) |
| 6 or 7 Rooms | 1,115 (55.2%) | 0 (0.0%) |
| 8 or more Rooms | 424 (21.0%) | 0 (0.0%) |
| Total | 2,019 (100.0%) | 427 (100.0%) |
Housing Structure by Heating Type in Pomona
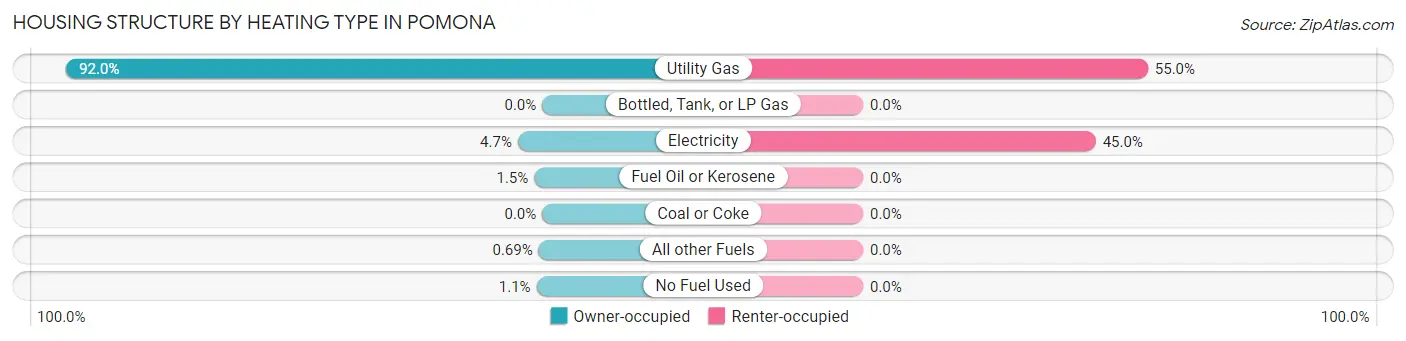
| Heating Type | Owner-occupied | Renter-occupied |
| Utility Gas | 1,857 (92.0%) | 235 (55.0%) |
| Bottled, Tank, or LP Gas | 0 (0.0%) | 0 (0.0%) |
| Electricity | 95 (4.7%) | 192 (45.0%) |
| Fuel Oil or Kerosene | 31 (1.5%) | 0 (0.0%) |
| Coal or Coke | 0 (0.0%) | 0 (0.0%) |
| All other Fuels | 14 (0.7%) | 0 (0.0%) |
| No Fuel Used | 22 (1.1%) | 0 (0.0%) |
| Total | 2,019 (100.0%) | 427 (100.0%) |
Household Vehicle Usage in Pomona
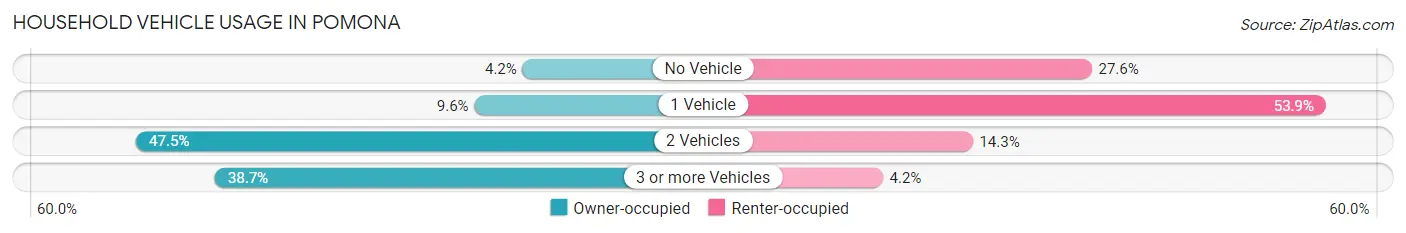
| Vehicles per Household | Owner-occupied | Renter-occupied |
| No Vehicle | 85 (4.2%) | 118 (27.6%) |
| 1 Vehicle | 194 (9.6%) | 230 (53.9%) |
| 2 Vehicles | 959 (47.5%) | 61 (14.3%) |
| 3 or more Vehicles | 781 (38.7%) | 18 (4.2%) |
| Total | 2,019 (100.0%) | 427 (100.0%) |
Real Estate & Mortgages in Pomona
Real Estate and Mortgage Overview in Pomona
| Characteristic | Without Mortgage | With Mortgage |
| Housing Units | 608 | 1,411 |
| Median Property Value | $226,000 | $241,800 |
| Median Household Income | $107,941 | $460 |
| Monthly Housing Costs | $899 | $164 |
| Real Estate Taxes | $6,724 | $98 |
Property Value by Mortgage Status in Pomona
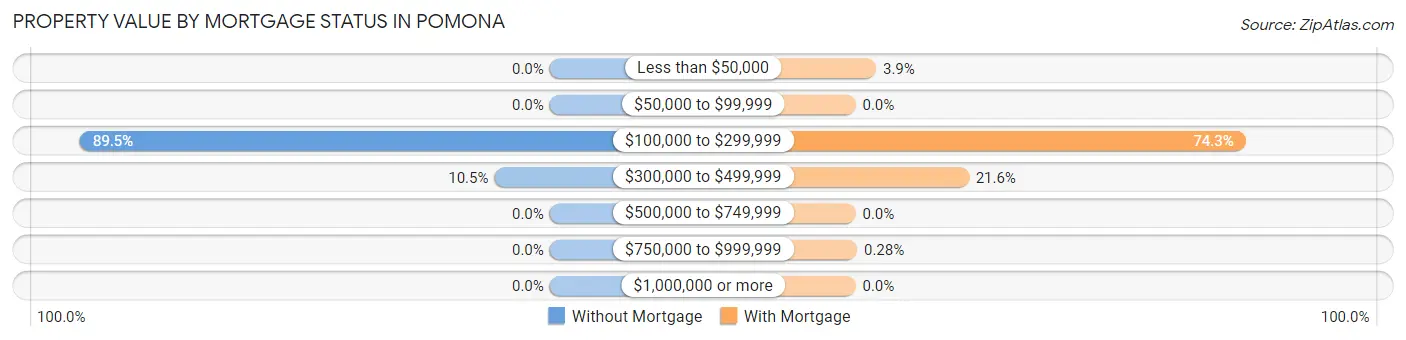
| Property Value | Without Mortgage | With Mortgage |
| Less than $50,000 | 0 (0.0%) | 55 (3.9%) |
| $50,000 to $99,999 | 0 (0.0%) | 0 (0.0%) |
| $100,000 to $299,999 | 544 (89.5%) | 1,048 (74.3%) |
| $300,000 to $499,999 | 64 (10.5%) | 304 (21.5%) |
| $500,000 to $749,999 | 0 (0.0%) | 0 (0.0%) |
| $750,000 to $999,999 | 0 (0.0%) | 4 (0.3%) |
| $1,000,000 or more | 0 (0.0%) | 0 (0.0%) |
| Total | 608 (100.0%) | 1,411 (100.0%) |
Household Income by Mortgage Status in Pomona
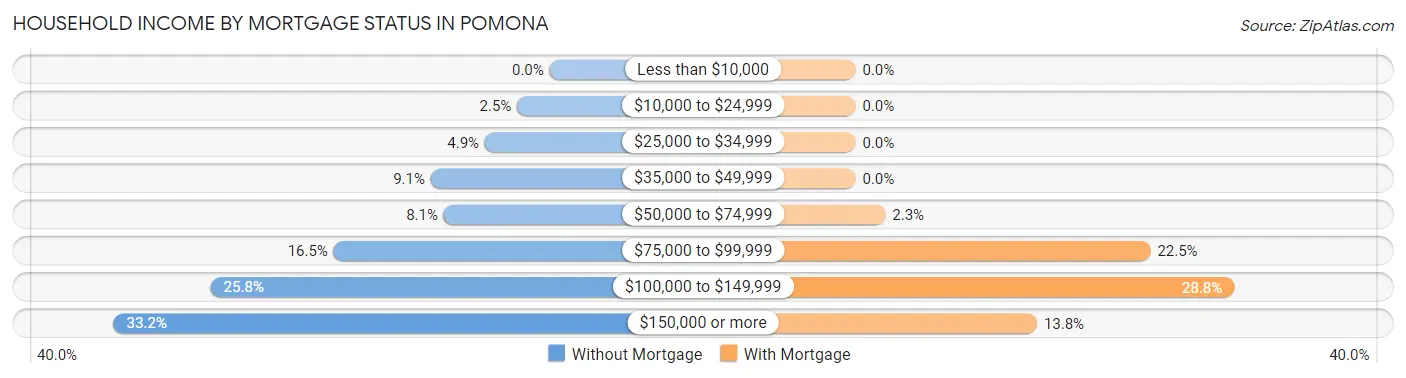
| Household Income | Without Mortgage | With Mortgage |
| Less than $10,000 | 0 (0.0%) | 0 (0.0%) |
| $10,000 to $24,999 | 15 (2.5%) | 0 (0.0%) |
| $25,000 to $34,999 | 30 (4.9%) | 0 (0.0%) |
| $35,000 to $49,999 | 55 (9.0%) | 0 (0.0%) |
| $50,000 to $74,999 | 49 (8.1%) | 32 (2.3%) |
| $75,000 to $99,999 | 100 (16.5%) | 317 (22.5%) |
| $100,000 to $149,999 | 157 (25.8%) | 407 (28.8%) |
| $150,000 or more | 202 (33.2%) | 195 (13.8%) |
| Total | 608 (100.0%) | 1,411 (100.0%) |
Property Value to Household Income Ratio in Pomona
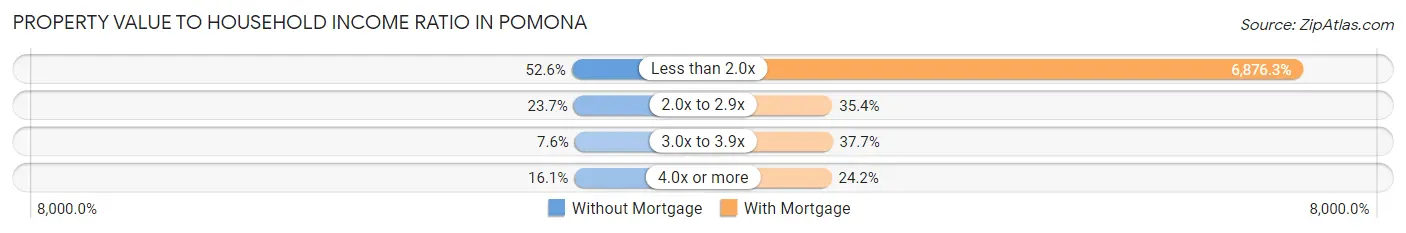
| Value-to-Income Ratio | Without Mortgage | With Mortgage |
| Less than 2.0x | 320 (52.6%) | 97,025 (6,876.3%) |
| 2.0x to 2.9x | 144 (23.7%) | 500 (35.4%) |
| 3.0x to 3.9x | 46 (7.6%) | 532 (37.7%) |
| 4.0x or more | 98 (16.1%) | 341 (24.2%) |
| Total | 608 (100.0%) | 1,411 (100.0%) |
Real Estate Taxes by Mortgage Status in Pomona
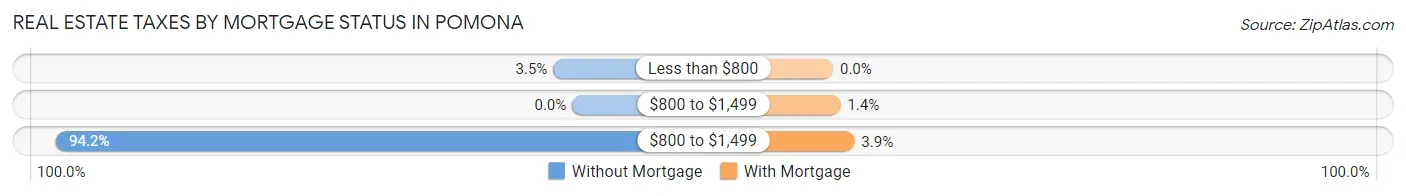
| Property Taxes | Without Mortgage | With Mortgage |
| Less than $800 | 21 (3.5%) | 0 (0.0%) |
| $800 to $1,499 | 0 (0.0%) | 19 (1.3%) |
| $800 to $1,499 | 573 (94.2%) | 55 (3.9%) |
| Total | 608 (100.0%) | 1,411 (100.0%) |
Health & Disability in Pomona
Health Insurance Coverage by Age in Pomona
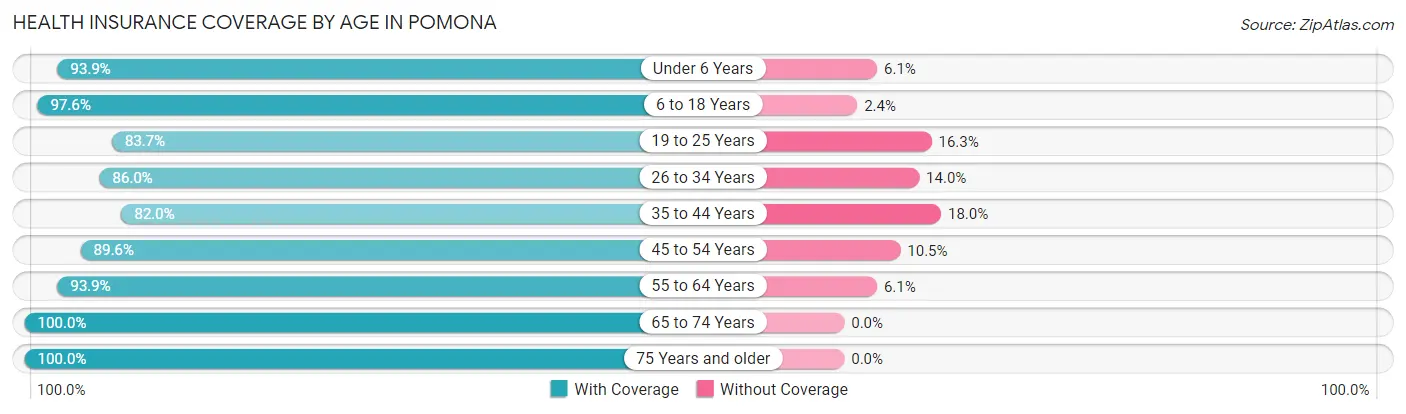
| Age Bracket | With Coverage | Without Coverage |
| Under 6 Years | 399 (93.9%) | 26 (6.1%) |
| 6 to 18 Years | 1,981 (97.6%) | 49 (2.4%) |
| 19 to 25 Years | 664 (83.7%) | 129 (16.3%) |
| 26 to 34 Years | 801 (86.0%) | 130 (14.0%) |
| 35 to 44 Years | 736 (82.0%) | 162 (18.0%) |
| 45 to 54 Years | 840 (89.5%) | 98 (10.4%) |
| 55 to 64 Years | 877 (93.9%) | 57 (6.1%) |
| 65 to 74 Years | 849 (100.0%) | 0 (0.0%) |
| 75 Years and older | 697 (100.0%) | 0 (0.0%) |
| Total | 7,844 (92.3%) | 651 (7.7%) |
Health Insurance Coverage by Citizenship Status in Pomona
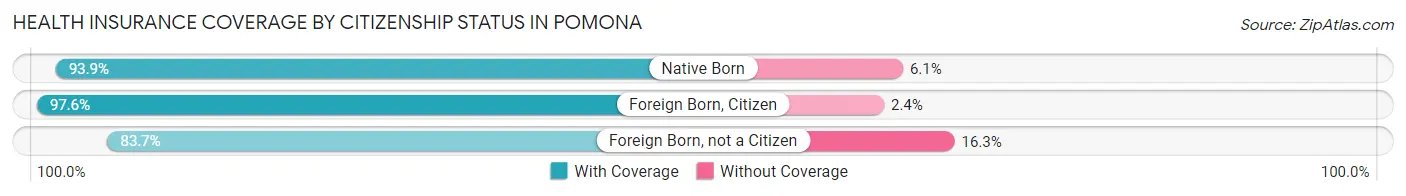
| Citizenship Status | With Coverage | Without Coverage |
| Native Born | 399 (93.9%) | 26 (6.1%) |
| Foreign Born, Citizen | 1,981 (97.6%) | 49 (2.4%) |
| Foreign Born, not a Citizen | 664 (83.7%) | 129 (16.3%) |
Health Insurance Coverage by Household Income in Pomona
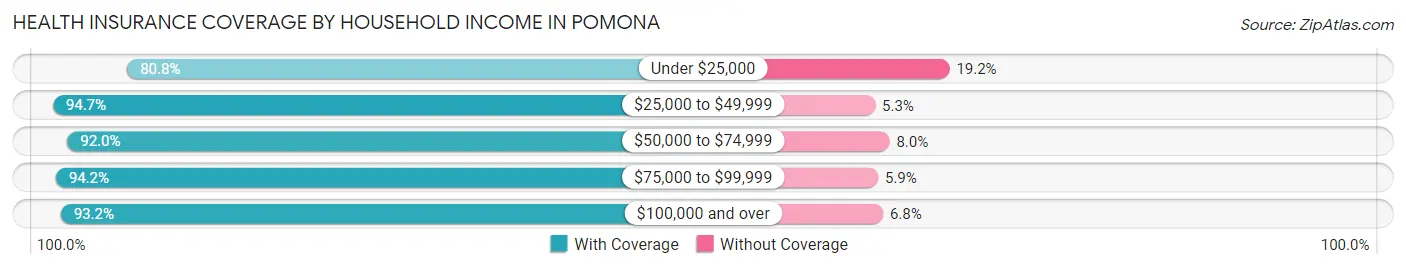
| Household Income | With Coverage | Without Coverage |
| Under $25,000 | 504 (80.8%) | 120 (19.2%) |
| $25,000 to $49,999 | 304 (94.7%) | 17 (5.3%) |
| $50,000 to $74,999 | 1,529 (92.0%) | 133 (8.0%) |
| $75,000 to $99,999 | 1,801 (94.2%) | 112 (5.9%) |
| $100,000 and over | 3,699 (93.2%) | 269 (6.8%) |
Public vs Private Health Insurance Coverage by Age in Pomona
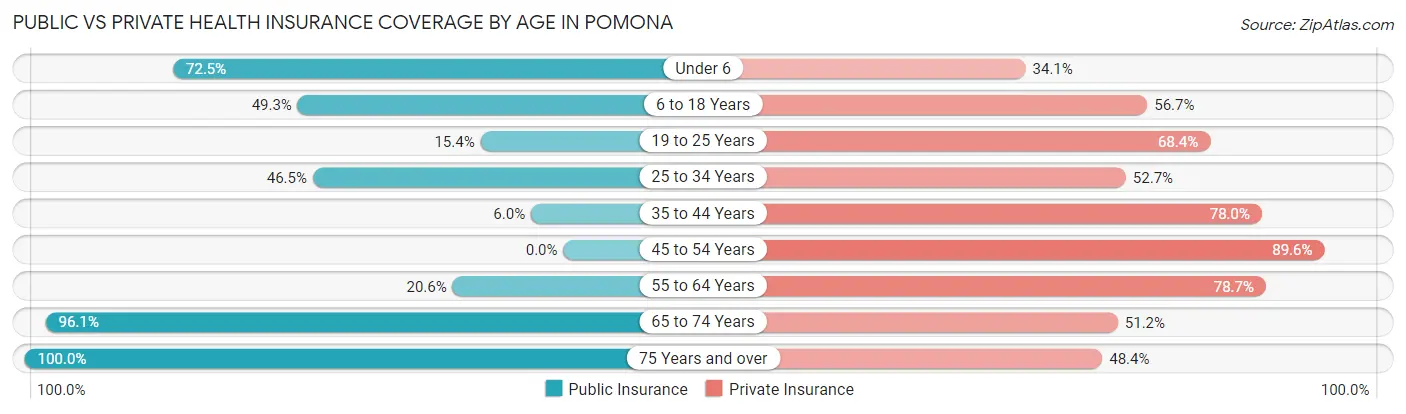
| Age Bracket | Public Insurance | Private Insurance |
| Under 6 | 308 (72.5%) | 145 (34.1%) |
| 6 to 18 Years | 1,001 (49.3%) | 1,151 (56.7%) |
| 19 to 25 Years | 122 (15.4%) | 542 (68.3%) |
| 25 to 34 Years | 433 (46.5%) | 491 (52.7%) |
| 35 to 44 Years | 54 (6.0%) | 700 (77.9%) |
| 45 to 54 Years | 0 (0.0%) | 840 (89.5%) |
| 55 to 64 Years | 192 (20.6%) | 735 (78.7%) |
| 65 to 74 Years | 816 (96.1%) | 435 (51.2%) |
| 75 Years and over | 697 (100.0%) | 337 (48.3%) |
| Total | 3,623 (42.6%) | 5,376 (63.3%) |
Disability Status by Sex by Age in Pomona
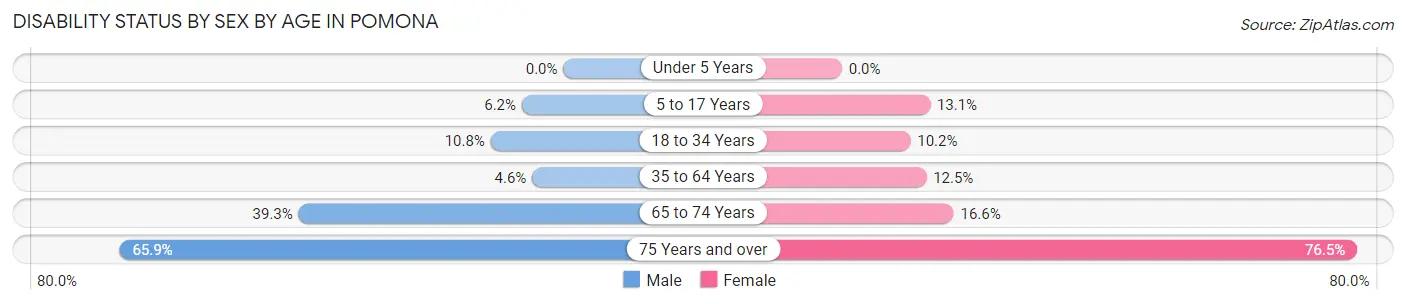
| Age Bracket | Male | Female |
| Under 5 Years | 0 (0.0%) | 0 (0.0%) |
| 5 to 17 Years | 63 (6.2%) | 131 (13.1%) |
| 18 to 34 Years | 97 (10.8%) | 90 (10.2%) |
| 35 to 64 Years | 57 (4.6%) | 193 (12.5%) |
| 65 to 74 Years | 149 (39.3%) | 78 (16.6%) |
| 75 Years and over | 232 (65.9%) | 264 (76.5%) |
Disability Class by Sex by Age in Pomona
Disability Class: Hearing Difficulty
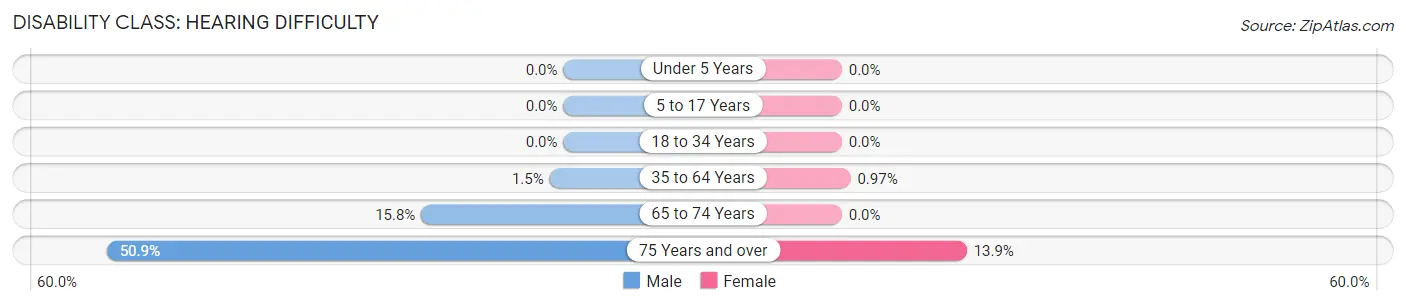
| Age Bracket | Male | Female |
| Under 5 Years | 0 (0.0%) | 0 (0.0%) |
| 5 to 17 Years | 0 (0.0%) | 0 (0.0%) |
| 18 to 34 Years | 0 (0.0%) | 0 (0.0%) |
| 35 to 64 Years | 19 (1.5%) | 15 (1.0%) |
| 65 to 74 Years | 60 (15.8%) | 0 (0.0%) |
| 75 Years and over | 179 (50.8%) | 48 (13.9%) |
Disability Class: Vision Difficulty
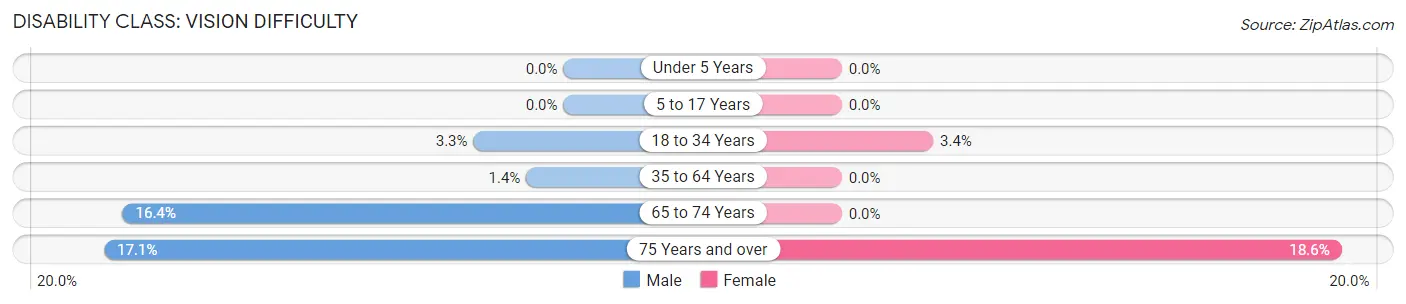
| Age Bracket | Male | Female |
| Under 5 Years | 0 (0.0%) | 0 (0.0%) |
| 5 to 17 Years | 0 (0.0%) | 0 (0.0%) |
| 18 to 34 Years | 30 (3.3%) | 30 (3.4%) |
| 35 to 64 Years | 17 (1.4%) | 0 (0.0%) |
| 65 to 74 Years | 62 (16.4%) | 0 (0.0%) |
| 75 Years and over | 60 (17.1%) | 64 (18.5%) |
Disability Class: Cognitive Difficulty
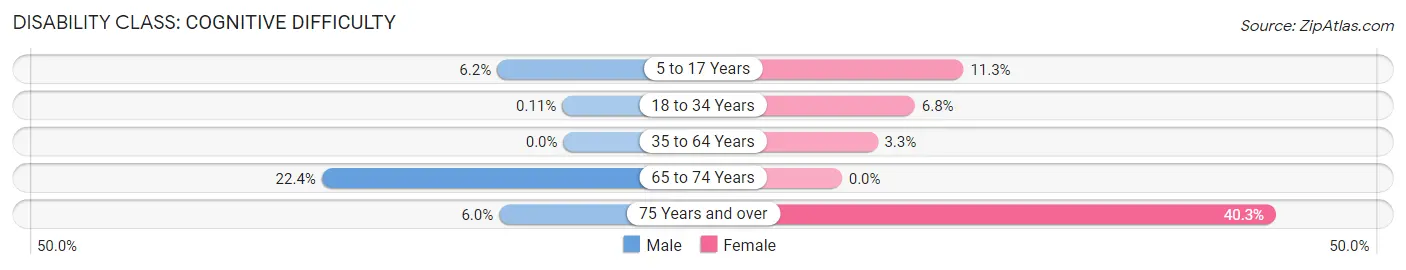
| Age Bracket | Male | Female |
| 5 to 17 Years | 63 (6.2%) | 113 (11.3%) |
| 18 to 34 Years | 1 (0.1%) | 60 (6.8%) |
| 35 to 64 Years | 0 (0.0%) | 51 (3.3%) |
| 65 to 74 Years | 85 (22.4%) | 0 (0.0%) |
| 75 Years and over | 21 (6.0%) | 139 (40.3%) |
Disability Class: Ambulatory Difficulty
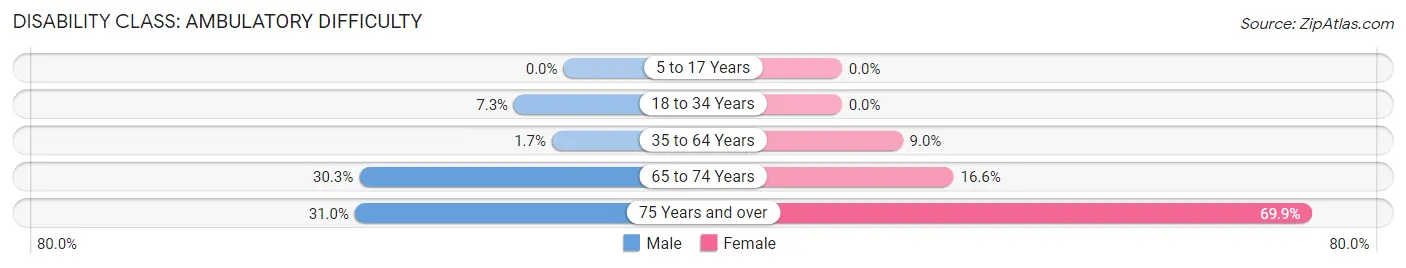
| Age Bracket | Male | Female |
| 5 to 17 Years | 0 (0.0%) | 0 (0.0%) |
| 18 to 34 Years | 66 (7.3%) | 0 (0.0%) |
| 35 to 64 Years | 21 (1.7%) | 139 (9.0%) |
| 65 to 74 Years | 115 (30.3%) | 78 (16.6%) |
| 75 Years and over | 109 (31.0%) | 241 (69.9%) |
Disability Class: Self-Care Difficulty
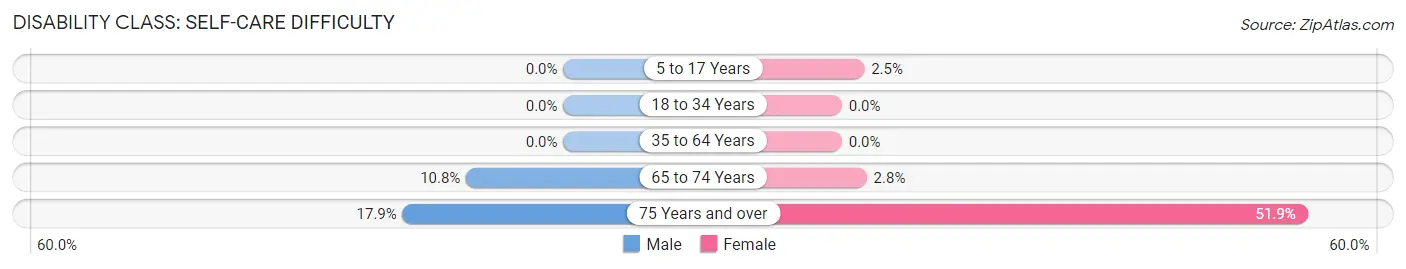
| Age Bracket | Male | Female |
| 5 to 17 Years | 0 (0.0%) | 25 (2.5%) |
| 18 to 34 Years | 0 (0.0%) | 0 (0.0%) |
| 35 to 64 Years | 0 (0.0%) | 0 (0.0%) |
| 65 to 74 Years | 41 (10.8%) | 13 (2.8%) |
| 75 Years and over | 63 (17.9%) | 179 (51.9%) |
Technology Access in Pomona
Computing Device Access in Pomona
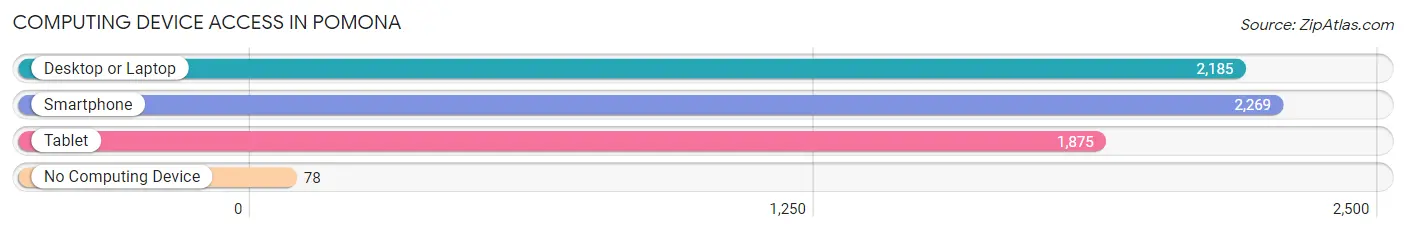
| Device Type | # Households | % Households |
| Desktop or Laptop | 2,185 | 89.3% |
| Smartphone | 2,269 | 92.8% |
| Tablet | 1,875 | 76.7% |
| No Computing Device | 78 | 3.2% |
| Total | 2,446 | 100.0% |
Internet Access in Pomona
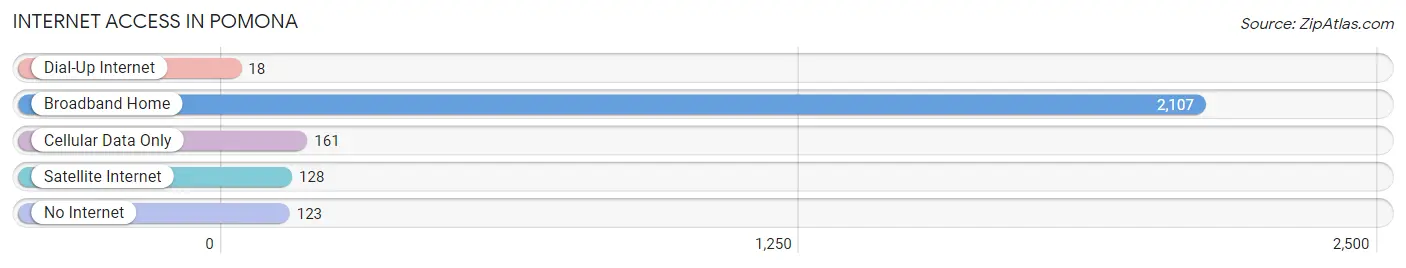
| Internet Type | # Households | % Households |
| Dial-Up Internet | 18 | 0.7% |
| Broadband Home | 2,107 | 86.1% |
| Cellular Data Only | 161 | 6.6% |
| Satellite Internet | 128 | 5.2% |
| No Internet | 123 | 5.0% |
| Total | 2,446 | 100.0% |
Pomona Summary
Pomona, New Jersey is a small borough located in Atlantic County, New Jersey. It is situated on the Absecon Bay, just south of Atlantic City. The borough was incorporated in 1894 and is home to a population of just over 1,000 people.
Geography
Pomona is located at 39°25'25" North, 74°25'25" West (39.423, -74.423). It is bordered by Absecon to the north, Egg Harbor Township to the east, and Galloway Township to the south and west. The borough covers an area of 0.7 square miles, all of which is land.
The borough is situated on the Absecon Bay, which is part of the Atlantic Ocean. The bay is a popular spot for fishing, boating, and other recreational activities. The bay is also home to a variety of wildlife, including ospreys, herons, and other waterfowl.
History
The area that is now Pomona was originally inhabited by the Lenni Lenape Native Americans. The first European settlers arrived in the area in the late 1600s. The area was originally part of Egg Harbor Township, but was incorporated as its own borough in 1894.
The borough was named after the Roman goddess of fruit, Pomona. The name was chosen by the first mayor of the borough, William H. White.
Economy
The economy of Pomona is largely based on tourism and recreation. The borough is home to several marinas, which attract visitors from all over the region. The marinas offer a variety of services, including boat rentals, fishing charters, and other recreational activities.
The borough is also home to several restaurants and bars, which attract visitors from the surrounding area. The borough is also home to a variety of small businesses, including a grocery store, a hardware store, and a pharmacy.
Demographics
As of the 2010 census, the population of Pomona was 1,072. The racial makeup of the borough was 94.3% White, 2.2% African American, 0.7% Asian, 0.3% Native American, and 2.5% from other races. Hispanic or Latino of any race were 4.2% of the population.
The median household income in Pomona was $50,938, and the median family income was $60,000. The per capita income was $25,938. About 8.3% of families and 10.2% of the population were below the poverty line.
Conclusion
Pomona, New Jersey is a small borough located in Atlantic County, New Jersey. It is situated on the Absecon Bay, just south of Atlantic City. The borough was incorporated in 1894 and is home to a population of just over 1,000 people. The economy of Pomona is largely based on tourism and recreation, and the borough is home to several marinas, restaurants, and small businesses. The population of Pomona is predominantly White, with a small percentage of African American, Asian, Native American, and other races. The median household income in Pomona is $50,938, and the per capita income is $25,938.
Common Questions
What is the Total Population of Pomona?
Total Population of Pomona is 8,878.
What is the Total Male Population of Pomona?
Total Male Population of Pomona is 4,316.
What is the Total Female Population of Pomona?
Total Female Population of Pomona is 4,562.
What is the Ratio of Males per 100 Females in Pomona?
There are 94.61 Males per 100 Females in Pomona.
What is the Ratio of Females per 100 Males in Pomona?
There are 105.70 Females per 100 Males in Pomona.
What is the Median Population Age in Pomona?
Median Population Age in Pomona is 38.2 Years.
What is the Average Family Size in Pomona
Average Family Size in Pomona is 3.8 People.
What is the Average Household Size in Pomona
Average Household Size in Pomona is 3.5 People.
What is Per Capita Income in Pomona?
Per Capita income in Pomona is $32,561.
What is the Median Family Income in Pomona?
Median Family Income in Pomona is $96,637.
What is the Median Household income in Pomona?
Median Household Income in Pomona is $95,161.
What is Income or Wage Gap in Pomona?
Income or Wage Gap in Pomona is 24.3%.
Women in Pomona earn 75.7 cents for every dollar earned by a man.
What is Inequality or Gini Index in Pomona?
Inequality or Gini Index in Pomona is 0.37.
How Large is the Labor Force in Pomona?
There are 3,941 People in the Labor Forcein in Pomona.
What is the Percentage of People in the Labor Force in Pomona?
57.4% of People are in the Labor Force in Pomona.
What is the Unemployment Rate in Pomona?
Unemployment Rate in Pomona is 2.3%.