Glen Rock borough, NJ
Glen Rock borough Overview
12,086
TOTAL POPULATION
6,031
MALE POPULATION
6,055
FEMALE POPULATION
99.60
MALES / 100 FEMALES
100.40
FEMALES / 100 MALES
39.3
MEDIAN AGE
3.5
AVG FAMILY SIZE
3.3
AVG HOUSEHOLD SIZE
$74,312
PER CAPITA INCOME
$209,255
AVG FAMILY INCOME
$202,586
AVG HOUSEHOLD INCOME
40.0%
WAGE / INCOME GAP [ % ]
60.0¢/ $1
WAGE / INCOME GAP [ $ ]
0.40
INEQUALITY / GINI INDEX
5,945
LABOR FORCE [ PEOPLE ]
69.6%
PERCENT IN LABOR FORCE
5.7%
UNEMPLOYMENT RATE
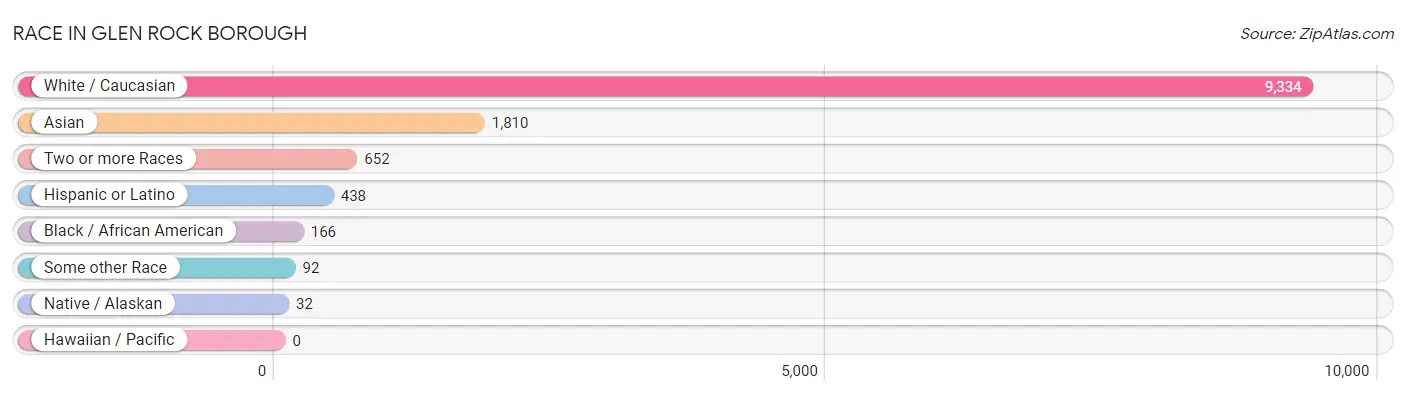
Race in Glen Rock borough
The most populous races in Glen Rock borough are White / Caucasian (9,334 | 77.2%), Asian (1,810 | 15.0%), and Two or more Races (652 | 5.4%).
| Race | # Population | % Population |
| Asian | 1,810 | 15.0% |
| Black / African American | 166 | 1.4% |
| Hawaiian / Pacific | 0 | 0.0% |
| Hispanic or Latino | 438 | 3.6% |
| Native / Alaskan | 32 | 0.3% |
| White / Caucasian | 9,334 | 77.2% |
| Two or more Races | 652 | 5.4% |
| Some other Race | 92 | 0.8% |
| Total | 12,086 | 100.0% |
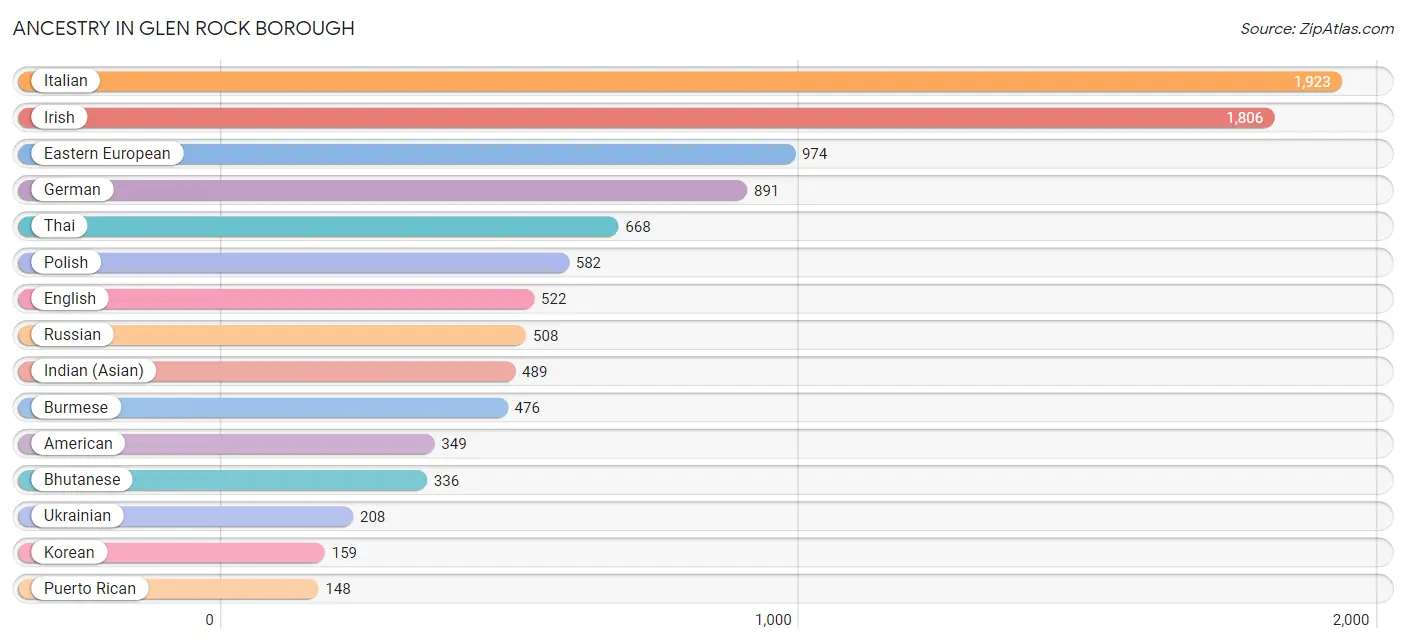
Ancestry in Glen Rock borough
The most populous ancestries reported in Glen Rock borough are Italian (1,923 | 15.9%), Irish (1,806 | 14.9%), Eastern European (974 | 8.1%), German (891 | 7.4%), and Thai (668 | 5.5%), together accounting for 51.8% of all Glen Rock borough residents.
| Ancestry | # Population | % Population |
| African | 18 | 0.2% |
| Albanian | 20 | 0.2% |
| Alsatian | 8 | 0.1% |
| American | 349 | 2.9% |
| Arab | 137 | 1.1% |
| Armenian | 24 | 0.2% |
| Assyrian / Chaldean / Syriac | 10 | 0.1% |
| Austrian | 87 | 0.7% |
| Bhutanese | 336 | 2.8% |
| British | 42 | 0.4% |
| Burmese | 476 | 3.9% |
| Canadian | 17 | 0.1% |
| Central American | 74 | 0.6% |
| Croatian | 98 | 0.8% |
| Cuban | 24 | 0.2% |
| Czech | 3 | 0.0% |
| Delaware | 6 | 0.1% |
| Dominican | 7 | 0.1% |
| Dutch | 90 | 0.7% |
| Eastern European | 974 | 8.1% |
| Ecuadorian | 14 | 0.1% |
| Egyptian | 13 | 0.1% |
| English | 522 | 4.3% |
| European | 63 | 0.5% |
| Filipino | 28 | 0.2% |
| French | 43 | 0.4% |
| French Canadian | 129 | 1.1% |
| German | 891 | 7.4% |
| Greek | 142 | 1.2% |
| Guatemalan | 74 | 0.6% |
| Guyanese | 10 | 0.1% |
| Hungarian | 77 | 0.6% |
| Indian (Asian) | 489 | 4.1% |
| Irish | 1,806 | 14.9% |
| Italian | 1,923 | 15.9% |
| Jamaican | 38 | 0.3% |
| Korean | 159 | 1.3% |
| Lebanese | 74 | 0.6% |
| Lithuanian | 8 | 0.1% |
| Mexican | 134 | 1.1% |
| Mexican American Indian | 26 | 0.2% |
| Native Hawaiian | 24 | 0.2% |
| Northern European | 8 | 0.1% |
| Norwegian | 86 | 0.7% |
| Pakistani | 11 | 0.1% |
| Peruvian | 37 | 0.3% |
| Polish | 582 | 4.8% |
| Portuguese | 14 | 0.1% |
| Puerto Rican | 148 | 1.2% |
| Romanian | 79 | 0.6% |
| Russian | 508 | 4.2% |
| Scotch-Irish | 24 | 0.2% |
| Scottish | 116 | 1.0% |
| Slovak | 23 | 0.2% |
| South African | 17 | 0.1% |
| South American | 51 | 0.4% |
| Sri Lankan | 18 | 0.2% |
| Subsaharan African | 106 | 0.9% |
| Sudanese | 71 | 0.6% |
| Swedish | 56 | 0.5% |
| Thai | 668 | 5.5% |
| Turkish | 134 | 1.1% |
| Ukrainian | 208 | 1.7% |
| Welsh | 12 | 0.1% | View All 64 Rows |
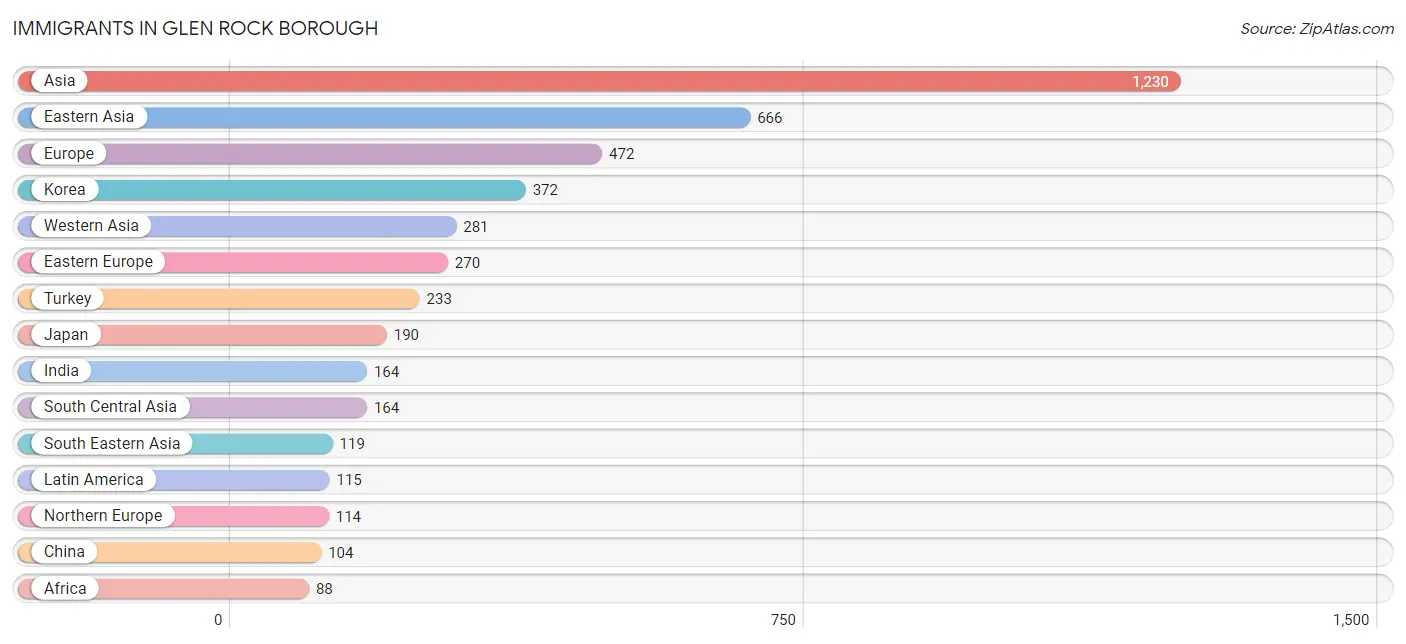
Immigrants in Glen Rock borough
The most numerous immigrant groups reported in Glen Rock borough came from Asia (1,230 | 10.2%), Eastern Asia (666 | 5.5%), Europe (472 | 3.9%), Korea (372 | 3.1%), and Western Asia (281 | 2.3%), together accounting for 25.0% of all Glen Rock borough residents.
| Immigration Origin | # Population | % Population |
| Africa | 88 | 0.7% |
| Albania | 43 | 0.4% |
| Asia | 1,230 | 10.2% |
| Australia | 9 | 0.1% |
| Canada | 43 | 0.4% |
| Caribbean | 15 | 0.1% |
| Central America | 76 | 0.6% |
| China | 104 | 0.9% |
| Croatia | 13 | 0.1% |
| Cuba | 8 | 0.1% |
| Dominican Republic | 7 | 0.1% |
| Eastern Africa | 18 | 0.2% |
| Eastern Asia | 666 | 5.5% |
| Eastern Europe | 270 | 2.2% |
| Ecuador | 14 | 0.1% |
| Egypt | 17 | 0.1% |
| England | 19 | 0.2% |
| Europe | 472 | 3.9% |
| Germany | 29 | 0.2% |
| Greece | 7 | 0.1% |
| Guatemala | 39 | 0.3% |
| Guyana | 10 | 0.1% |
| Hungary | 8 | 0.1% |
| India | 164 | 1.4% |
| Indonesia | 9 | 0.1% |
| Ireland | 76 | 0.6% |
| Israel | 26 | 0.2% |
| Italy | 42 | 0.4% |
| Japan | 190 | 1.6% |
| Korea | 372 | 3.1% |
| Latin America | 115 | 0.9% |
| Mexico | 37 | 0.3% |
| Netherlands | 10 | 0.1% |
| Northern Africa | 40 | 0.3% |
| Northern Europe | 114 | 0.9% |
| Norway | 19 | 0.2% |
| Oceania | 9 | 0.1% |
| Philippines | 85 | 0.7% |
| Poland | 55 | 0.5% |
| Romania | 18 | 0.2% |
| Russia | 25 | 0.2% |
| South Africa | 12 | 0.1% |
| South America | 24 | 0.2% |
| South Central Asia | 164 | 1.4% |
| South Eastern Asia | 119 | 1.0% |
| Southern Europe | 49 | 0.4% |
| Sudan | 23 | 0.2% |
| Taiwan | 30 | 0.3% |
| Thailand | 11 | 0.1% |
| Turkey | 233 | 1.9% |
| Uganda | 9 | 0.1% |
| Ukraine | 86 | 0.7% |
| Western Africa | 18 | 0.2% |
| Western Asia | 281 | 2.3% |
| Western Europe | 39 | 0.3% | View All 55 Rows |
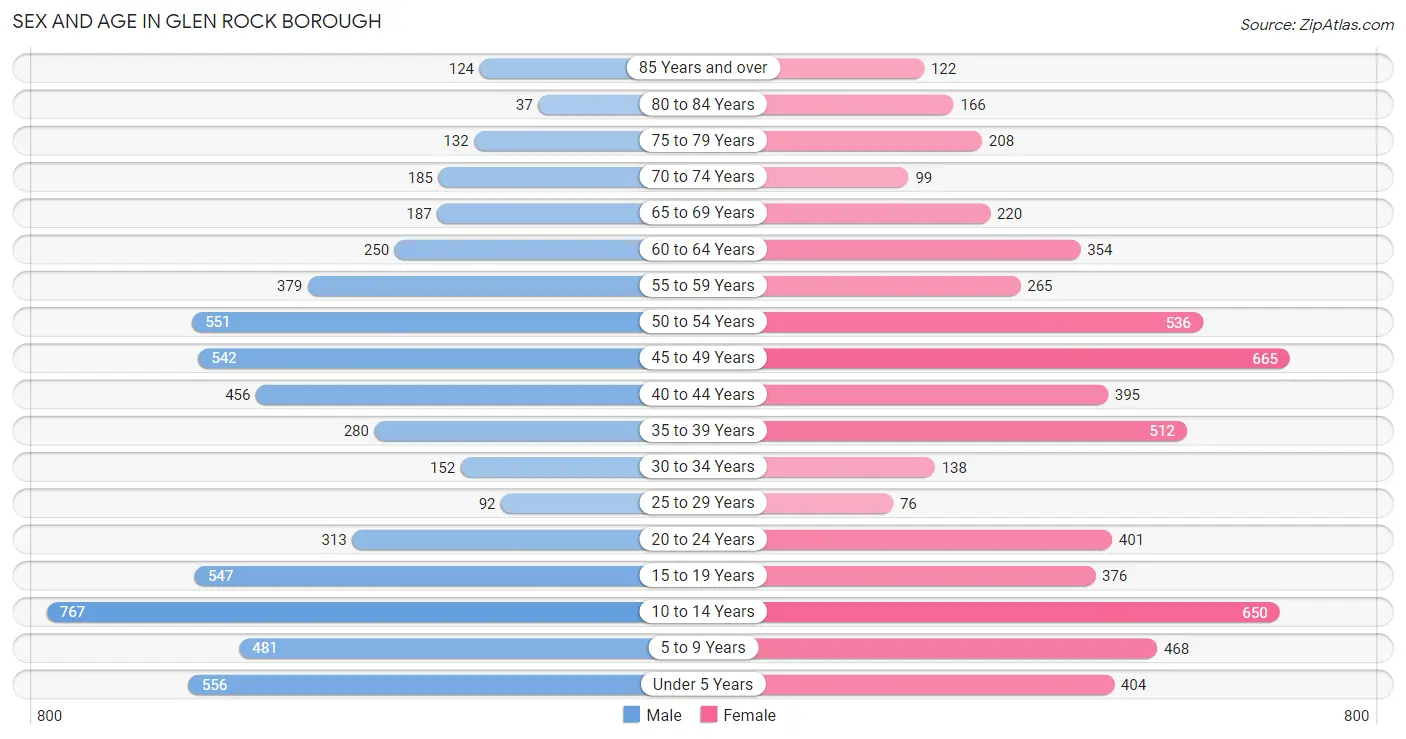
Sex and Age in Glen Rock borough
Sex and Age in Glen Rock borough
The most populous age groups in Glen Rock borough are 10 to 14 Years (767 | 12.7%) for men and 45 to 49 Years (665 | 11.0%) for women.
| Age Bracket | Male | Female |
| Under 5 Years | 556 (9.2%) | 404 (6.7%) |
| 5 to 9 Years | 481 (8.0%) | 468 (7.7%) |
| 10 to 14 Years | 767 (12.7%) | 650 (10.7%) |
| 15 to 19 Years | 547 (9.1%) | 376 (6.2%) |
| 20 to 24 Years | 313 (5.2%) | 401 (6.6%) |
| 25 to 29 Years | 92 (1.5%) | 76 (1.3%) |
| 30 to 34 Years | 152 (2.5%) | 138 (2.3%) |
| 35 to 39 Years | 280 (4.6%) | 512 (8.5%) |
| 40 to 44 Years | 456 (7.6%) | 395 (6.5%) |
| 45 to 49 Years | 542 (9.0%) | 665 (11.0%) |
| 50 to 54 Years | 551 (9.1%) | 536 (8.8%) |
| 55 to 59 Years | 379 (6.3%) | 265 (4.4%) |
| 60 to 64 Years | 250 (4.2%) | 354 (5.9%) |
| 65 to 69 Years | 187 (3.1%) | 220 (3.6%) |
| 70 to 74 Years | 185 (3.1%) | 99 (1.6%) |
| 75 to 79 Years | 132 (2.2%) | 208 (3.4%) |
| 80 to 84 Years | 37 (0.6%) | 166 (2.7%) |
| 85 Years and over | 124 (2.1%) | 122 (2.0%) |
| Total | 6,031 (100.0%) | 6,055 (100.0%) |
Families and Households in Glen Rock borough
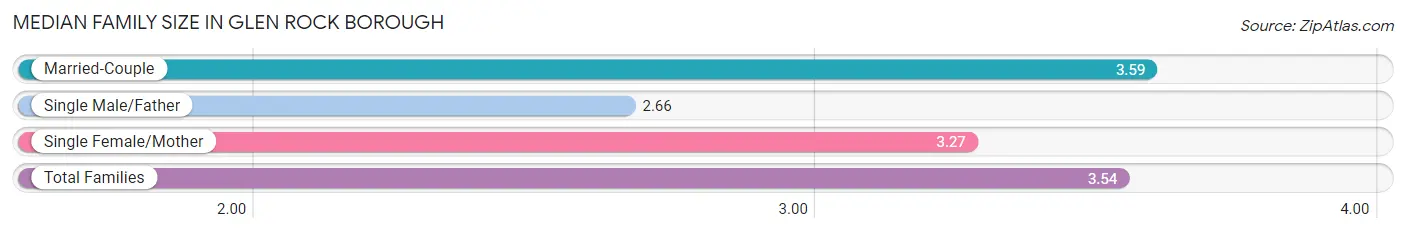
Median Family Size in Glen Rock borough
The median family size in Glen Rock borough is 3.54 persons per family, with married-couple families (2,865 | 88.6%) accounting for the largest median family size of 3.59 persons per family. On the other hand, single male/father families (88 | 2.7%) represent the smallest median family size with 2.66 persons per family.
| Family Type | # Families | Family Size |
| Married-Couple | 2,865 (88.6%) | 3.59 |
| Single Male/Father | 88 (2.7%) | 2.66 |
| Single Female/Mother | 280 (8.7%) | 3.27 |
| Total Families | 3,233 (100.0%) | 3.54 |
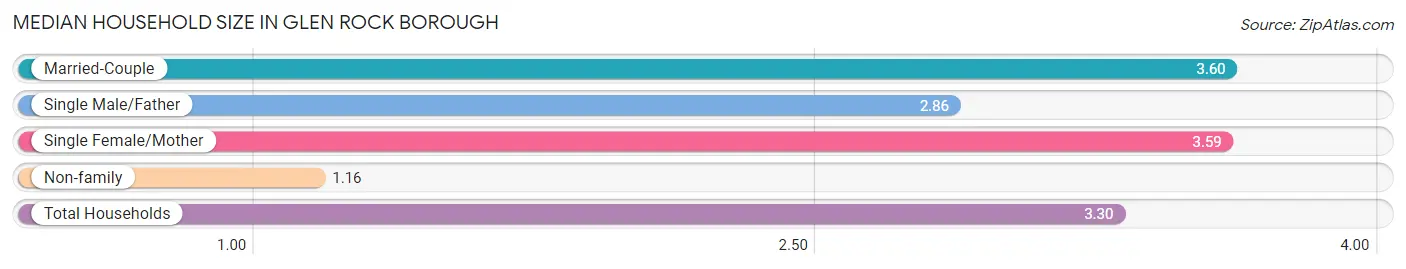
Median Household Size in Glen Rock borough
The median household size in Glen Rock borough is 3.30 persons per household, with married-couple households (2,865 | 78.4%) accounting for the largest median household size of 3.6 persons per household. non-family households (419 | 11.5%) represent the smallest median household size with 1.16 persons per household.
| Household Type | # Households | Household Size |
| Married-Couple | 2,865 (78.4%) | 3.60 |
| Single Male/Father | 88 (2.4%) | 2.86 |
| Single Female/Mother | 280 (7.7%) | 3.59 |
| Non-family | 419 (11.5%) | 1.16 |
| Total Households | 3,652 (100.0%) | 3.30 |
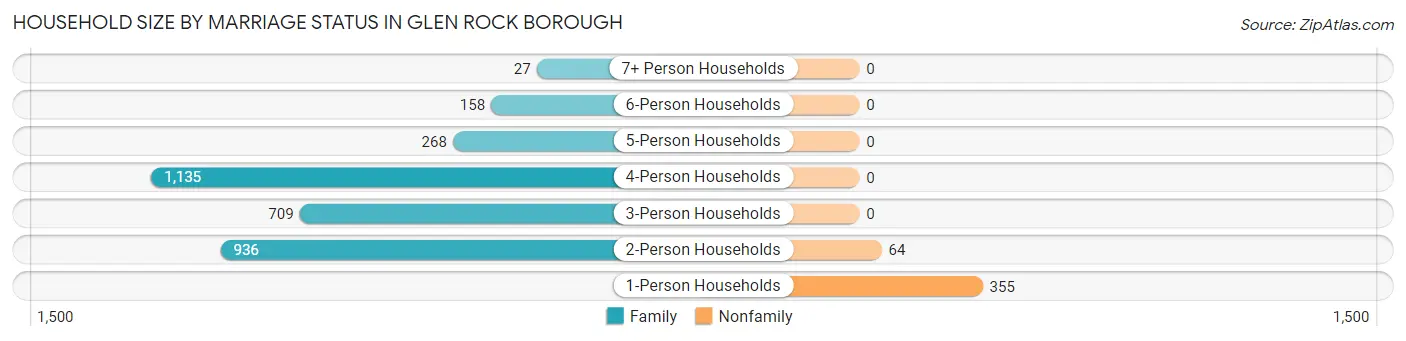
Household Size by Marriage Status in Glen Rock borough
Out of a total of 3,652 households in Glen Rock borough, 3,233 (88.5%) are family households, while 419 (11.5%) are nonfamily households. The most numerous type of family households are 4-person households, comprising 1,135, and the most common type of nonfamily households are 1-person households, comprising 355.
| Household Size | Family Households | Nonfamily Households |
| 1-Person Households | - | 355 (9.7%) |
| 2-Person Households | 936 (25.6%) | 64 (1.8%) |
| 3-Person Households | 709 (19.4%) | 0 (0.0%) |
| 4-Person Households | 1,135 (31.1%) | 0 (0.0%) |
| 5-Person Households | 268 (7.3%) | 0 (0.0%) |
| 6-Person Households | 158 (4.3%) | 0 (0.0%) |
| 7+ Person Households | 27 (0.7%) | 0 (0.0%) |
| Total | 3,233 (88.5%) | 419 (11.5%) |
Female Fertility in Glen Rock borough
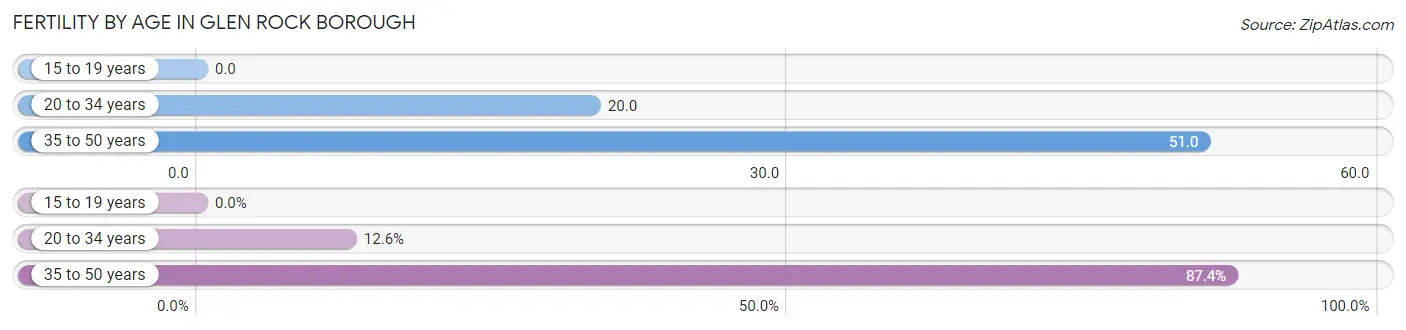
Fertility by Age in Glen Rock borough
Average fertility rate in Glen Rock borough is 36.0 births per 1,000 women. Women in the age bracket of 35 to 50 years have the highest fertility rate with 51.0 births per 1,000 women. Women in the age bracket of 35 to 50 years acount for 87.4% of all women with births.
| Age Bracket | Women with Births | Births / 1,000 Women |
| 15 to 19 years | 0 (0.0%) | 0.0 |
| 20 to 34 years | 12 (12.6%) | 20.0 |
| 35 to 50 years | 83 (87.4%) | 51.0 |
| Total | 95 (100.0%) | 36.0 |
Fertility by Age by Marriage Status in Glen Rock borough
57.9% of women with births (95) in Glen Rock borough are married. The highest percentage of unmarried women with births falls into 35 to 50 years age bracket with 48.2% of them unmarried at the time of birth, while the lowest percentage of unmarried women with births belong to 20 to 34 years age bracket with 0.0% of them unmarried.
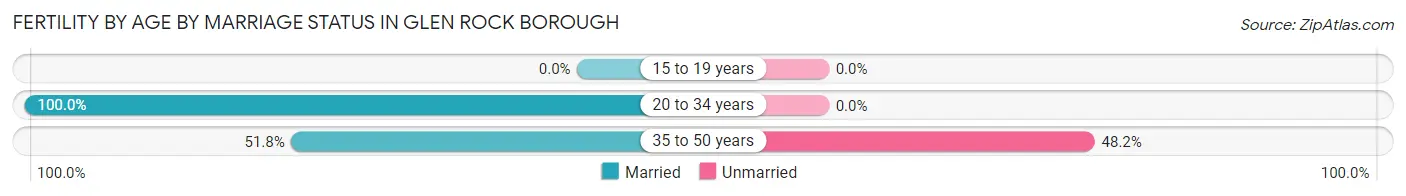
| Age Bracket | Married | Unmarried |
| 15 to 19 years | 0 (0.0%) | 0 (0.0%) |
| 20 to 34 years | 12 (100.0%) | 0 (0.0%) |
| 35 to 50 years | 43 (51.8%) | 40 (48.2%) |
| Total | 55 (57.9%) | 40 (42.1%) |
Fertility by Education in Glen Rock borough
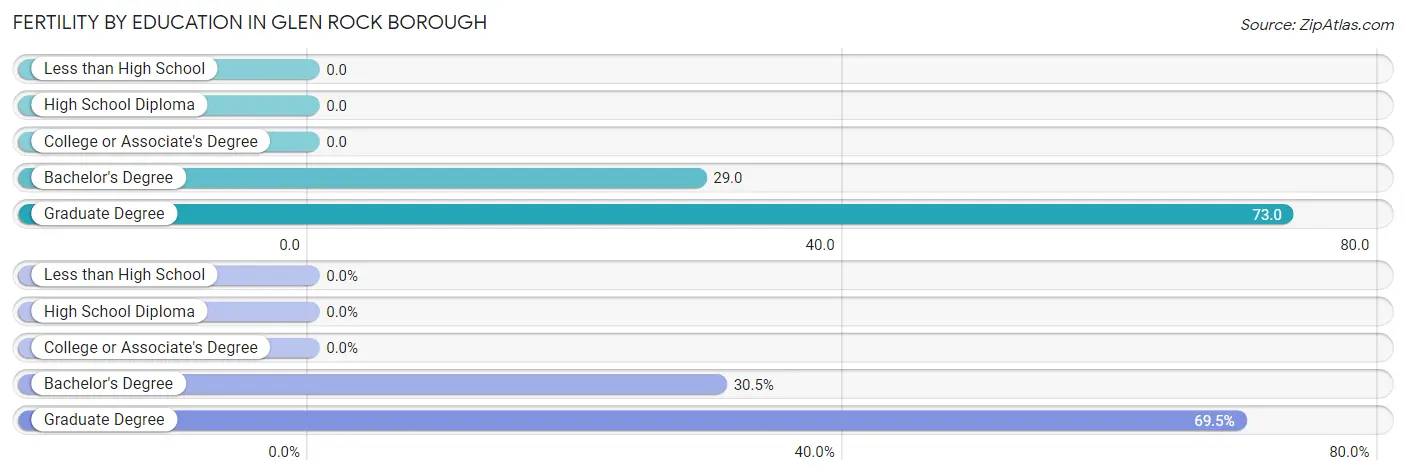
| Educational Attainment | Women with Births | Births / 1,000 Women |
| Less than High School | 0 (0.0%) | 0.0 |
| High School Diploma | 0 (0.0%) | 0.0 |
| College or Associate's Degree | 0 (0.0%) | 0.0 |
| Bachelor's Degree | 29 (30.5%) | 29.0 |
| Graduate Degree | 66 (69.5%) | 73.0 |
| Total | 95 (100.0%) | 36.0 |
Fertility by Education by Marriage Status in Glen Rock borough
42.1% of women with births in Glen Rock borough are unmarried. Women with the educational attainment of bachelor's degree are most likely to be married with 100.0% of them married at childbirth, while women with the educational attainment of graduate degree are least likely to be married with 60.6% of them unmarried at childbirth.
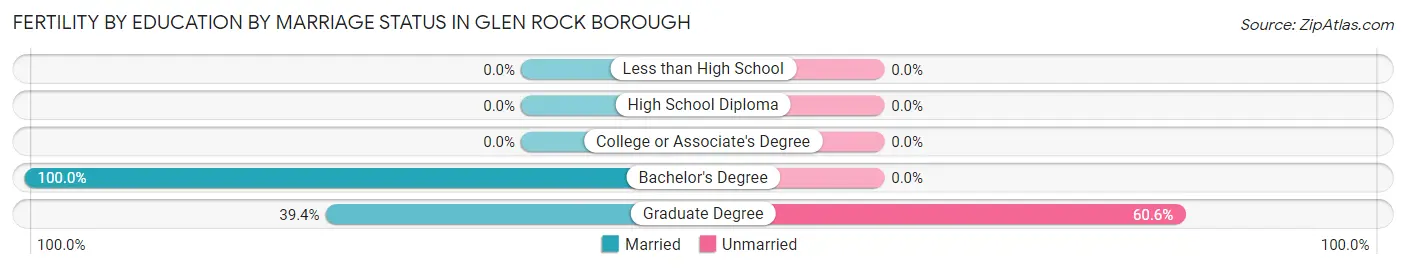
| Educational Attainment | Married | Unmarried |
| Less than High School | 0 (0.0%) | 0 (0.0%) |
| High School Diploma | 0 (0.0%) | 0 (0.0%) |
| College or Associate's Degree | 0 (0.0%) | 0 (0.0%) |
| Bachelor's Degree | 29 (100.0%) | 0 (0.0%) |
| Graduate Degree | 26 (39.4%) | 40 (60.6%) |
| Total | 55 (57.9%) | 40 (42.1%) |
Income in Glen Rock borough
Income Overview in Glen Rock borough
Per Capita Income in Glen Rock borough is $74,312, while median incomes of families and households are $209,255 and $202,586 respectively.
| Characteristic | Number | Measure |
| Per Capita Income | 12,086 | $74,312 |
| Median Family Income | 3,233 | $209,255 |
| Mean Family Income | 3,233 | $259,966 |
| Median Household Income | 3,652 | $202,586 |
| Mean Household Income | 3,652 | $243,037 |
| Income Deficit | 3,233 | $0 |
| Wage / Income Gap (%) | 12,086 | 39.99% |
| Wage / Income Gap ($) | 12,086 | 60.01¢ per $1 |
| Gini / Inequality Index | 12,086 | 0.40 |
Earnings by Sex in Glen Rock borough
Average Earnings in Glen Rock borough are $98,576, $124,028 for men and $74,426 for women, a difference of 40.0%.
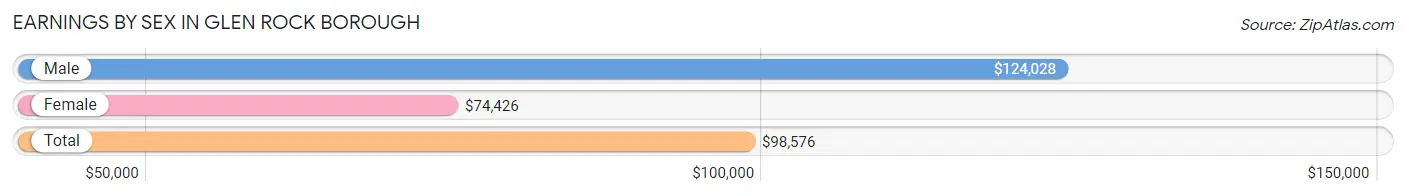
| Sex | Number | Average Earnings |
| Male | 3,243 (53.6%) | $124,028 |
| Female | 2,804 (46.4%) | $74,426 |
| Total | 6,047 (100.0%) | $98,576 |
Earnings by Sex by Income Bracket in Glen Rock borough
The most common earnings brackets in Glen Rock borough are $100,000+ for men (1,934 | 59.6%) and $100,000+ for women (1,065 | 38.0%).
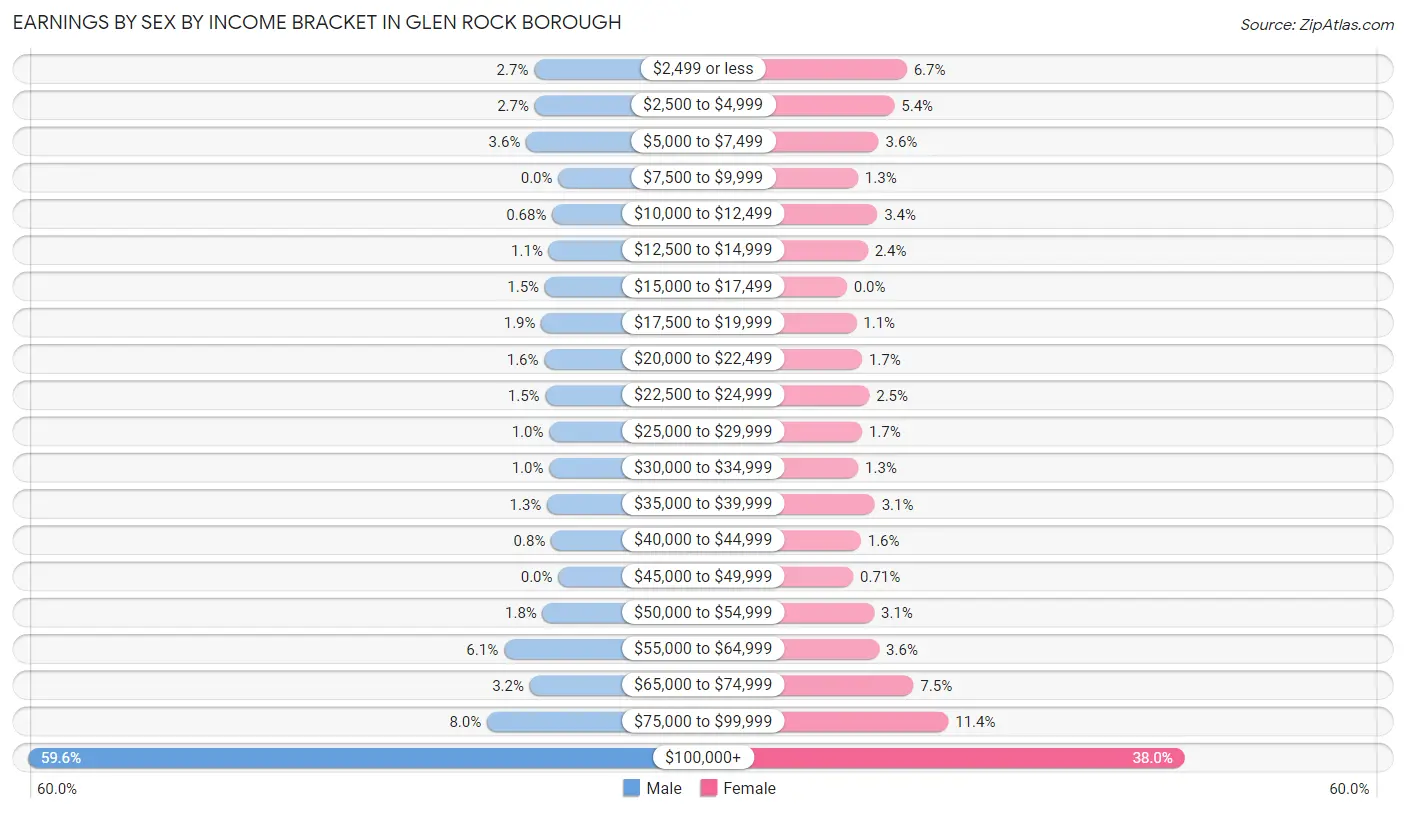
| Income | Male | Female |
| $2,499 or less | 88 (2.7%) | 189 (6.7%) |
| $2,500 to $4,999 | 86 (2.6%) | 150 (5.3%) |
| $5,000 to $7,499 | 117 (3.6%) | 100 (3.6%) |
| $7,500 to $9,999 | 0 (0.0%) | 35 (1.3%) |
| $10,000 to $12,499 | 22 (0.7%) | 96 (3.4%) |
| $12,500 to $14,999 | 35 (1.1%) | 66 (2.4%) |
| $15,000 to $17,499 | 49 (1.5%) | 0 (0.0%) |
| $17,500 to $19,999 | 62 (1.9%) | 30 (1.1%) |
| $20,000 to $22,499 | 51 (1.6%) | 48 (1.7%) |
| $22,500 to $24,999 | 47 (1.5%) | 71 (2.5%) |
| $25,000 to $29,999 | 33 (1.0%) | 48 (1.7%) |
| $30,000 to $34,999 | 33 (1.0%) | 36 (1.3%) |
| $35,000 to $39,999 | 41 (1.3%) | 88 (3.1%) |
| $40,000 to $44,999 | 26 (0.8%) | 44 (1.6%) |
| $45,000 to $49,999 | 0 (0.0%) | 20 (0.7%) |
| $50,000 to $54,999 | 57 (1.8%) | 86 (3.1%) |
| $55,000 to $64,999 | 198 (6.1%) | 102 (3.6%) |
| $65,000 to $74,999 | 104 (3.2%) | 210 (7.5%) |
| $75,000 to $99,999 | 260 (8.0%) | 320 (11.4%) |
| $100,000+ | 1,934 (59.6%) | 1,065 (38.0%) |
| Total | 3,243 (100.0%) | 2,804 (100.0%) |
Earnings by Sex by Educational Attainment in Glen Rock borough
Average earnings in Glen Rock borough are $143,713 for men and $87,676 for women, a difference of 39.0%. Men with an educational attainment of graduate degree enjoy the highest average annual earnings of $231,339, while those with college or associate's degree education earn the least with $76,635. Women with an educational attainment of graduate degree earn the most with the average annual earnings of $98,672, while those with college or associate's degree education have the smallest earnings of $70,781.
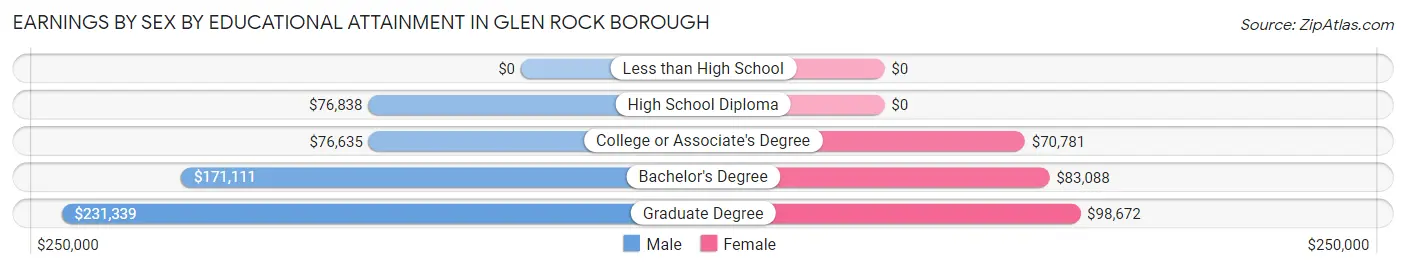
| Educational Attainment | Male Income | Female Income |
| Less than High School | - | - |
| High School Diploma | $76,838 | $0 |
| College or Associate's Degree | $76,635 | $70,781 |
| Bachelor's Degree | $171,111 | $83,088 |
| Graduate Degree | $231,339 | $98,672 |
| Total | $143,713 | $87,676 |
Family Income in Glen Rock borough
Family Income Brackets in Glen Rock borough
According to the Glen Rock borough family income data, there are 1,768 families falling into the $200,000+ income range, which is the most common income bracket and makes up 54.7% of all families.
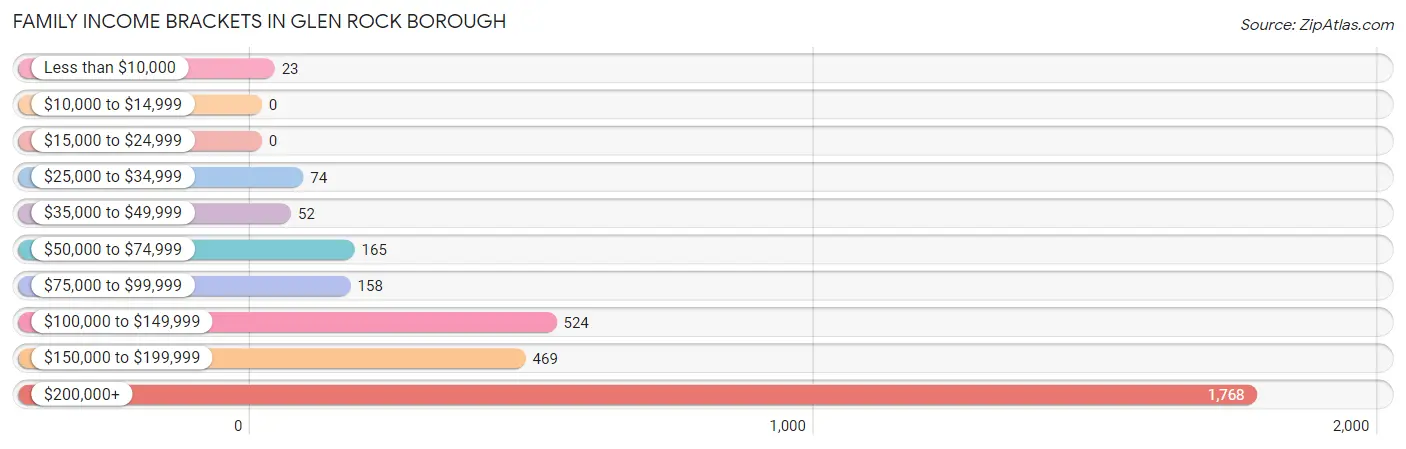
| Income Bracket | # Families | % Families |
| Less than $10,000 | 23 | 0.7% |
| $10,000 to $14,999 | 0 | 0.0% |
| $15,000 to $24,999 | 0 | 0.0% |
| $25,000 to $34,999 | 74 | 2.3% |
| $35,000 to $49,999 | 52 | 1.6% |
| $50,000 to $74,999 | 165 | 5.1% |
| $75,000 to $99,999 | 158 | 4.9% |
| $100,000 to $149,999 | 524 | 16.2% |
| $150,000 to $199,999 | 469 | 14.5% |
| $200,000+ | 1,768 | 54.7% |
Family Income by Famaliy Size in Glen Rock borough
4-person families (1,172 | 36.2%) account for the highest median family income in Glen Rock borough with $250,001 per family, while 2-person families (968 | 29.9%) have the highest median income of $68,538 per family member.
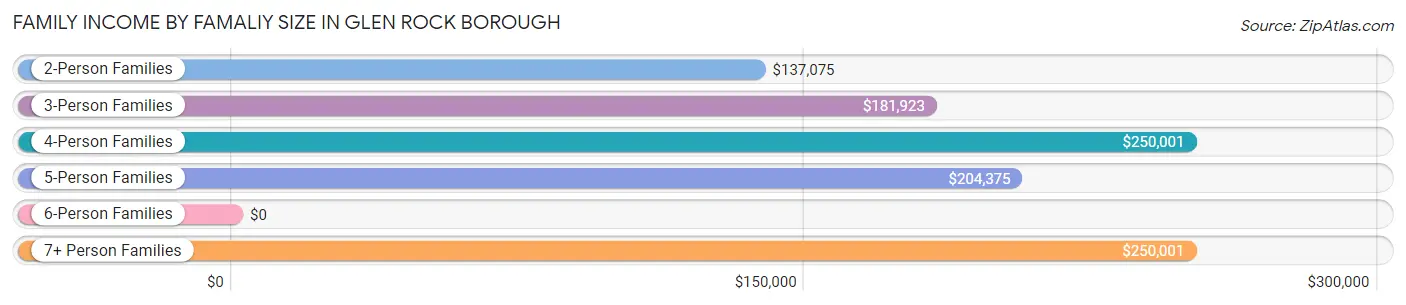
| Income Bracket | # Families | Median Income |
| 2-Person Families | 968 (29.9%) | $137,075 |
| 3-Person Families | 696 (21.5%) | $181,923 |
| 4-Person Families | 1,172 (36.2%) | $250,001 |
| 5-Person Families | 227 (7.0%) | $204,375 |
| 6-Person Families | 143 (4.4%) | $0 |
| 7+ Person Families | 27 (0.8%) | $250,001 |
| Total | 3,233 (100.0%) | $209,255 |
Family Income by Number of Earners in Glen Rock borough
The median family income in Glen Rock borough is $209,255, with families comprising 2 earners (1,684) having the highest median family income of $250,001, while families with no earners (264) have the lowest median family income of $50,673, accounting for 52.1% and 8.2% of families, respectively.
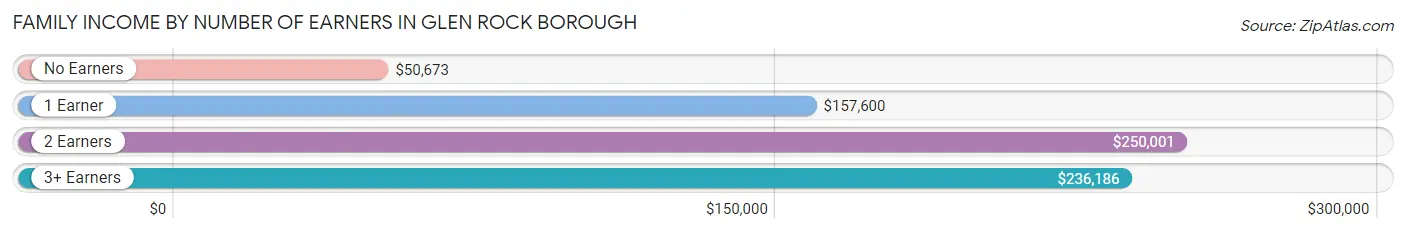
| Number of Earners | # Families | Median Income |
| No Earners | 264 (8.2%) | $50,673 |
| 1 Earner | 858 (26.5%) | $157,600 |
| 2 Earners | 1,684 (52.1%) | $250,001 |
| 3+ Earners | 427 (13.2%) | $236,186 |
| Total | 3,233 (100.0%) | $209,255 |
Household Income in Glen Rock borough
Household Income Brackets in Glen Rock borough
With 1,833 households falling in the category, the $200,000+ income range is the most frequent in Glen Rock borough, accounting for 50.2% of all households. In contrast, only 15 households (0.4%) fall into the $15,000 to $24,999 income bracket, making it the least populous group.
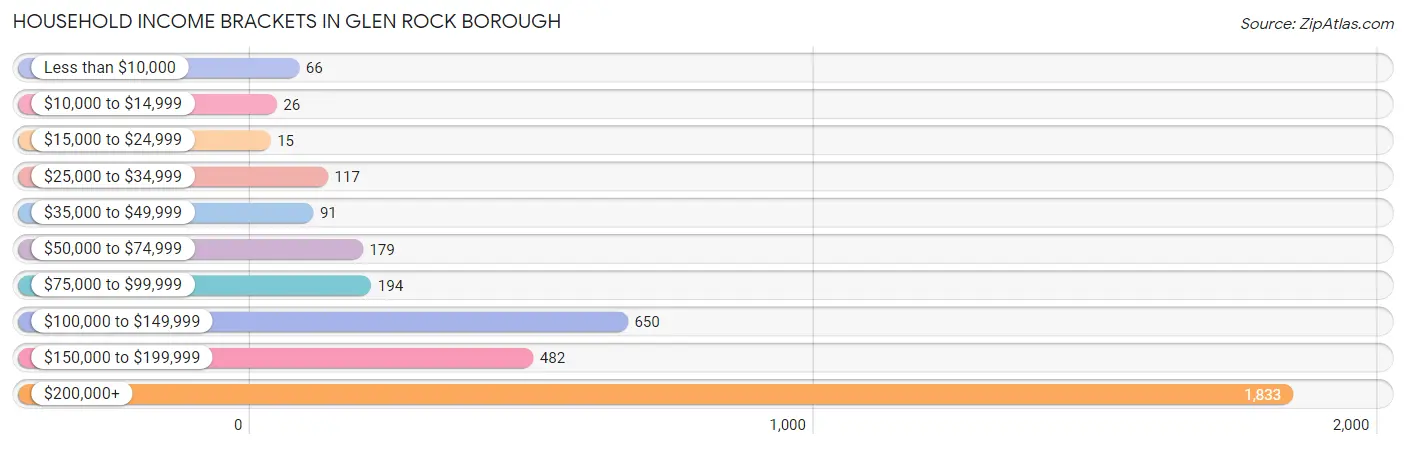
| Income Bracket | # Households | % Households |
| Less than $10,000 | 66 | 1.8% |
| $10,000 to $14,999 | 26 | 0.7% |
| $15,000 to $24,999 | 15 | 0.4% |
| $25,000 to $34,999 | 117 | 3.2% |
| $35,000 to $49,999 | 91 | 2.5% |
| $50,000 to $74,999 | 179 | 4.9% |
| $75,000 to $99,999 | 194 | 5.3% |
| $100,000 to $149,999 | 650 | 17.8% |
| $150,000 to $199,999 | 482 | 13.2% |
| $200,000+ | 1,833 | 50.2% |
Household Income by Householder Age in Glen Rock borough
The median household income in Glen Rock borough is $202,586, with the highest median household income of $243,286 found in the 25 to 44 years age bracket for the primary householder. A total of 895 households (24.5%) fall into this category. Meanwhile, the 15 to 24 years age bracket for the primary householder has the lowest median household income of $0, with 17 households (0.5%) in this group.
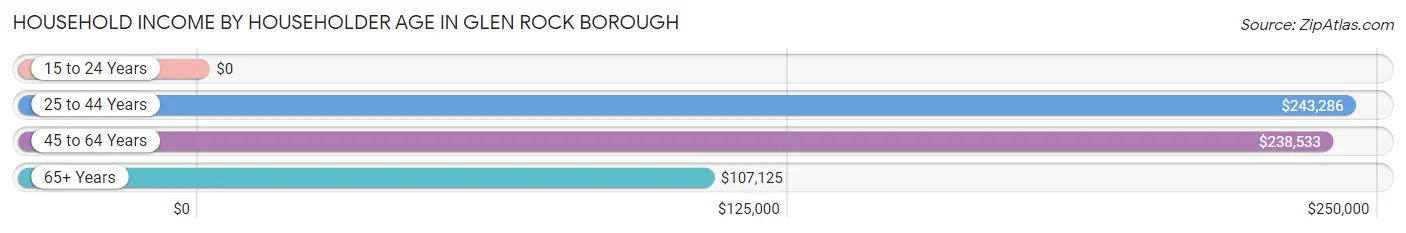
| Income Bracket | # Households | Median Income |
| 15 to 24 Years | 17 (0.5%) | $0 |
| 25 to 44 Years | 895 (24.5%) | $243,286 |
| 45 to 64 Years | 1,851 (50.7%) | $238,533 |
| 65+ Years | 889 (24.3%) | $107,125 |
| Total | 3,652 (100.0%) | $202,586 |
Poverty in Glen Rock borough
Income Below Poverty by Sex and Age in Glen Rock borough
With 1.4% poverty level for males and 3.1% for females among the residents of Glen Rock borough, 55 to 64 year old males and 16 and 17 year old females are the most vulnerable to poverty, with 37 males (5.9%) and 50 females (25.8%) in their respective age groups living below the poverty level.
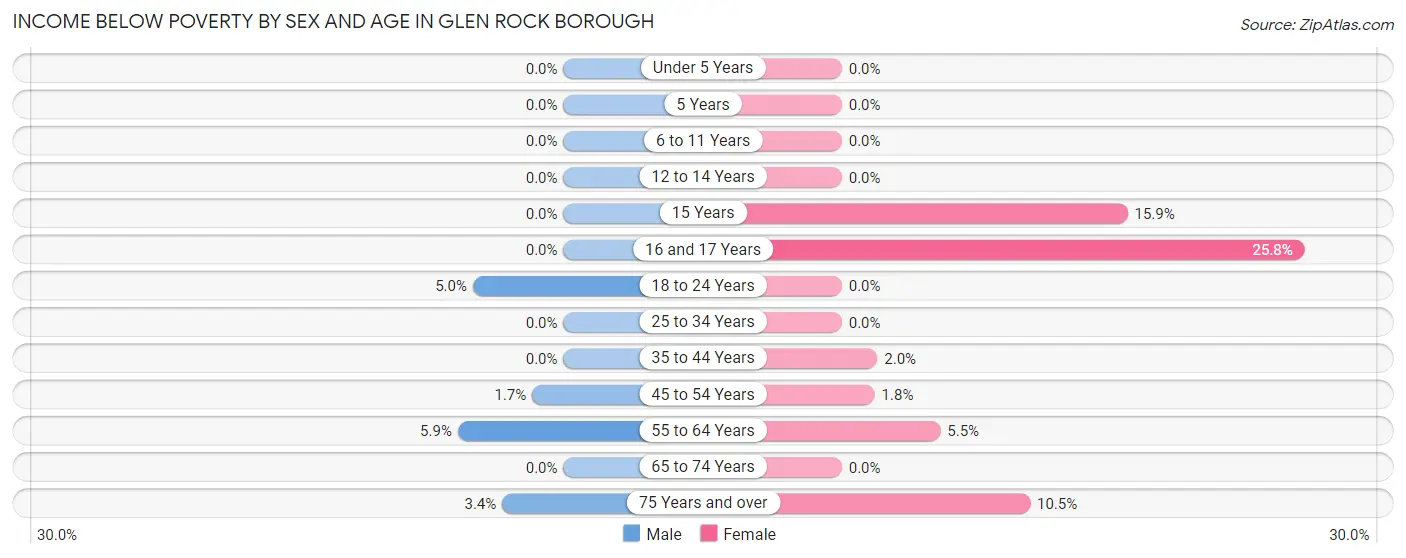
| Age Bracket | Male | Female |
| Under 5 Years | 0 (0.0%) | 0 (0.0%) |
| 5 Years | 0 (0.0%) | 0 (0.0%) |
| 6 to 11 Years | 0 (0.0%) | 0 (0.0%) |
| 12 to 14 Years | 0 (0.0%) | 0 (0.0%) |
| 15 Years | 0 (0.0%) | 14 (15.9%) |
| 16 and 17 Years | 0 (0.0%) | 50 (25.8%) |
| 18 to 24 Years | 20 (5.0%) | 0 (0.0%) |
| 25 to 34 Years | 0 (0.0%) | 0 (0.0%) |
| 35 to 44 Years | 0 (0.0%) | 18 (2.0%) |
| 45 to 54 Years | 19 (1.7%) | 22 (1.8%) |
| 55 to 64 Years | 37 (5.9%) | 34 (5.5%) |
| 65 to 74 Years | 0 (0.0%) | 0 (0.0%) |
| 75 Years and over | 10 (3.4%) | 52 (10.5%) |
| Total | 86 (1.4%) | 190 (3.1%) |
Income Above Poverty by Sex and Age in Glen Rock borough
According to the poverty statistics in Glen Rock borough, males aged under 5 years and females aged under 5 years are the age groups that are most secure financially, with 100.0% of males and 100.0% of females in these age groups living above the poverty line.
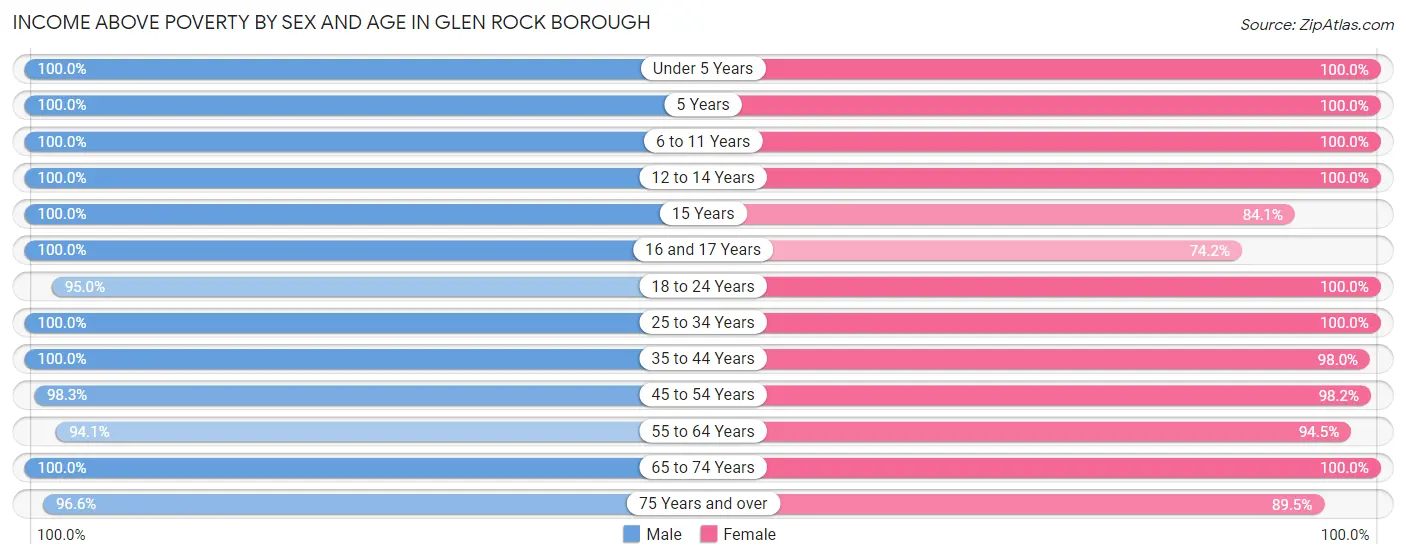
| Age Bracket | Male | Female |
| Under 5 Years | 556 (100.0%) | 404 (100.0%) |
| 5 Years | 31 (100.0%) | 86 (100.0%) |
| 6 to 11 Years | 640 (100.0%) | 633 (100.0%) |
| 12 to 14 Years | 577 (100.0%) | 399 (100.0%) |
| 15 Years | 130 (100.0%) | 74 (84.1%) |
| 16 and 17 Years | 333 (100.0%) | 144 (74.2%) |
| 18 to 24 Years | 377 (95.0%) | 495 (100.0%) |
| 25 to 34 Years | 244 (100.0%) | 214 (100.0%) |
| 35 to 44 Years | 736 (100.0%) | 889 (98.0%) |
| 45 to 54 Years | 1,074 (98.3%) | 1,179 (98.2%) |
| 55 to 64 Years | 592 (94.1%) | 585 (94.5%) |
| 65 to 74 Years | 372 (100.0%) | 319 (100.0%) |
| 75 Years and over | 283 (96.6%) | 444 (89.5%) |
| Total | 5,945 (98.6%) | 5,865 (96.9%) |
Income Below Poverty Among Married-Couple Families in Glen Rock borough
The poverty statistics for married-couple families in Glen Rock borough show that 0.8% or 23 of the total 2,865 families live below the poverty line. Families with 1 or 2 children have the highest poverty rate of 0.9%, comprising of 13 families. On the other hand, families with 3 or 4 children have the lowest poverty rate of 0.0%, which includes 0 families.
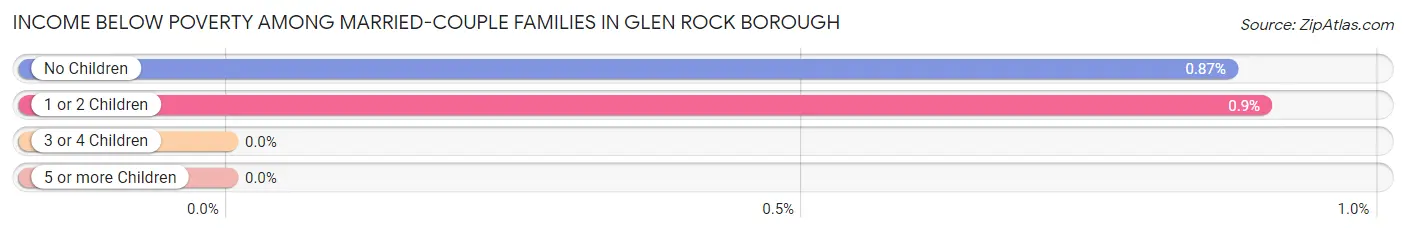
| Children | Above Poverty | Below Poverty |
| No Children | 1,134 (99.1%) | 10 (0.9%) |
| 1 or 2 Children | 1,433 (99.1%) | 13 (0.9%) |
| 3 or 4 Children | 255 (100.0%) | 0 (0.0%) |
| 5 or more Children | 20 (100.0%) | 0 (0.0%) |
| Total | 2,842 (99.2%) | 23 (0.8%) |
Income Below Poverty Among Single-Parent Households in Glen Rock borough
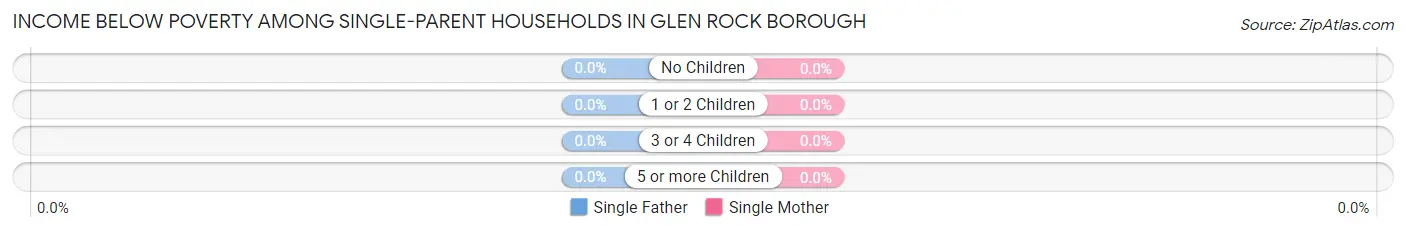
| Children | Single Father | Single Mother |
| No Children | 0 (0.0%) | 0 (0.0%) |
| 1 or 2 Children | 0 (0.0%) | 0 (0.0%) |
| 3 or 4 Children | 0 (0.0%) | 0 (0.0%) |
| 5 or more Children | 0 (0.0%) | 0 (0.0%) |
| Total | 0 (0.0%) | 0 (0.0%) |
Income Below Poverty Among Married-Couple vs Single-Parent Households in Glen Rock borough
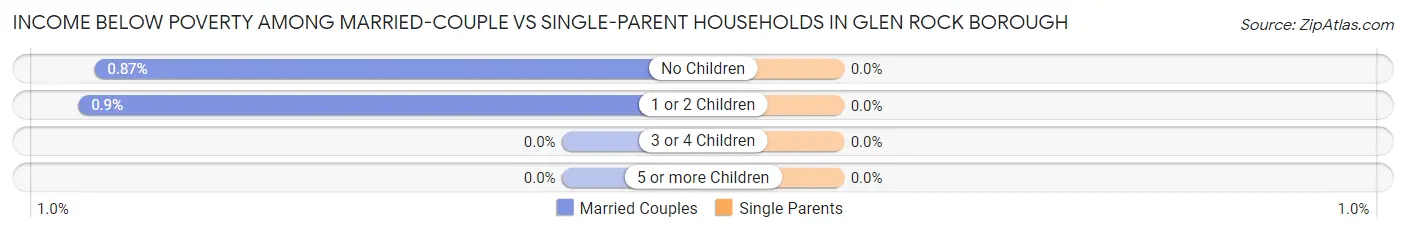
| Children | Married-Couple Families | Single-Parent Households |
| No Children | 10 (0.9%) | 0 (0.0%) |
| 1 or 2 Children | 13 (0.9%) | 0 (0.0%) |
| 3 or 4 Children | 0 (0.0%) | 0 (0.0%) |
| 5 or more Children | 0 (0.0%) | 0 (0.0%) |
| Total | 23 (0.8%) | 0 (0.0%) |
Employment Characteristics in Glen Rock borough
Employment by Class of Employer in Glen Rock borough
Among the 5,421 employed individuals in Glen Rock borough, private company employees (3,836 | 70.8%), local government employees (415 | 7.7%), and not-for-profit organizations (347 | 6.4%) make up the most common classes of employment.
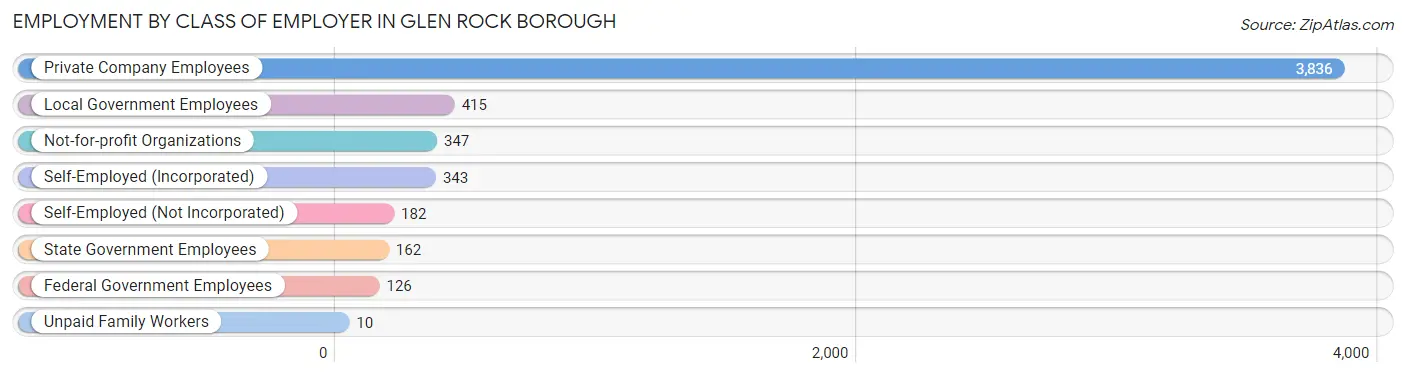
| Employer Class | # Employees | % Employees |
| Private Company Employees | 3,836 | 70.8% |
| Self-Employed (Incorporated) | 343 | 6.3% |
| Self-Employed (Not Incorporated) | 182 | 3.4% |
| Not-for-profit Organizations | 347 | 6.4% |
| Local Government Employees | 415 | 7.7% |
| State Government Employees | 162 | 3.0% |
| Federal Government Employees | 126 | 2.3% |
| Unpaid Family Workers | 10 | 0.2% |
| Total | 5,421 | 100.0% |
Employment Status by Age in Glen Rock borough
According to the labor force statistics for Glen Rock borough, out of the total population over 16 years of age (8,542), 69.6% or 5,945 individuals are in the labor force, with 5.7% or 339 of them unemployed. The age group with the highest labor force participation rate is 25 to 29 years, with 100.0% or 168 individuals in the labor force. Within the labor force, the 20 to 24 years age range has the highest percentage of unemployed individuals, with 35.7% or 213 of them being unemployed.
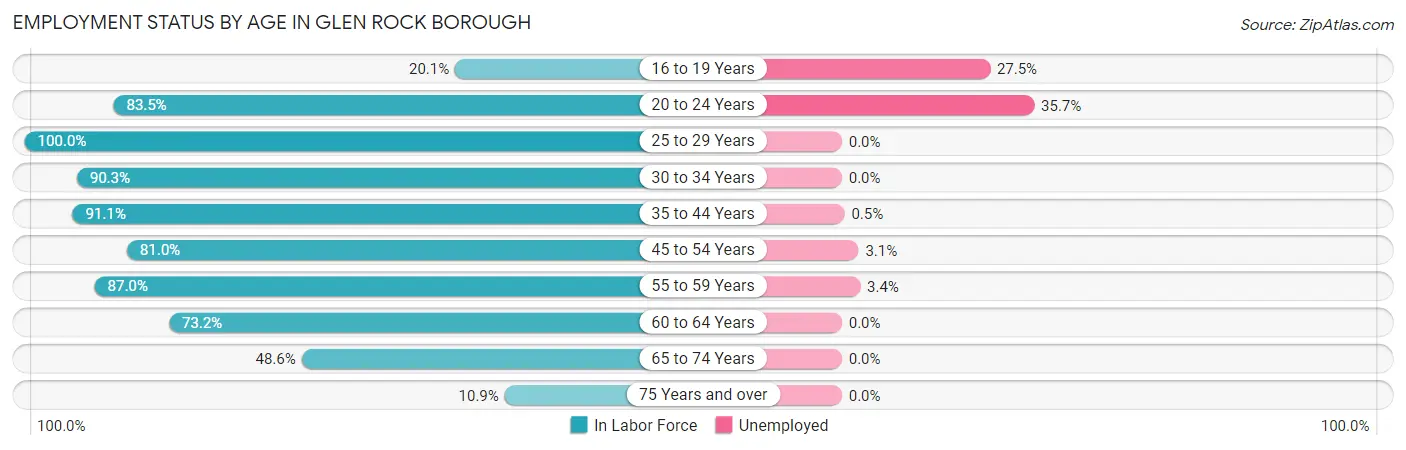
| Age Bracket | In Labor Force | Unemployed |
| 16 to 19 Years | 142 (20.1%) | 39 (27.5%) |
| 20 to 24 Years | 596 (83.5%) | 213 (35.7%) |
| 25 to 29 Years | 168 (100.0%) | 0 (0.0%) |
| 30 to 34 Years | 262 (90.3%) | 0 (0.0%) |
| 35 to 44 Years | 1,497 (91.1%) | 7 (0.5%) |
| 45 to 54 Years | 1,858 (81.0%) | 58 (3.1%) |
| 55 to 59 Years | 560 (87.0%) | 19 (3.4%) |
| 60 to 64 Years | 442 (73.2%) | 0 (0.0%) |
| 65 to 74 Years | 336 (48.6%) | 0 (0.0%) |
| 75 Years and over | 86 (10.9%) | 0 (0.0%) |
| Total | 5,945 (69.6%) | 339 (5.7%) |
Employment Status by Educational Attainment in Glen Rock borough
According to labor force statistics for Glen Rock borough, 84.8% of individuals (4,785) out of the total population between 25 and 64 years of age (5,643) are in the labor force, with 1.7% or 81 of them being unemployed. The group with the highest labor force participation rate are those with the educational attainment of bachelor's degree or higher, with 87.2% or 3,877 individuals in the labor force. Within the labor force, individuals with high school diploma education have the highest percentage of unemployment, with 3.3% or 10 of them being unemployed.
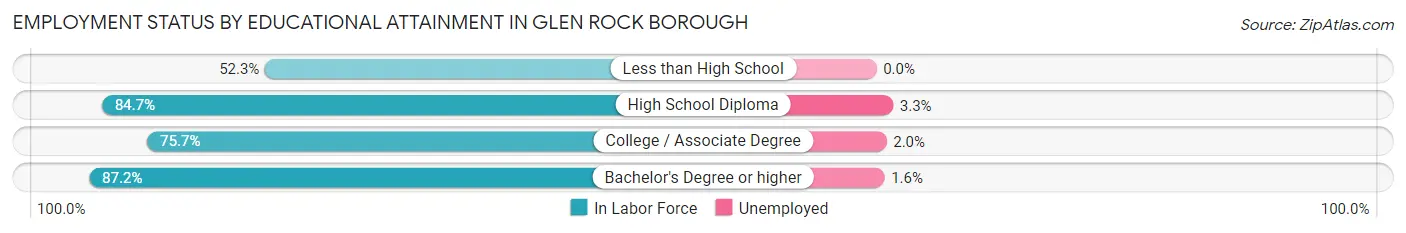
| Educational Attainment | In Labor Force | Unemployed |
| Less than High School | 58 (52.3%) | 0 (0.0%) |
| High School Diploma | 309 (84.7%) | 12 (3.3%) |
| College / Associate Degree | 546 (75.7%) | 14 (2.0%) |
| Bachelor's Degree or higher | 3,877 (87.2%) | 71 (1.6%) |
| Total | 4,785 (84.8%) | 96 (1.7%) |
Employment Occupations by Sex in Glen Rock borough
Management, Business, Science and Arts Occupations
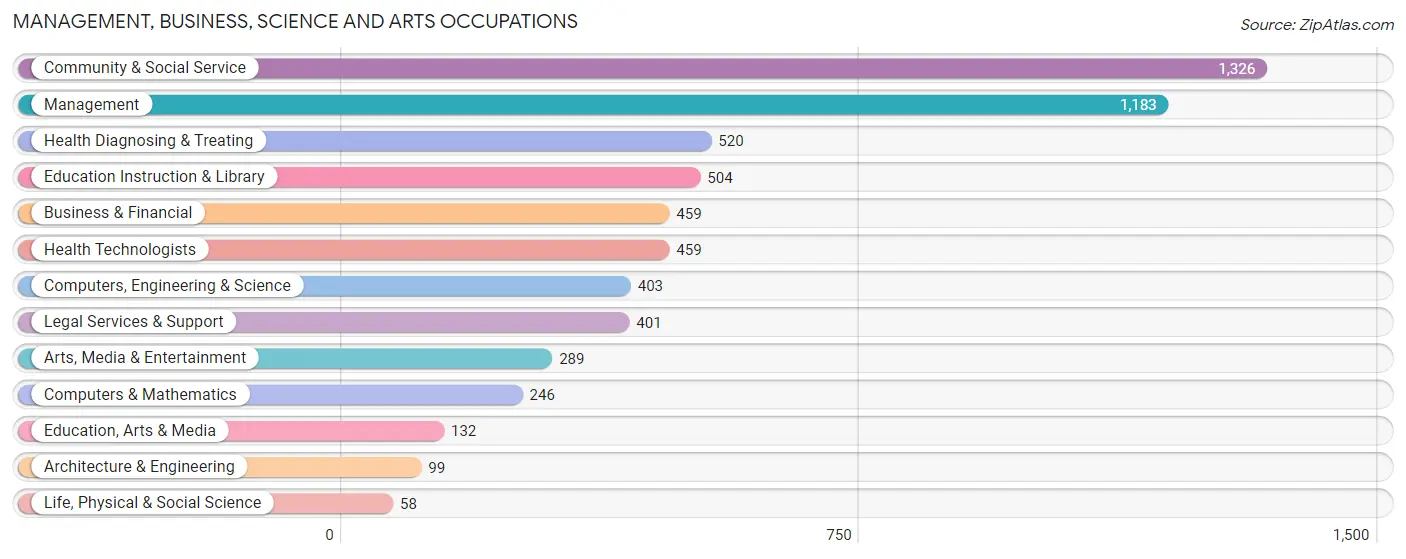
The most common Management, Business, Science and Arts occupations in Glen Rock borough are Community & Social Service (1,326 | 23.9%), Management (1,183 | 21.3%), Health Diagnosing & Treating (520 | 9.4%), Education Instruction & Library (504 | 9.1%), and Business & Financial (459 | 8.3%).
Management, Business, Science and Arts Occupations by Sex
Within the Management, Business, Science and Arts occupations in Glen Rock borough, the most male-oriented occupations are Architecture & Engineering (91.9%), Computers & Mathematics (80.1%), and Computers, Engineering & Science (77.9%), while the most female-oriented occupations are Health Technologists (82.6%), Education Instruction & Library (81.9%), and Health Diagnosing & Treating (74.8%).
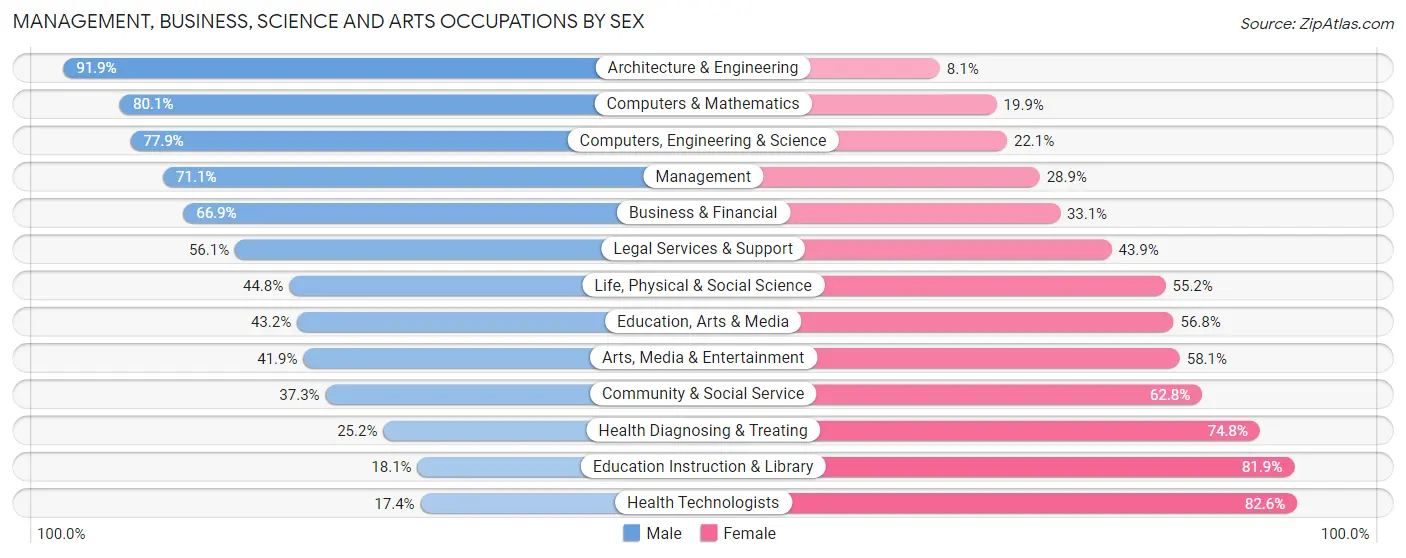
| Occupation | Male | Female |
| Management | 841 (71.1%) | 342 (28.9%) |
| Business & Financial | 307 (66.9%) | 152 (33.1%) |
| Computers, Engineering & Science | 314 (77.9%) | 89 (22.1%) |
| Computers & Mathematics | 197 (80.1%) | 49 (19.9%) |
| Architecture & Engineering | 91 (91.9%) | 8 (8.1%) |
| Life, Physical & Social Science | 26 (44.8%) | 32 (55.2%) |
| Community & Social Service | 494 (37.2%) | 832 (62.7%) |
| Education, Arts & Media | 57 (43.2%) | 75 (56.8%) |
| Legal Services & Support | 225 (56.1%) | 176 (43.9%) |
| Education Instruction & Library | 91 (18.1%) | 413 (81.9%) |
| Arts, Media & Entertainment | 121 (41.9%) | 168 (58.1%) |
| Health Diagnosing & Treating | 131 (25.2%) | 389 (74.8%) |
| Health Technologists | 80 (17.4%) | 379 (82.6%) |
| Total (Category) | 2,087 (53.6%) | 1,804 (46.4%) |
| Total (Overall) | 2,977 (53.7%) | 2,569 (46.3%) |
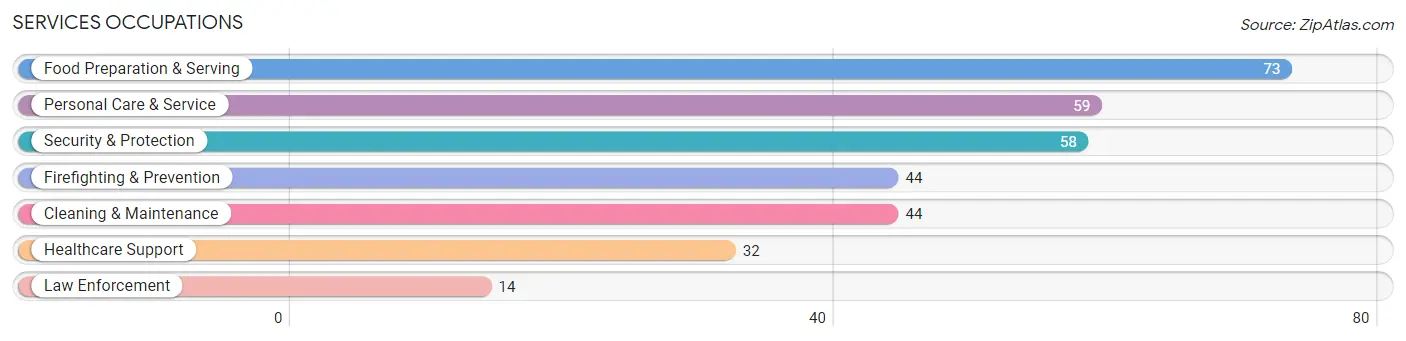
Services Occupations
The most common Services occupations in Glen Rock borough are Food Preparation & Serving (73 | 1.3%), Personal Care & Service (59 | 1.1%), Security & Protection (58 | 1.1%), Firefighting & Prevention (44 | 0.8%), and Cleaning & Maintenance (44 | 0.8%).
Services Occupations by Sex
Within the Services occupations in Glen Rock borough, the most male-oriented occupations are Security & Protection (100.0%), Firefighting & Prevention (100.0%), and Law Enforcement (100.0%), while the most female-oriented occupations are Healthcare Support (100.0%), Personal Care & Service (81.4%), and Food Preparation & Serving (50.7%).
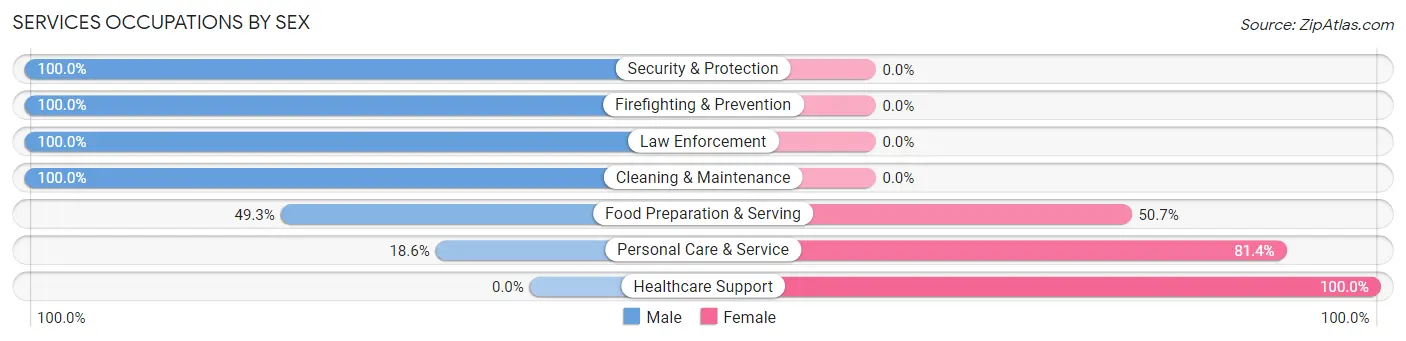
| Occupation | Male | Female |
| Healthcare Support | 0 (0.0%) | 32 (100.0%) |
| Security & Protection | 58 (100.0%) | 0 (0.0%) |
| Firefighting & Prevention | 44 (100.0%) | 0 (0.0%) |
| Law Enforcement | 14 (100.0%) | 0 (0.0%) |
| Food Preparation & Serving | 36 (49.3%) | 37 (50.7%) |
| Cleaning & Maintenance | 44 (100.0%) | 0 (0.0%) |
| Personal Care & Service | 11 (18.6%) | 48 (81.4%) |
| Total (Category) | 149 (56.0%) | 117 (44.0%) |
| Total (Overall) | 2,977 (53.7%) | 2,569 (46.3%) |
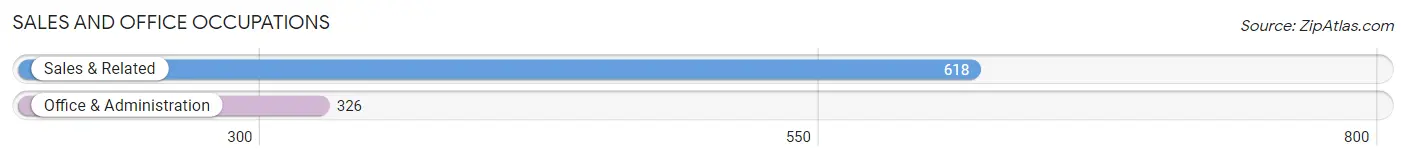
Sales and Office Occupations
The most common Sales and Office occupations in Glen Rock borough are Sales & Related (618 | 11.1%), and Office & Administration (326 | 5.9%).
Sales and Office Occupations by Sex
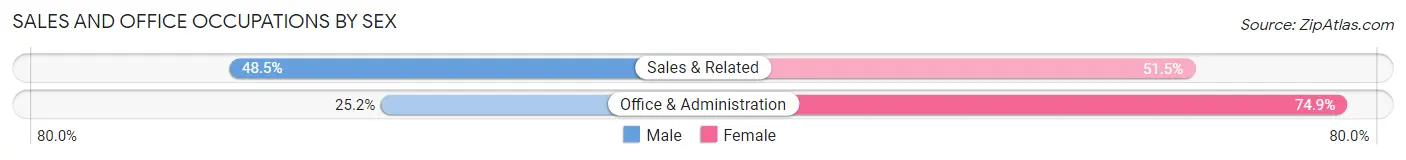
| Occupation | Male | Female |
| Sales & Related | 300 (48.5%) | 318 (51.5%) |
| Office & Administration | 82 (25.2%) | 244 (74.9%) |
| Total (Category) | 382 (40.5%) | 562 (59.5%) |
| Total (Overall) | 2,977 (53.7%) | 2,569 (46.3%) |
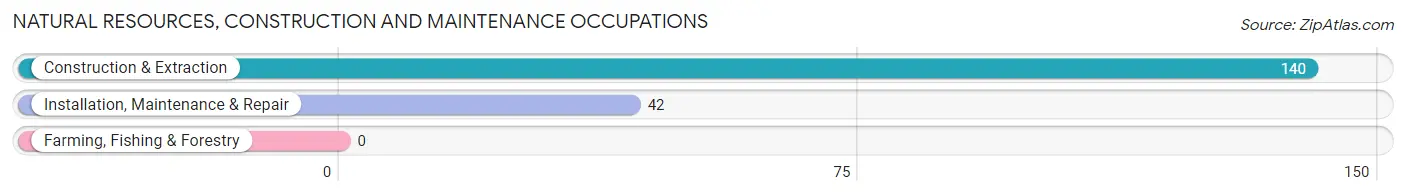
Natural Resources, Construction and Maintenance Occupations
The most common Natural Resources, Construction and Maintenance occupations in Glen Rock borough are Construction & Extraction (140 | 2.5%), and Installation, Maintenance & Repair (42 | 0.8%).
Natural Resources, Construction and Maintenance Occupations by Sex
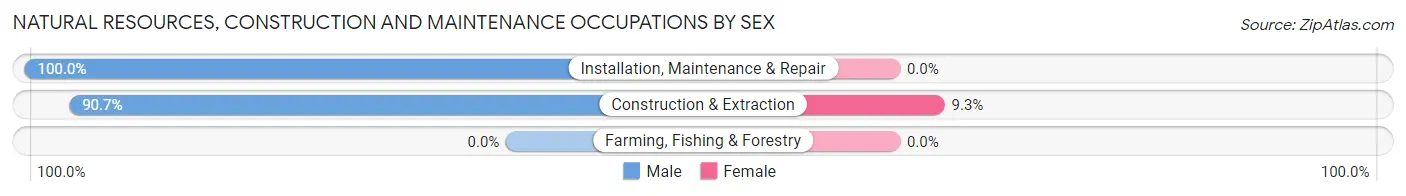
| Occupation | Male | Female |
| Farming, Fishing & Forestry | 0 (0.0%) | 0 (0.0%) |
| Construction & Extraction | 127 (90.7%) | 13 (9.3%) |
| Installation, Maintenance & Repair | 42 (100.0%) | 0 (0.0%) |
| Total (Category) | 169 (92.9%) | 13 (7.1%) |
| Total (Overall) | 2,977 (53.7%) | 2,569 (46.3%) |
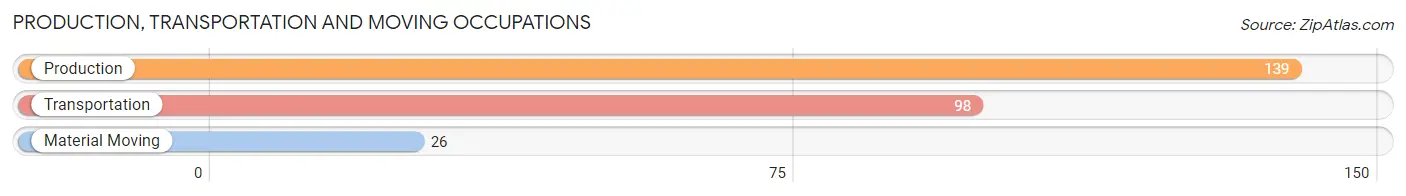
Production, Transportation and Moving Occupations
The most common Production, Transportation and Moving occupations in Glen Rock borough are Production (139 | 2.5%), Transportation (98 | 1.8%), and Material Moving (26 | 0.5%).
Production, Transportation and Moving Occupations by Sex
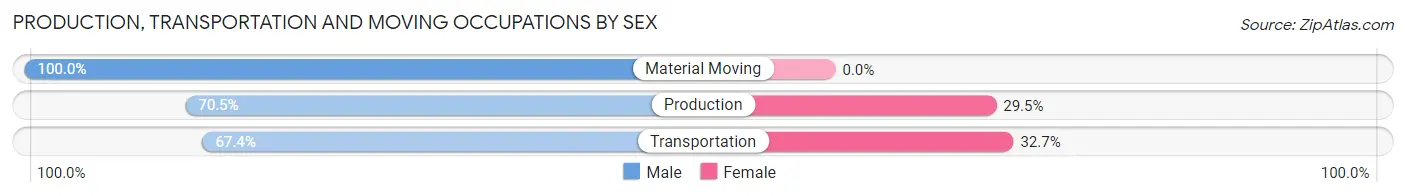
| Occupation | Male | Female |
| Production | 98 (70.5%) | 41 (29.5%) |
| Transportation | 66 (67.3%) | 32 (32.7%) |
| Material Moving | 26 (100.0%) | 0 (0.0%) |
| Total (Category) | 190 (72.2%) | 73 (27.8%) |
| Total (Overall) | 2,977 (53.7%) | 2,569 (46.3%) |
Employment Industries by Sex in Glen Rock borough
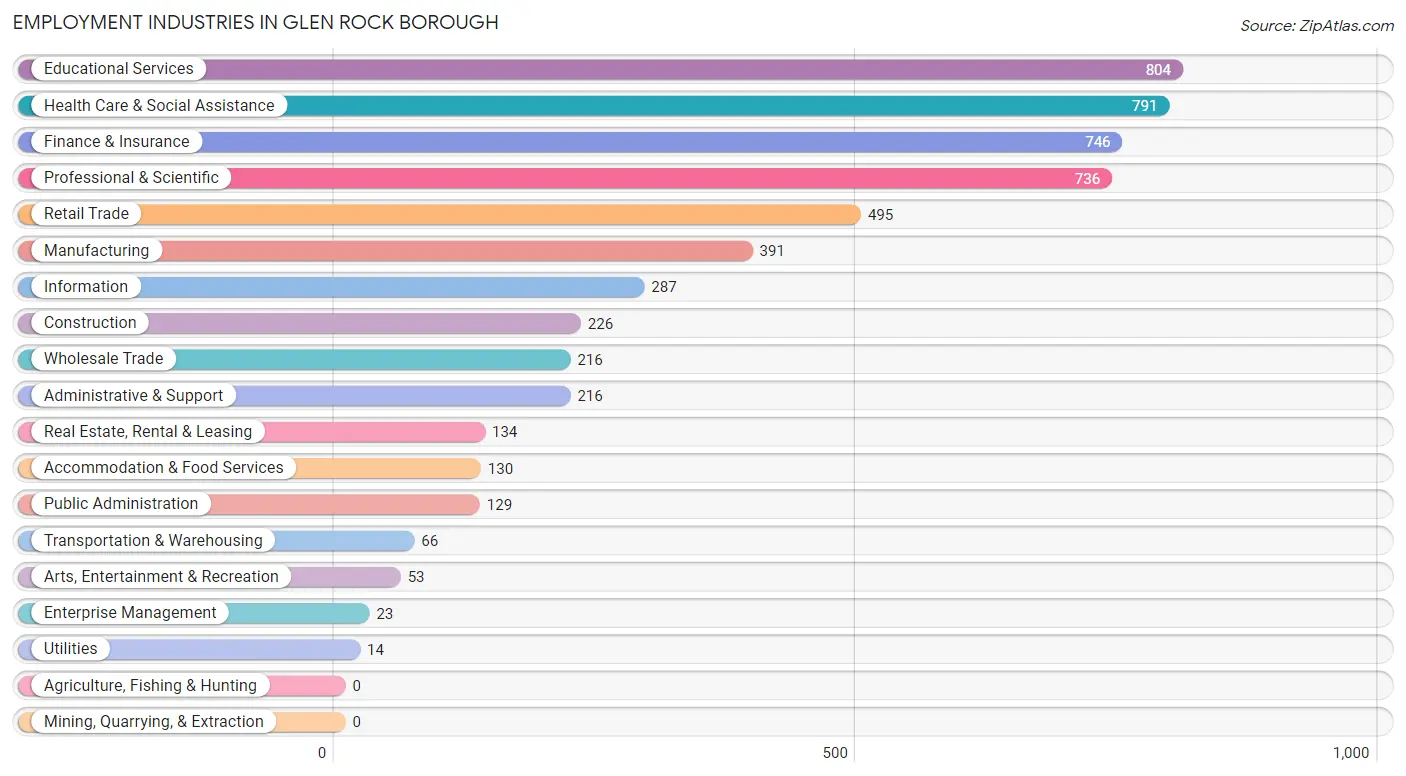
Employment Industries in Glen Rock borough
The major employment industries in Glen Rock borough include Educational Services (804 | 14.5%), Health Care & Social Assistance (791 | 14.3%), Finance & Insurance (746 | 13.5%), Professional & Scientific (736 | 13.3%), and Retail Trade (495 | 8.9%).
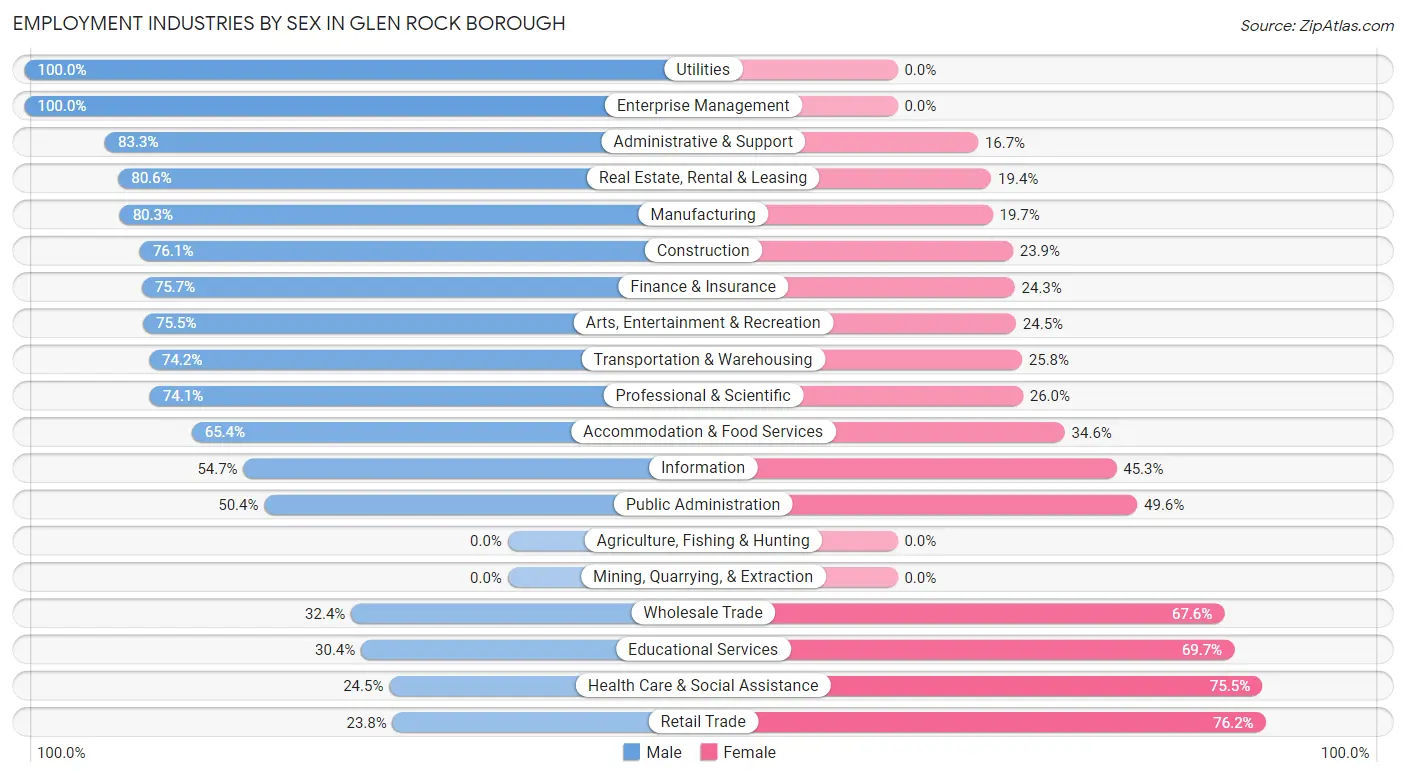
Employment Industries by Sex in Glen Rock borough
The Glen Rock borough industries that see more men than women are Utilities (100.0%), Enterprise Management (100.0%), and Administrative & Support (83.3%), whereas the industries that tend to have a higher number of women are Retail Trade (76.2%), Health Care & Social Assistance (75.5%), and Educational Services (69.7%).
| Industry | Male | Female |
| Agriculture, Fishing & Hunting | 0 (0.0%) | 0 (0.0%) |
| Mining, Quarrying, & Extraction | 0 (0.0%) | 0 (0.0%) |
| Construction | 172 (76.1%) | 54 (23.9%) |
| Manufacturing | 314 (80.3%) | 77 (19.7%) |
| Wholesale Trade | 70 (32.4%) | 146 (67.6%) |
| Retail Trade | 118 (23.8%) | 377 (76.2%) |
| Transportation & Warehousing | 49 (74.2%) | 17 (25.8%) |
| Utilities | 14 (100.0%) | 0 (0.0%) |
| Information | 157 (54.7%) | 130 (45.3%) |
| Finance & Insurance | 565 (75.7%) | 181 (24.3%) |
| Real Estate, Rental & Leasing | 108 (80.6%) | 26 (19.4%) |
| Professional & Scientific | 545 (74.1%) | 191 (26.0%) |
| Enterprise Management | 23 (100.0%) | 0 (0.0%) |
| Administrative & Support | 180 (83.3%) | 36 (16.7%) |
| Educational Services | 244 (30.3%) | 560 (69.7%) |
| Health Care & Social Assistance | 194 (24.5%) | 597 (75.5%) |
| Arts, Entertainment & Recreation | 40 (75.5%) | 13 (24.5%) |
| Accommodation & Food Services | 85 (65.4%) | 45 (34.6%) |
| Public Administration | 65 (50.4%) | 64 (49.6%) |
| Total | 2,977 (53.7%) | 2,569 (46.3%) |
Education in Glen Rock borough
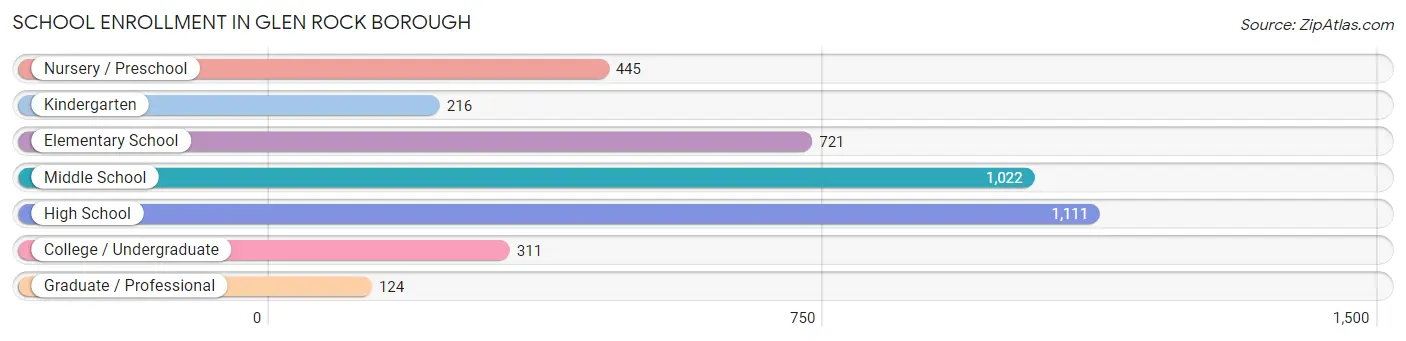
School Enrollment in Glen Rock borough
The most common levels of schooling among the 3,950 students in Glen Rock borough are high school (1,111 | 28.1%), middle school (1,022 | 25.9%), and elementary school (721 | 18.2%).
| School Level | # Students | % Students |
| Nursery / Preschool | 445 | 11.3% |
| Kindergarten | 216 | 5.5% |
| Elementary School | 721 | 18.2% |
| Middle School | 1,022 | 25.9% |
| High School | 1,111 | 28.1% |
| College / Undergraduate | 311 | 7.9% |
| Graduate / Professional | 124 | 3.1% |
| Total | 3,950 | 100.0% |
School Enrollment by Age by Funding Source in Glen Rock borough
Out of a total of 3,950 students who are enrolled in schools in Glen Rock borough, 687 (17.4%) attend a private institution, while the remaining 3,263 (82.6%) are enrolled in public schools. The age group of 3 to 4 year olds has the highest likelihood of being enrolled in private schools, with 214 (57.5% in the age bracket) enrolled. Conversely, the age group of 15 to 17 year olds has the lowest likelihood of being enrolled in a private school, with 720 (98.4% in the age bracket) attending a public institution.
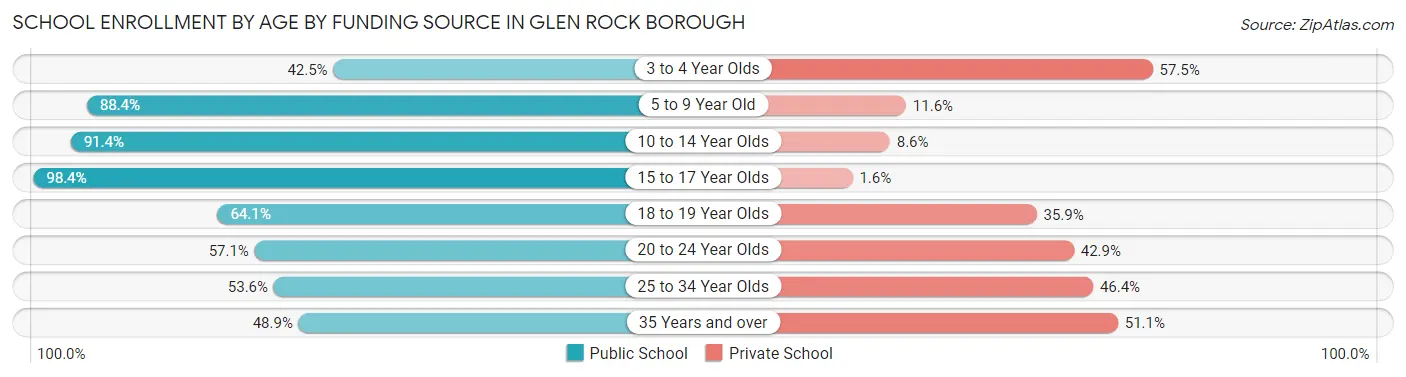
| Age Bracket | Public School | Private School |
| 3 to 4 Year Olds | 158 (42.5%) | 214 (57.5%) |
| 5 to 9 Year Old | 786 (88.4%) | 103 (11.6%) |
| 10 to 14 Year Olds | 1,267 (91.4%) | 119 (8.6%) |
| 15 to 17 Year Olds | 720 (98.4%) | 12 (1.6%) |
| 18 to 19 Year Olds | 107 (64.1%) | 60 (35.9%) |
| 20 to 24 Year Olds | 188 (57.1%) | 141 (42.9%) |
| 25 to 34 Year Olds | 15 (53.6%) | 13 (46.4%) |
| 35 Years and over | 23 (48.9%) | 24 (51.1%) |
| Total | 3,263 (82.6%) | 687 (17.4%) |
Educational Attainment by Field of Study in Glen Rock borough
Business (1,421 | 24.5%), social sciences (697 | 12.0%), liberal arts & history (508 | 8.7%), engineering (440 | 7.6%), and education (431 | 7.4%) are the most common fields of study among 5,804 individuals in Glen Rock borough who have obtained a bachelor's degree or higher.
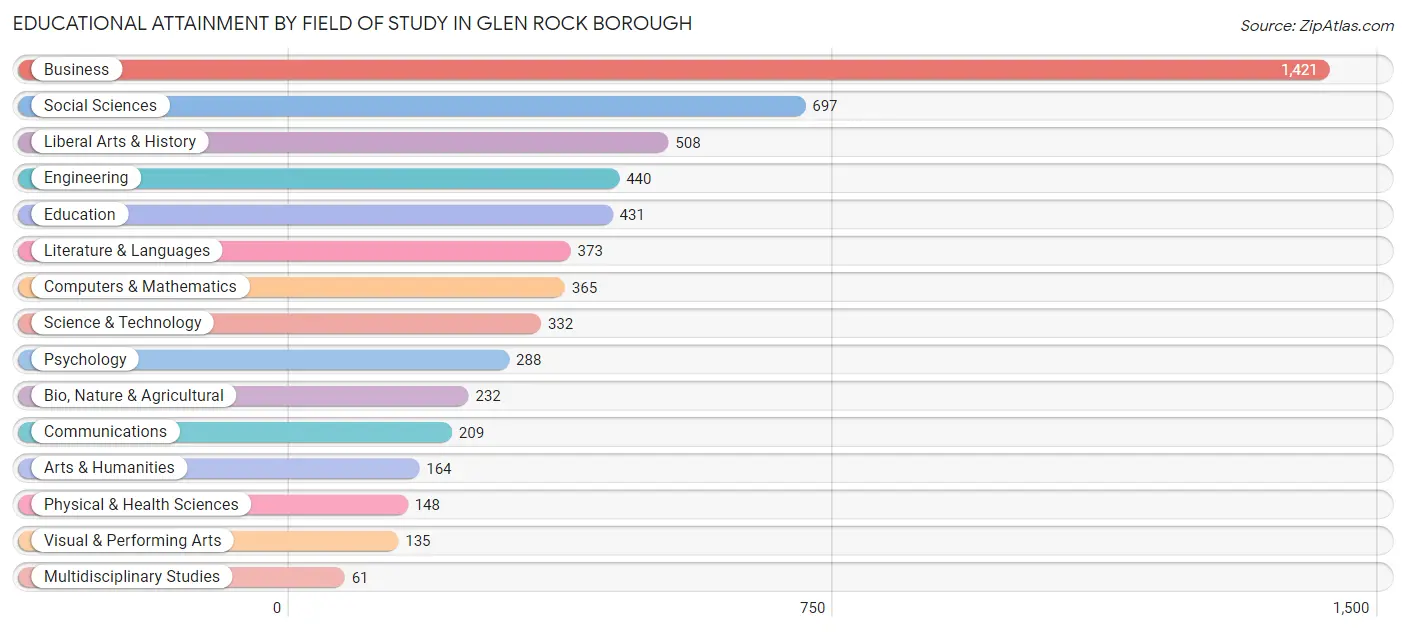
| Field of Study | # Graduates | % Graduates |
| Computers & Mathematics | 365 | 6.3% |
| Bio, Nature & Agricultural | 232 | 4.0% |
| Physical & Health Sciences | 148 | 2.5% |
| Psychology | 288 | 5.0% |
| Social Sciences | 697 | 12.0% |
| Engineering | 440 | 7.6% |
| Multidisciplinary Studies | 61 | 1.1% |
| Science & Technology | 332 | 5.7% |
| Business | 1,421 | 24.5% |
| Education | 431 | 7.4% |
| Literature & Languages | 373 | 6.4% |
| Liberal Arts & History | 508 | 8.7% |
| Visual & Performing Arts | 135 | 2.3% |
| Communications | 209 | 3.6% |
| Arts & Humanities | 164 | 2.8% |
| Total | 5,804 | 100.0% |
Transportation & Commute in Glen Rock borough
Vehicle Availability by Sex in Glen Rock borough
The most prevalent vehicle ownership categories in Glen Rock borough are males with 2 vehicles (1,575, accounting for 54.0%) and females with 2 vehicles (1,436, making up 63.0%).
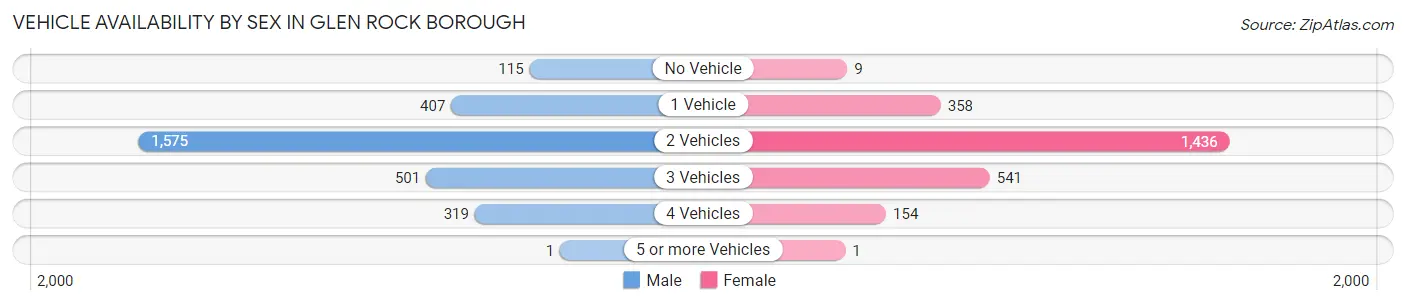
| Vehicles Available | Male | Female |
| No Vehicle | 115 (3.9%) | 9 (0.4%) |
| 1 Vehicle | 407 (14.0%) | 358 (14.3%) |
| 2 Vehicles | 1,575 (54.0%) | 1,436 (57.5%) |
| 3 Vehicles | 501 (17.2%) | 541 (21.6%) |
| 4 Vehicles | 319 (10.9%) | 154 (6.2%) |
| 5 or more Vehicles | 1 (0.0%) | 1 (0.0%) |
| Total | 2,918 (100.0%) | 2,499 (100.0%) |
Commute Time in Glen Rock borough
The most frequently occuring commute durations in Glen Rock borough are 60 to 89 minutes (732 commuters, 20.0%), 20 to 24 minutes (433 commuters, 11.8%), and 40 to 44 minutes (385 commuters, 10.5%).
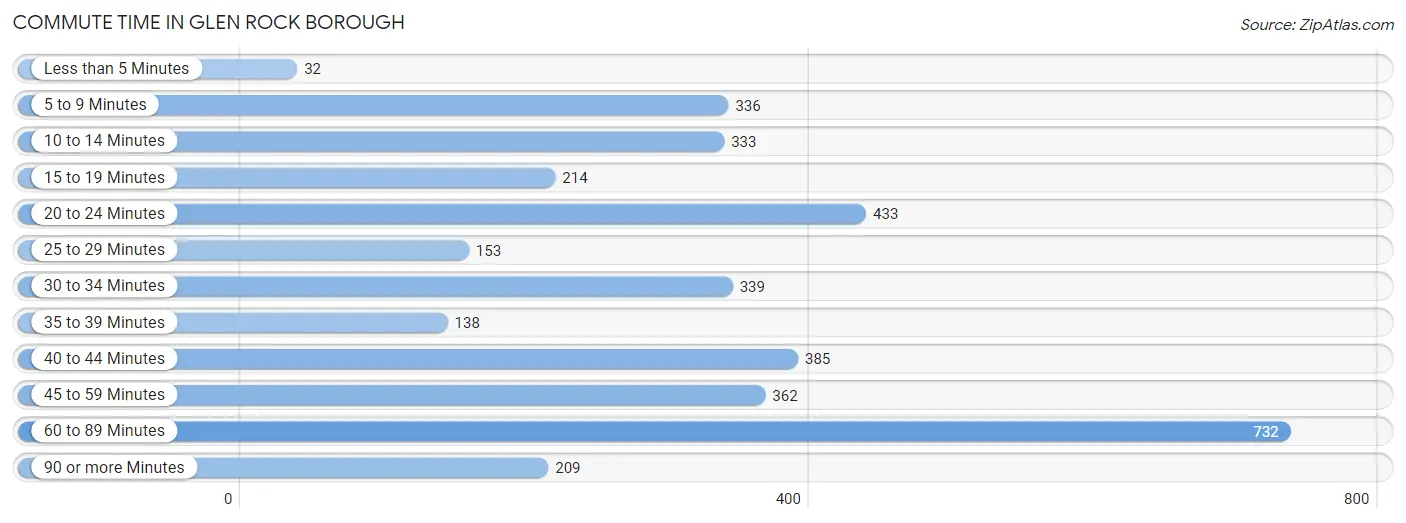
| Commute Time | # Commuters | % Commuters |
| Less than 5 Minutes | 32 | 0.9% |
| 5 to 9 Minutes | 336 | 9.2% |
| 10 to 14 Minutes | 333 | 9.1% |
| 15 to 19 Minutes | 214 | 5.8% |
| 20 to 24 Minutes | 433 | 11.8% |
| 25 to 29 Minutes | 153 | 4.2% |
| 30 to 34 Minutes | 339 | 9.2% |
| 35 to 39 Minutes | 138 | 3.8% |
| 40 to 44 Minutes | 385 | 10.5% |
| 45 to 59 Minutes | 362 | 9.9% |
| 60 to 89 Minutes | 732 | 20.0% |
| 90 or more Minutes | 209 | 5.7% |
Commute Time by Sex in Glen Rock borough
The most common commute times in Glen Rock borough are 60 to 89 minutes (476 commuters, 24.2%) for males and 60 to 89 minutes (256 commuters, 15.1%) for females.
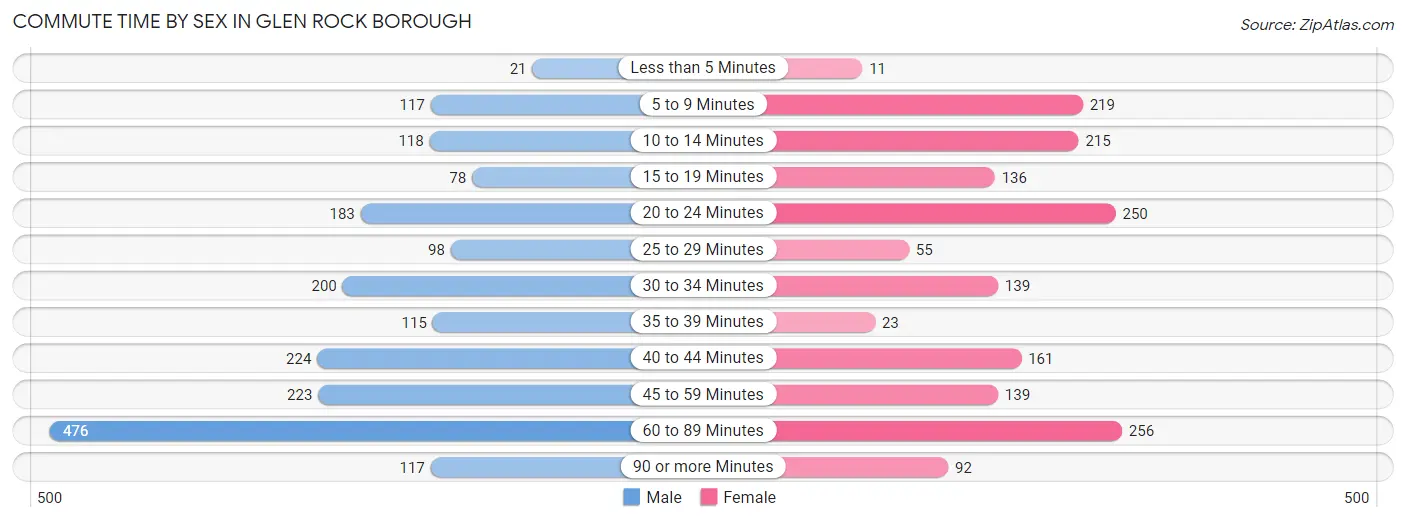
| Commute Time | Male | Female |
| Less than 5 Minutes | 21 (1.1%) | 11 (0.6%) |
| 5 to 9 Minutes | 117 (5.9%) | 219 (12.9%) |
| 10 to 14 Minutes | 118 (6.0%) | 215 (12.7%) |
| 15 to 19 Minutes | 78 (4.0%) | 136 (8.0%) |
| 20 to 24 Minutes | 183 (9.3%) | 250 (14.7%) |
| 25 to 29 Minutes | 98 (5.0%) | 55 (3.2%) |
| 30 to 34 Minutes | 200 (10.2%) | 139 (8.2%) |
| 35 to 39 Minutes | 115 (5.8%) | 23 (1.4%) |
| 40 to 44 Minutes | 224 (11.4%) | 161 (9.5%) |
| 45 to 59 Minutes | 223 (11.3%) | 139 (8.2%) |
| 60 to 89 Minutes | 476 (24.2%) | 256 (15.1%) |
| 90 or more Minutes | 117 (5.9%) | 92 (5.4%) |
Time of Departure to Work by Sex in Glen Rock borough
The most frequent times of departure to work in Glen Rock borough are 8:00 AM to 8:29 AM (467, 23.7%) for males and 7:30 AM to 7:59 AM (361, 21.3%) for females.
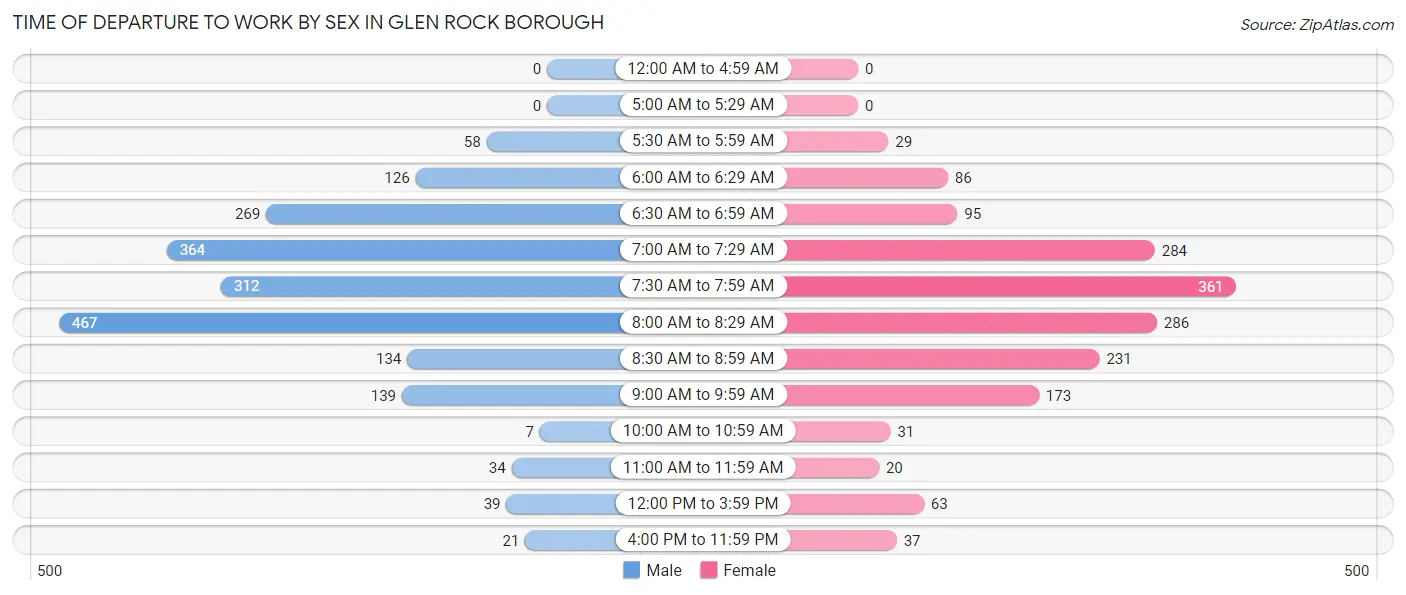
| Time of Departure | Male | Female |
| 12:00 AM to 4:59 AM | 0 (0.0%) | 0 (0.0%) |
| 5:00 AM to 5:29 AM | 0 (0.0%) | 0 (0.0%) |
| 5:30 AM to 5:59 AM | 58 (2.9%) | 29 (1.7%) |
| 6:00 AM to 6:29 AM | 126 (6.4%) | 86 (5.1%) |
| 6:30 AM to 6:59 AM | 269 (13.7%) | 95 (5.6%) |
| 7:00 AM to 7:29 AM | 364 (18.5%) | 284 (16.8%) |
| 7:30 AM to 7:59 AM | 312 (15.8%) | 361 (21.3%) |
| 8:00 AM to 8:29 AM | 467 (23.7%) | 286 (16.9%) |
| 8:30 AM to 8:59 AM | 134 (6.8%) | 231 (13.6%) |
| 9:00 AM to 9:59 AM | 139 (7.1%) | 173 (10.2%) |
| 10:00 AM to 10:59 AM | 7 (0.4%) | 31 (1.8%) |
| 11:00 AM to 11:59 AM | 34 (1.7%) | 20 (1.2%) |
| 12:00 PM to 3:59 PM | 39 (2.0%) | 63 (3.7%) |
| 4:00 PM to 11:59 PM | 21 (1.1%) | 37 (2.2%) |
| Total | 1,970 (100.0%) | 1,696 (100.0%) |
Housing Occupancy in Glen Rock borough
Occupancy by Ownership in Glen Rock borough
Of the total 3,652 dwellings in Glen Rock borough, owner-occupied units account for 3,298 (90.3%), while renter-occupied units make up 354 (9.7%).
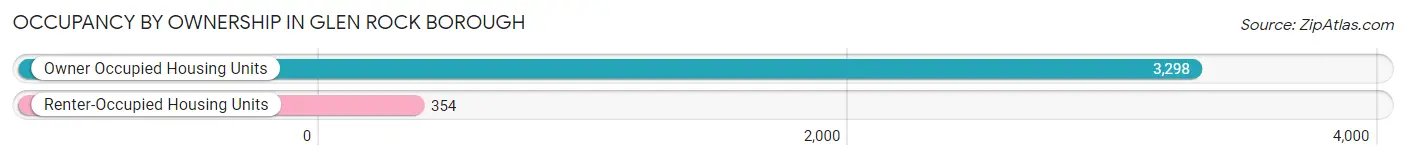
| Occupancy | # Housing Units | % Housing Units |
| Owner Occupied Housing Units | 3,298 | 90.3% |
| Renter-Occupied Housing Units | 354 | 9.7% |
| Total Occupied Housing Units | 3,652 | 100.0% |
Occupancy by Household Size in Glen Rock borough
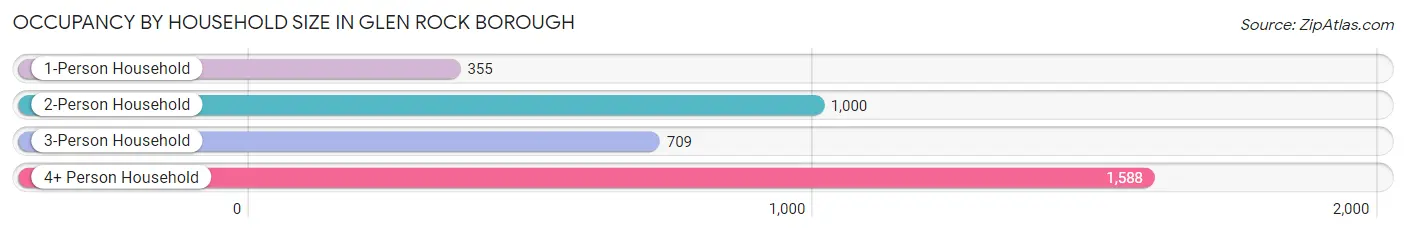
| Household Size | # Housing Units | % Housing Units |
| 1-Person Household | 355 | 9.7% |
| 2-Person Household | 1,000 | 27.4% |
| 3-Person Household | 709 | 19.4% |
| 4+ Person Household | 1,588 | 43.5% |
| Total Housing Units | 3,652 | 100.0% |
Occupancy by Ownership by Household Size in Glen Rock borough
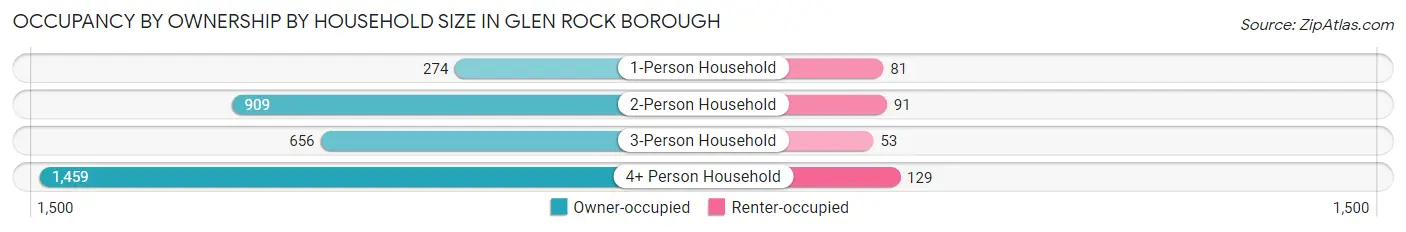
| Household Size | Owner-occupied | Renter-occupied |
| 1-Person Household | 274 (77.2%) | 81 (22.8%) |
| 2-Person Household | 909 (90.9%) | 91 (9.1%) |
| 3-Person Household | 656 (92.5%) | 53 (7.5%) |
| 4+ Person Household | 1,459 (91.9%) | 129 (8.1%) |
| Total Housing Units | 3,298 (90.3%) | 354 (9.7%) |
Occupancy by Educational Attainment in Glen Rock borough
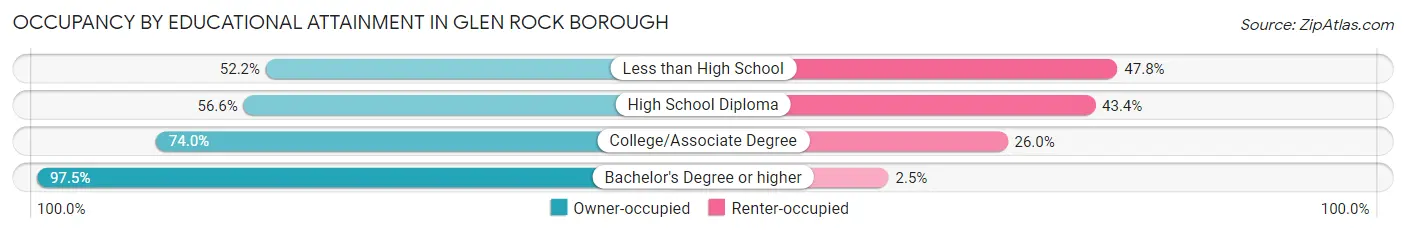
| Household Size | Owner-occupied | Renter-occupied |
| Less than High School | 36 (52.2%) | 33 (47.8%) |
| High School Diploma | 189 (56.6%) | 145 (43.4%) |
| College/Associate Degree | 301 (74.0%) | 106 (26.0%) |
| Bachelor's Degree or higher | 2,772 (97.5%) | 70 (2.5%) |
Occupancy by Age of Householder in Glen Rock borough
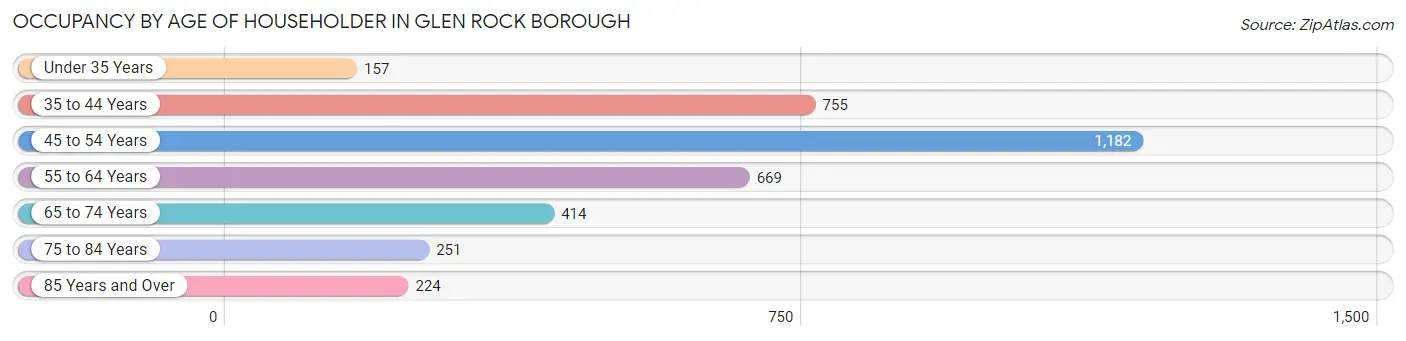
| Age Bracket | # Households | % Households |
| Under 35 Years | 157 | 4.3% |
| 35 to 44 Years | 755 | 20.7% |
| 45 to 54 Years | 1,182 | 32.4% |
| 55 to 64 Years | 669 | 18.3% |
| 65 to 74 Years | 414 | 11.3% |
| 75 to 84 Years | 251 | 6.9% |
| 85 Years and Over | 224 | 6.1% |
| Total | 3,652 | 100.0% |
Housing Finances in Glen Rock borough
Median Income by Occupancy in Glen Rock borough
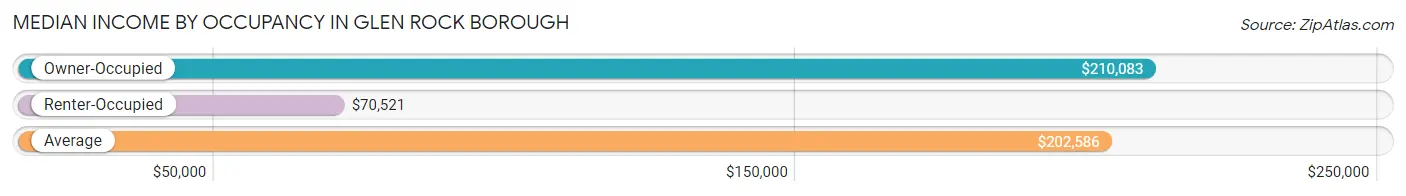
| Occupancy Type | # Households | Median Income |
| Owner-Occupied | 3,298 (90.3%) | $210,083 |
| Renter-Occupied | 354 (9.7%) | $70,521 |
| Average | 3,652 (100.0%) | $202,586 |
Occupancy by Householder Income Bracket in Glen Rock borough
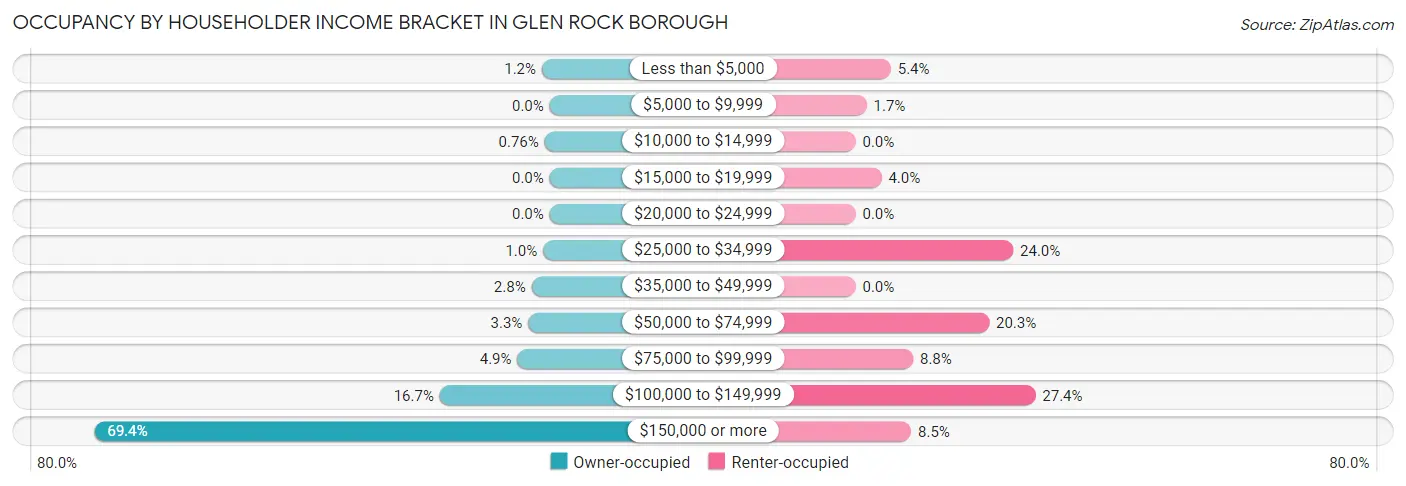
| Income Bracket | Owner-occupied | Renter-occupied |
| Less than $5,000 | 39 (1.2%) | 19 (5.4%) |
| $5,000 to $9,999 | 0 (0.0%) | 6 (1.7%) |
| $10,000 to $14,999 | 25 (0.8%) | 0 (0.0%) |
| $15,000 to $19,999 | 0 (0.0%) | 14 (4.0%) |
| $20,000 to $24,999 | 0 (0.0%) | 0 (0.0%) |
| $25,000 to $34,999 | 33 (1.0%) | 85 (24.0%) |
| $35,000 to $49,999 | 91 (2.8%) | 0 (0.0%) |
| $50,000 to $74,999 | 108 (3.3%) | 72 (20.3%) |
| $75,000 to $99,999 | 162 (4.9%) | 31 (8.8%) |
| $100,000 to $149,999 | 552 (16.7%) | 97 (27.4%) |
| $150,000 or more | 2,288 (69.4%) | 30 (8.5%) |
| Total | 3,298 (100.0%) | 354 (100.0%) |
Monthly Housing Cost Tiers in Glen Rock borough
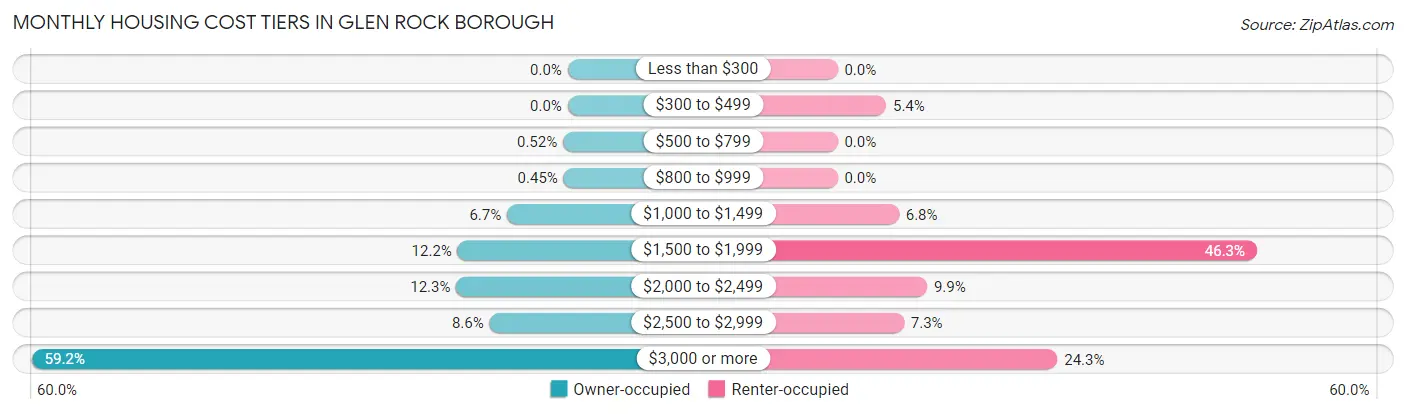
| Monthly Cost | Owner-occupied | Renter-occupied |
| Less than $300 | 0 (0.0%) | 0 (0.0%) |
| $300 to $499 | 0 (0.0%) | 19 (5.4%) |
| $500 to $799 | 17 (0.5%) | 0 (0.0%) |
| $800 to $999 | 15 (0.4%) | 0 (0.0%) |
| $1,000 to $1,499 | 221 (6.7%) | 24 (6.8%) |
| $1,500 to $1,999 | 401 (12.2%) | 164 (46.3%) |
| $2,000 to $2,499 | 406 (12.3%) | 35 (9.9%) |
| $2,500 to $2,999 | 285 (8.6%) | 26 (7.3%) |
| $3,000 or more | 1,953 (59.2%) | 86 (24.3%) |
| Total | 3,298 (100.0%) | 354 (100.0%) |
Physical Housing Characteristics in Glen Rock borough
Housing Structures in Glen Rock borough
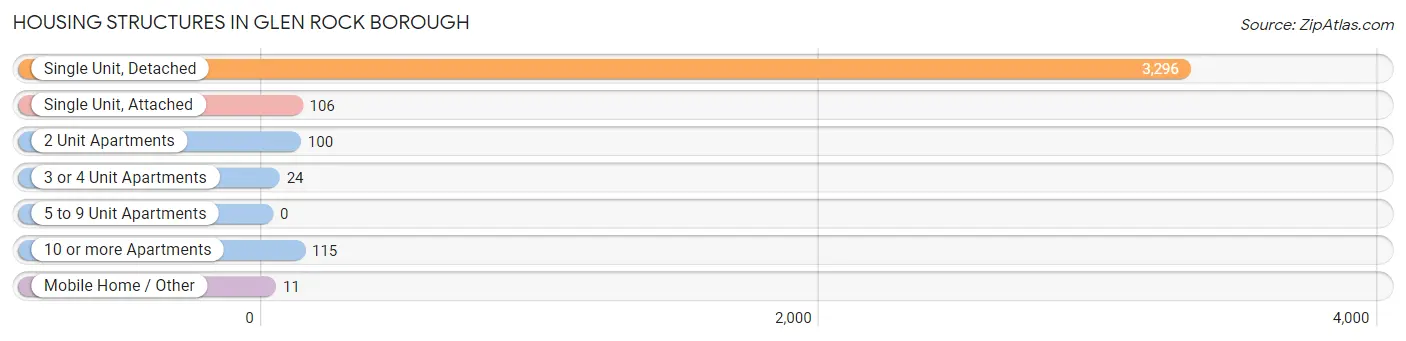
| Structure Type | # Housing Units | % Housing Units |
| Single Unit, Detached | 3,296 | 90.2% |
| Single Unit, Attached | 106 | 2.9% |
| 2 Unit Apartments | 100 | 2.7% |
| 3 or 4 Unit Apartments | 24 | 0.7% |
| 5 to 9 Unit Apartments | 0 | 0.0% |
| 10 or more Apartments | 115 | 3.2% |
| Mobile Home / Other | 11 | 0.3% |
| Total | 3,652 | 100.0% |
Housing Structures by Occupancy in Glen Rock borough
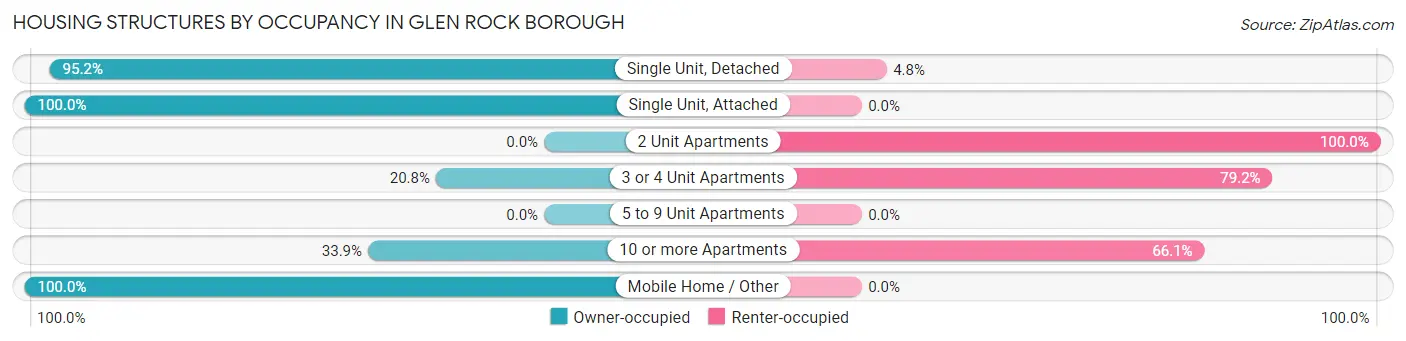
| Structure Type | Owner-occupied | Renter-occupied |
| Single Unit, Detached | 3,137 (95.2%) | 159 (4.8%) |
| Single Unit, Attached | 106 (100.0%) | 0 (0.0%) |
| 2 Unit Apartments | 0 (0.0%) | 100 (100.0%) |
| 3 or 4 Unit Apartments | 5 (20.8%) | 19 (79.2%) |
| 5 to 9 Unit Apartments | 0 (0.0%) | 0 (0.0%) |
| 10 or more Apartments | 39 (33.9%) | 76 (66.1%) |
| Mobile Home / Other | 11 (100.0%) | 0 (0.0%) |
| Total | 3,298 (90.3%) | 354 (9.7%) |
Housing Structures by Number of Rooms in Glen Rock borough
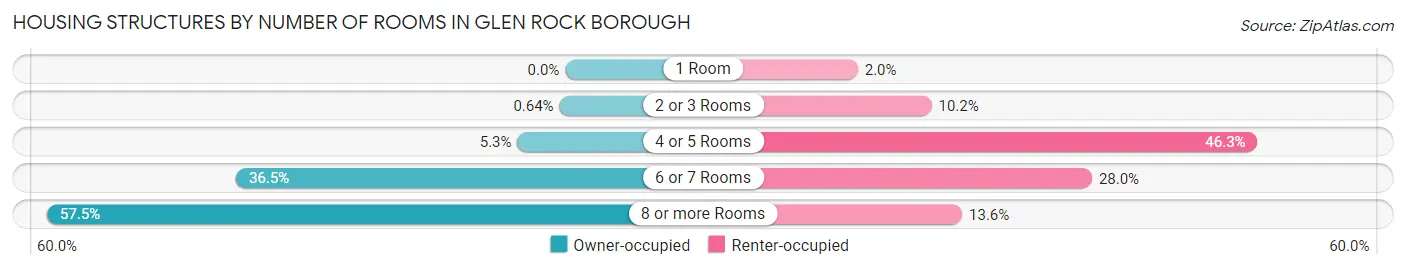
| Number of Rooms | Owner-occupied | Renter-occupied |
| 1 Room | 0 (0.0%) | 7 (2.0%) |
| 2 or 3 Rooms | 21 (0.6%) | 36 (10.2%) |
| 4 or 5 Rooms | 175 (5.3%) | 164 (46.3%) |
| 6 or 7 Rooms | 1,205 (36.5%) | 99 (28.0%) |
| 8 or more Rooms | 1,897 (57.5%) | 48 (13.6%) |
| Total | 3,298 (100.0%) | 354 (100.0%) |
Housing Structure by Heating Type in Glen Rock borough
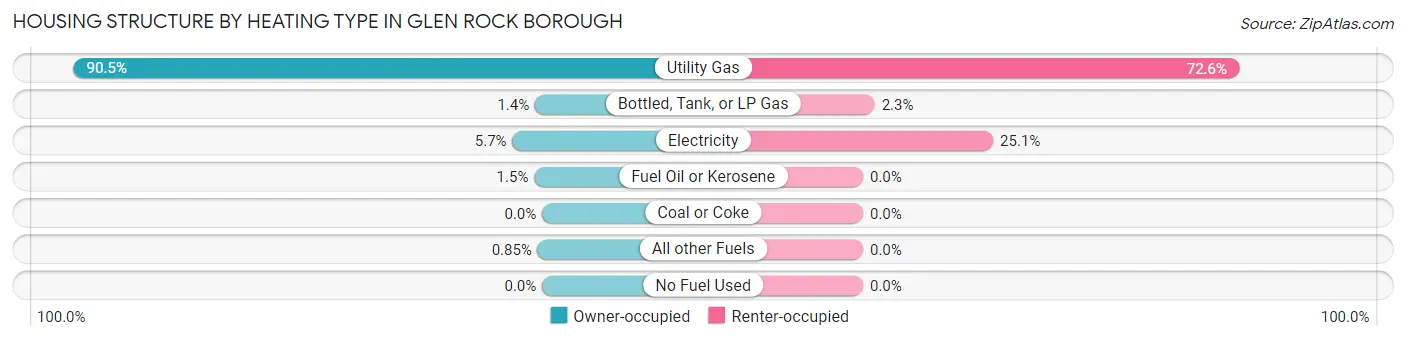
| Heating Type | Owner-occupied | Renter-occupied |
| Utility Gas | 2,986 (90.5%) | 257 (72.6%) |
| Bottled, Tank, or LP Gas | 45 (1.4%) | 8 (2.3%) |
| Electricity | 189 (5.7%) | 89 (25.1%) |
| Fuel Oil or Kerosene | 50 (1.5%) | 0 (0.0%) |
| Coal or Coke | 0 (0.0%) | 0 (0.0%) |
| All other Fuels | 28 (0.9%) | 0 (0.0%) |
| No Fuel Used | 0 (0.0%) | 0 (0.0%) |
| Total | 3,298 (100.0%) | 354 (100.0%) |
Household Vehicle Usage in Glen Rock borough
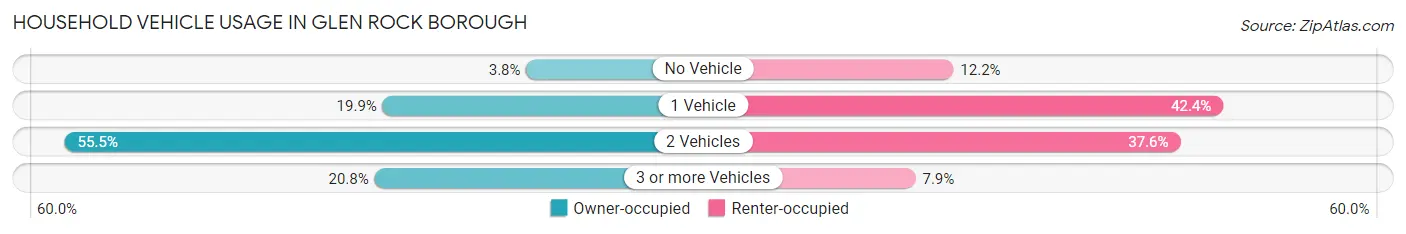
| Vehicles per Household | Owner-occupied | Renter-occupied |
| No Vehicle | 125 (3.8%) | 43 (12.1%) |
| 1 Vehicle | 656 (19.9%) | 150 (42.4%) |
| 2 Vehicles | 1,831 (55.5%) | 133 (37.6%) |
| 3 or more Vehicles | 686 (20.8%) | 28 (7.9%) |
| Total | 3,298 (100.0%) | 354 (100.0%) |
Real Estate & Mortgages in Glen Rock borough
Real Estate and Mortgage Overview in Glen Rock borough
| Characteristic | Without Mortgage | With Mortgage |
| Housing Units | 1,192 | 2,106 |
| Median Property Value | $759,400 | $797,100 |
| Median Household Income | $193,611 | $1,561 |
| Monthly Housing Costs | $1,501 | $1,740 |
| Real Estate Taxes | $10,001 | $42 |
Property Value by Mortgage Status in Glen Rock borough
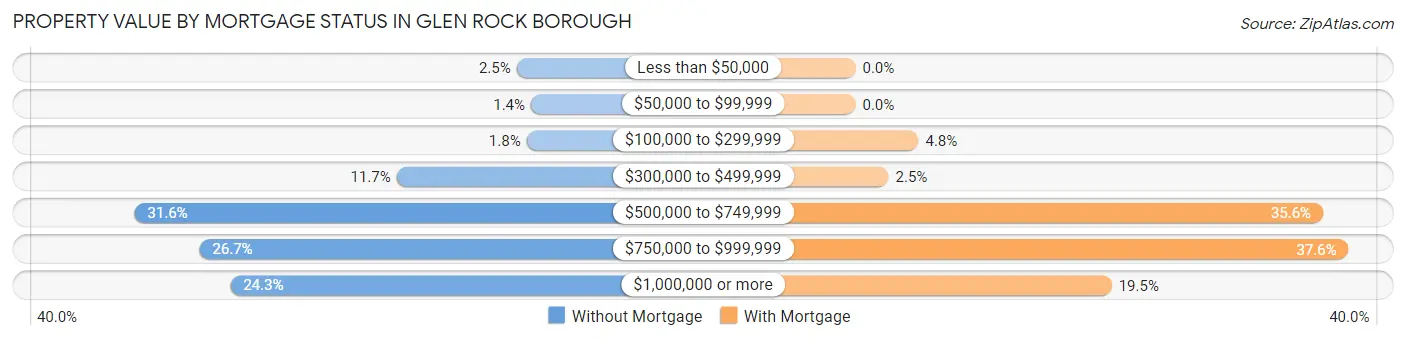
| Property Value | Without Mortgage | With Mortgage |
| Less than $50,000 | 30 (2.5%) | 0 (0.0%) |
| $50,000 to $99,999 | 17 (1.4%) | 0 (0.0%) |
| $100,000 to $299,999 | 21 (1.8%) | 101 (4.8%) |
| $300,000 to $499,999 | 139 (11.7%) | 53 (2.5%) |
| $500,000 to $749,999 | 377 (31.6%) | 750 (35.6%) |
| $750,000 to $999,999 | 318 (26.7%) | 791 (37.6%) |
| $1,000,000 or more | 290 (24.3%) | 411 (19.5%) |
| Total | 1,192 (100.0%) | 2,106 (100.0%) |
Household Income by Mortgage Status in Glen Rock borough
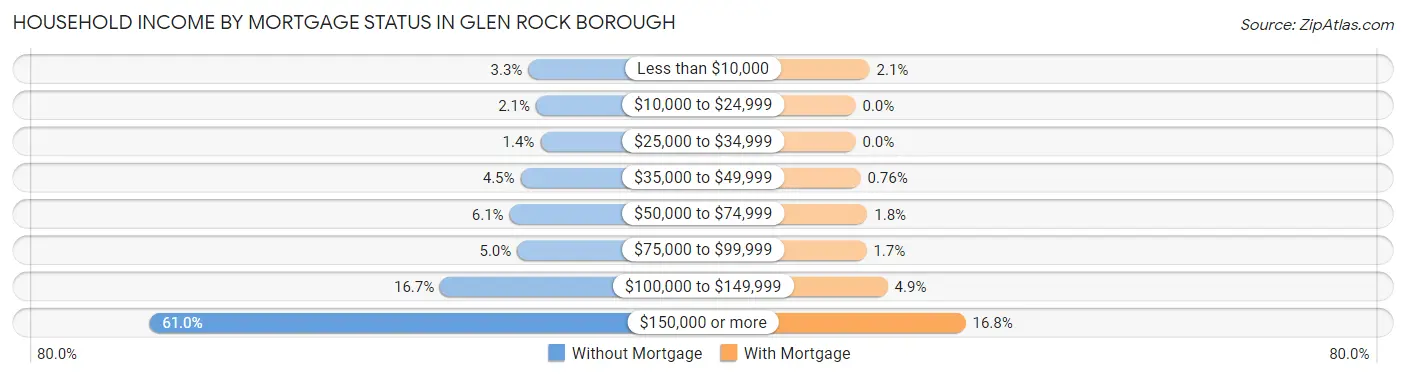
| Household Income | Without Mortgage | With Mortgage |
| Less than $10,000 | 39 (3.3%) | 45 (2.1%) |
| $10,000 to $24,999 | 25 (2.1%) | 0 (0.0%) |
| $25,000 to $34,999 | 17 (1.4%) | 0 (0.0%) |
| $35,000 to $49,999 | 53 (4.4%) | 16 (0.8%) |
| $50,000 to $74,999 | 73 (6.1%) | 38 (1.8%) |
| $75,000 to $99,999 | 59 (5.0%) | 35 (1.7%) |
| $100,000 to $149,999 | 199 (16.7%) | 103 (4.9%) |
| $150,000 or more | 727 (61.0%) | 353 (16.8%) |
| Total | 1,192 (100.0%) | 2,106 (100.0%) |
Property Value to Household Income Ratio in Glen Rock borough
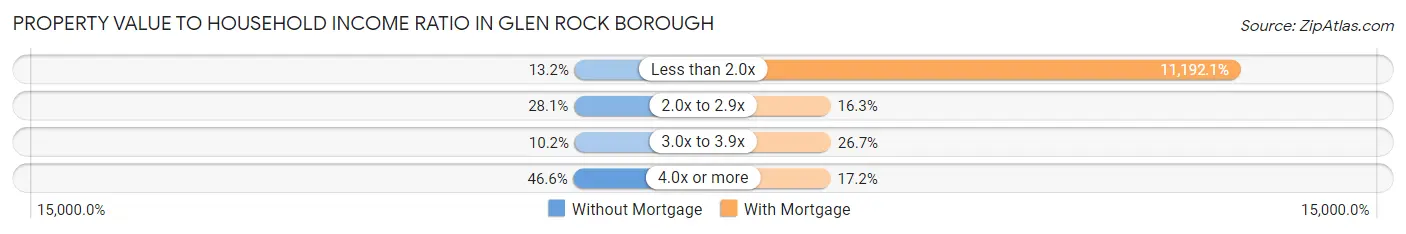
| Value-to-Income Ratio | Without Mortgage | With Mortgage |
| Less than 2.0x | 157 (13.2%) | 235,705 (11,192.1%) |
| 2.0x to 2.9x | 335 (28.1%) | 344 (16.3%) |
| 3.0x to 3.9x | 121 (10.2%) | 563 (26.7%) |
| 4.0x or more | 556 (46.6%) | 363 (17.2%) |
| Total | 1,192 (100.0%) | 2,106 (100.0%) |
Real Estate Taxes by Mortgage Status in Glen Rock borough
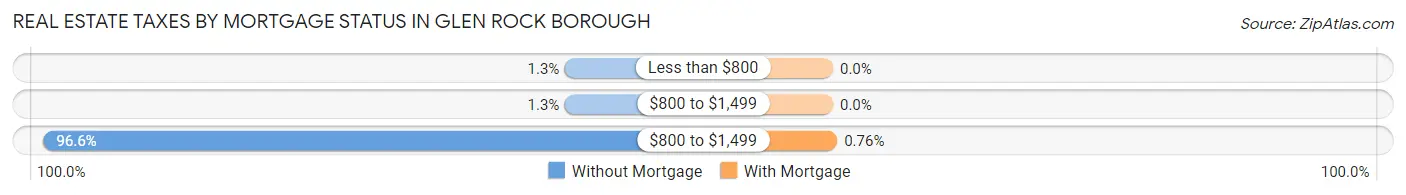
| Property Taxes | Without Mortgage | With Mortgage |
| Less than $800 | 15 (1.3%) | 0 (0.0%) |
| $800 to $1,499 | 15 (1.3%) | 0 (0.0%) |
| $800 to $1,499 | 1,151 (96.6%) | 16 (0.8%) |
| Total | 1,192 (100.0%) | 2,106 (100.0%) |
Health & Disability in Glen Rock borough
Health Insurance Coverage by Age in Glen Rock borough
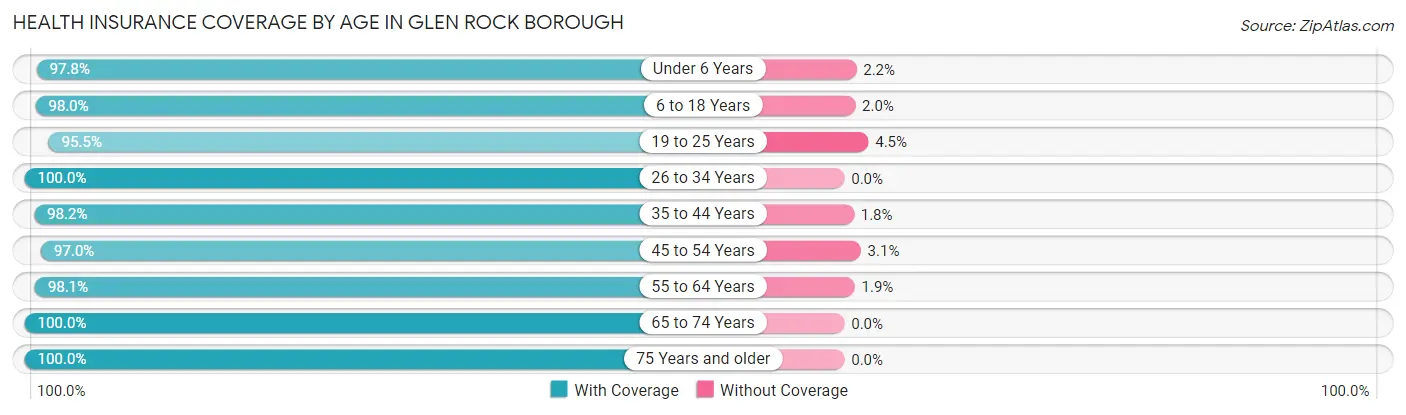
| Age Bracket | With Coverage | Without Coverage |
| Under 6 Years | 1,053 (97.8%) | 24 (2.2%) |
| 6 to 18 Years | 3,064 (98.0%) | 63 (2.0%) |
| 19 to 25 Years | 791 (95.5%) | 37 (4.5%) |
| 26 to 34 Years | 389 (100.0%) | 0 (0.0%) |
| 35 to 44 Years | 1,614 (98.2%) | 29 (1.8%) |
| 45 to 54 Years | 2,158 (97.0%) | 68 (3.0%) |
| 55 to 64 Years | 1,224 (98.1%) | 24 (1.9%) |
| 65 to 74 Years | 691 (100.0%) | 0 (0.0%) |
| 75 Years and older | 789 (100.0%) | 0 (0.0%) |
| Total | 11,773 (98.0%) | 245 (2.0%) |
Health Insurance Coverage by Citizenship Status in Glen Rock borough
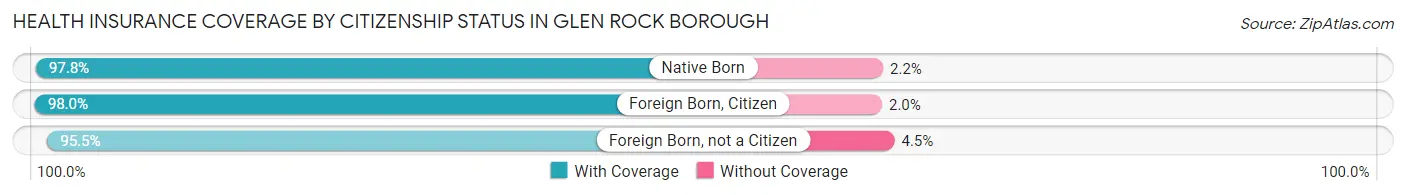
| Citizenship Status | With Coverage | Without Coverage |
| Native Born | 1,053 (97.8%) | 24 (2.2%) |
| Foreign Born, Citizen | 3,064 (98.0%) | 63 (2.0%) |
| Foreign Born, not a Citizen | 791 (95.5%) | 37 (4.5%) |
Health Insurance Coverage by Household Income in Glen Rock borough
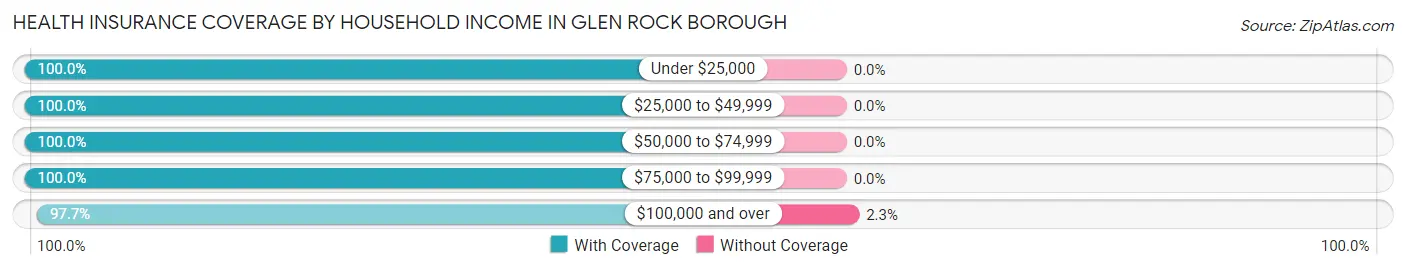
| Household Income | With Coverage | Without Coverage |
| Under $25,000 | 199 (100.0%) | 0 (0.0%) |
| $25,000 to $49,999 | 370 (100.0%) | 0 (0.0%) |
| $50,000 to $74,999 | 369 (100.0%) | 0 (0.0%) |
| $75,000 to $99,999 | 514 (100.0%) | 0 (0.0%) |
| $100,000 and over | 10,300 (97.7%) | 245 (2.3%) |
Public vs Private Health Insurance Coverage by Age in Glen Rock borough
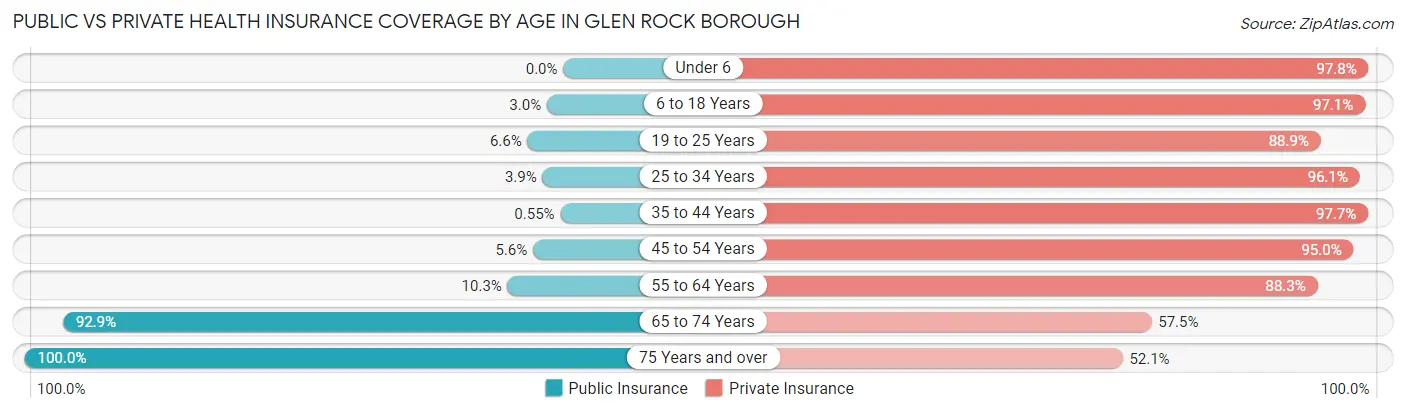
| Age Bracket | Public Insurance | Private Insurance |
| Under 6 | 0 (0.0%) | 1,053 (97.8%) |
| 6 to 18 Years | 95 (3.0%) | 3,037 (97.1%) |
| 19 to 25 Years | 55 (6.6%) | 736 (88.9%) |
| 25 to 34 Years | 15 (3.9%) | 374 (96.1%) |
| 35 to 44 Years | 9 (0.5%) | 1,605 (97.7%) |
| 45 to 54 Years | 125 (5.6%) | 2,114 (95.0%) |
| 55 to 64 Years | 129 (10.3%) | 1,102 (88.3%) |
| 65 to 74 Years | 642 (92.9%) | 397 (57.5%) |
| 75 Years and over | 789 (100.0%) | 411 (52.1%) |
| Total | 1,859 (15.5%) | 10,829 (90.1%) |
Disability Status by Sex by Age in Glen Rock borough
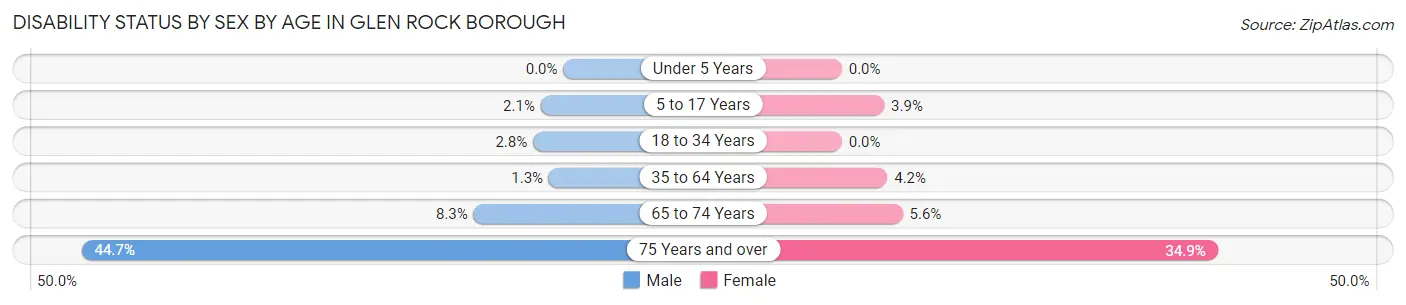
| Age Bracket | Male | Female |
| Under 5 Years | 0 (0.0%) | 0 (0.0%) |
| 5 to 17 Years | 36 (2.1%) | 55 (3.9%) |
| 18 to 34 Years | 18 (2.8%) | 0 (0.0%) |
| 35 to 64 Years | 32 (1.3%) | 115 (4.2%) |
| 65 to 74 Years | 31 (8.3%) | 18 (5.6%) |
| 75 Years and over | 131 (44.7%) | 173 (34.9%) |
Disability Class by Sex by Age in Glen Rock borough
Disability Class: Hearing Difficulty
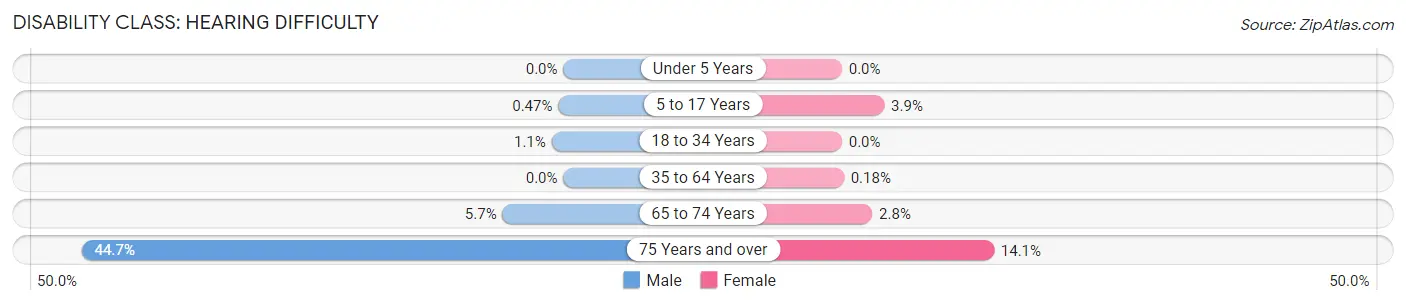
| Age Bracket | Male | Female |
| Under 5 Years | 0 (0.0%) | 0 (0.0%) |
| 5 to 17 Years | 8 (0.5%) | 55 (3.9%) |
| 18 to 34 Years | 7 (1.1%) | 0 (0.0%) |
| 35 to 64 Years | 0 (0.0%) | 5 (0.2%) |
| 65 to 74 Years | 21 (5.7%) | 9 (2.8%) |
| 75 Years and over | 131 (44.7%) | 70 (14.1%) |
Disability Class: Vision Difficulty
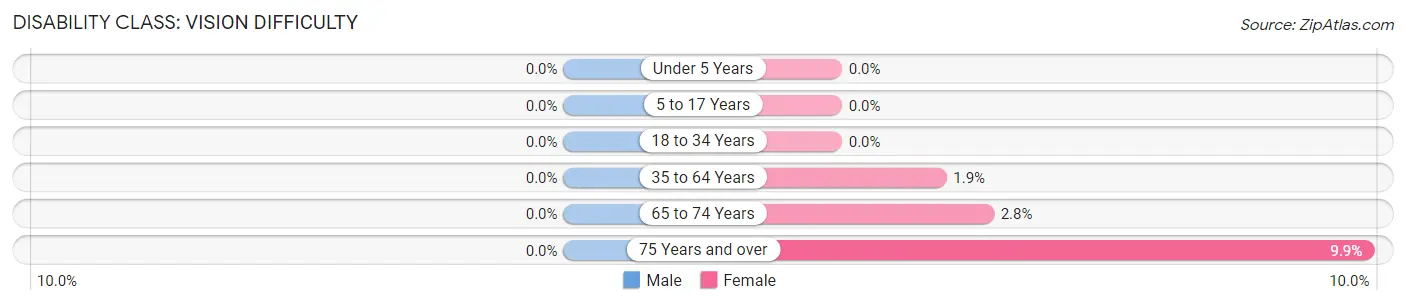
| Age Bracket | Male | Female |
| Under 5 Years | 0 (0.0%) | 0 (0.0%) |
| 5 to 17 Years | 0 (0.0%) | 0 (0.0%) |
| 18 to 34 Years | 0 (0.0%) | 0 (0.0%) |
| 35 to 64 Years | 0 (0.0%) | 53 (1.9%) |
| 65 to 74 Years | 0 (0.0%) | 9 (2.8%) |
| 75 Years and over | 0 (0.0%) | 49 (9.9%) |
Disability Class: Cognitive Difficulty
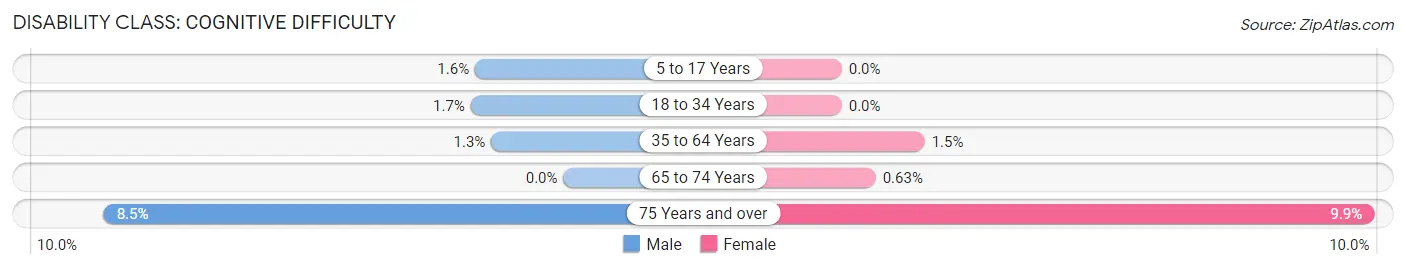
| Age Bracket | Male | Female |
| 5 to 17 Years | 28 (1.6%) | 0 (0.0%) |
| 18 to 34 Years | 11 (1.7%) | 0 (0.0%) |
| 35 to 64 Years | 32 (1.3%) | 42 (1.5%) |
| 65 to 74 Years | 0 (0.0%) | 2 (0.6%) |
| 75 Years and over | 25 (8.5%) | 49 (9.9%) |
Disability Class: Ambulatory Difficulty
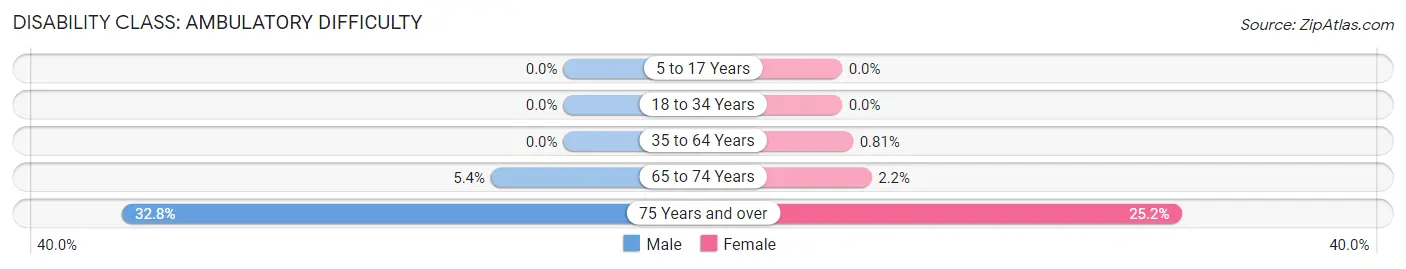
| Age Bracket | Male | Female |
| 5 to 17 Years | 0 (0.0%) | 0 (0.0%) |
| 18 to 34 Years | 0 (0.0%) | 0 (0.0%) |
| 35 to 64 Years | 0 (0.0%) | 22 (0.8%) |
| 65 to 74 Years | 20 (5.4%) | 7 (2.2%) |
| 75 Years and over | 96 (32.8%) | 125 (25.2%) |
Disability Class: Self-Care Difficulty
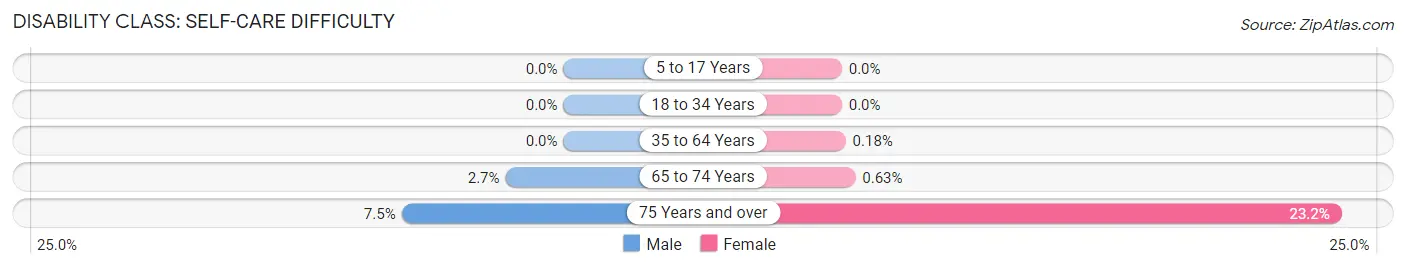
| Age Bracket | Male | Female |
| 5 to 17 Years | 0 (0.0%) | 0 (0.0%) |
| 18 to 34 Years | 0 (0.0%) | 0 (0.0%) |
| 35 to 64 Years | 0 (0.0%) | 5 (0.2%) |
| 65 to 74 Years | 10 (2.7%) | 2 (0.6%) |
| 75 Years and over | 22 (7.5%) | 115 (23.2%) |
Technology Access in Glen Rock borough
Computing Device Access in Glen Rock borough
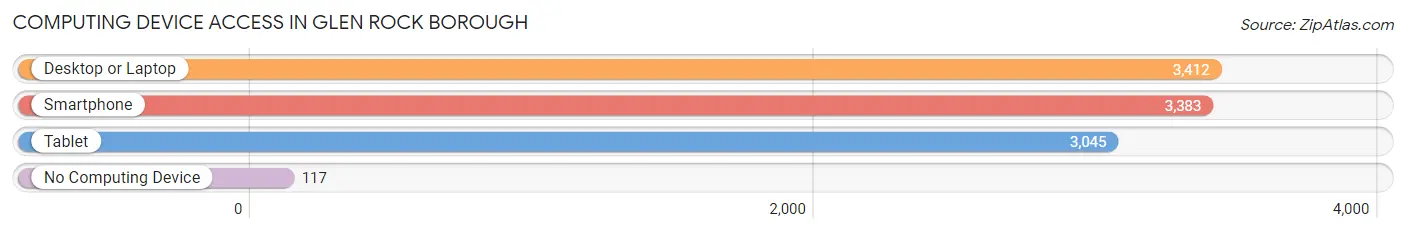
| Device Type | # Households | % Households |
| Desktop or Laptop | 3,412 | 93.4% |
| Smartphone | 3,383 | 92.6% |
| Tablet | 3,045 | 83.4% |
| No Computing Device | 117 | 3.2% |
| Total | 3,652 | 100.0% |
Internet Access in Glen Rock borough
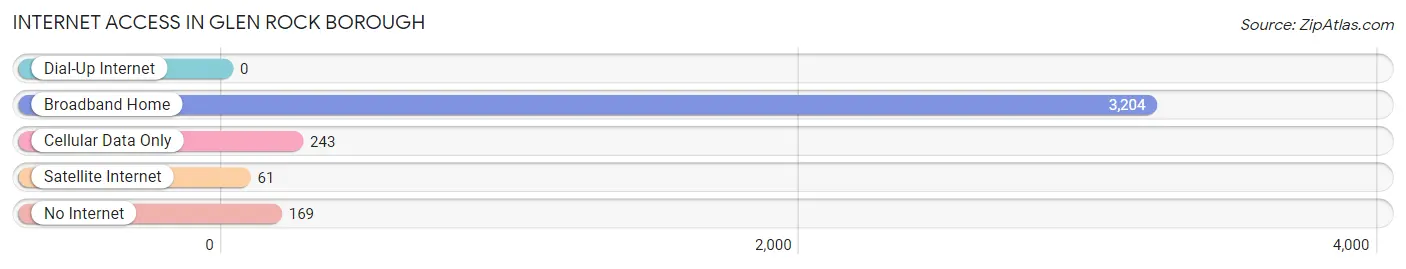
| Internet Type | # Households | % Households |
| Dial-Up Internet | 0 | 0.0% |
| Broadband Home | 3,204 | 87.7% |
| Cellular Data Only | 243 | 6.7% |
| Satellite Internet | 61 | 1.7% |
| No Internet | 169 | 4.6% |
| Total | 3,652 | 100.0% |
Glen Rock borough Summary
Glen Rock is a borough located in Bergen County, New Jersey, United States. As of the 2010 United States Census, the borough's population was 11,601, reflecting an increase of 755 (+7.0%) from the 10,846 counted in the 2000 Census, which had in turn increased by 1,084 (+11.1%) from the 9,762 counted in the 1990 Census.
History
Glen Rock was formed as a borough by an act of the New Jersey Legislature on April 5, 1894, from portions of Ridgewood Township. The borough was named for a large boulder at the intersection of Harristown Road and Rock Road, which was said to resemble a glen or valley.
Geography
Glen Rock is located at 40 58 45 North 74 7 45 West 40 979167 74 129167
According to the United States Census Bureau, the borough had a total area of 2.845 square miles (7.368 km2), including 2.841 square miles (7.358 km2) of land and 0.004 square miles (0.010 km2) of water (0.14%).
The borough is bordered by the boroughs of Fair Lawn and Hawthorne to the north, Ridgewood to the east, Fair Lawn to the south, and Midland Park to the west.
Demographics
As of the 2010 United States Census, there were 11,601 people, 4,072 households, and 3,093.8 families residing in the borough. The population density was 4,093.3 per square mile (1,579.2/km2). There were 4,195 housing units at an average density of 1,478.3 per square mile (571.2/km2). The racial makeup of the borough was 87.90% (10,241) White, 0.90% (105) Black or African American, 0.05% (6) Native American, 8.90% (1,033) Asian, 0.00% (0) Pacific Islander, 0.90% (105) from other races, and 1.35% (157) from two or more races. Hispanic or Latino of any race were 4.45% (519) of the population.
Economy
Glen Rock is home to a variety of businesses, including retail stores, restaurants, professional services, and manufacturing. The borough is also home to several corporate headquarters, including the global headquarters of Toys "R" Us, which is located in the Glen Rock Industrial Park.
The borough's economy is largely driven by its proximity to New York City, which is located approximately 20 miles to the east. Many of the borough's residents commute to the city for work, and the borough is served by several major highways, including the Garden State Parkway, Interstate 80, and Route 17.
The borough also has a vibrant downtown area, which is home to a variety of shops, restaurants, and other businesses. The downtown area is also home to the Glen Rock Historical Society, which is dedicated to preserving the borough's history.
Conclusion
Glen Rock is a borough located in Bergen County, New Jersey, United States. As of the 2010 United States Census, the borough's population was 11,601, reflecting an increase of 755 (+7.0%) from the 10,846 counted in the 2000 Census. The borough is bordered by the boroughs of Fair Lawn and Hawthorne to the north, Ridgewood to the east, Fair Lawn to the south, and Midland Park to the west. The borough's economy is largely driven by its proximity to New York City, which is located approximately 20 miles to the east. The borough is home to a variety of businesses, including retail stores, restaurants, professional services, and manufacturing. The borough also has a vibrant downtown area, which is home to a variety of shops, restaurants, and other businesses.
Common Questions
What is the Total Population of Glen Rock borough?
Total Population of Glen Rock borough is 12,086.
What is the Total Male Population of Glen Rock borough?
Total Male Population of Glen Rock borough is 6,031.
What is the Total Female Population of Glen Rock borough?
Total Female Population of Glen Rock borough is 6,055.
What is the Ratio of Males per 100 Females in Glen Rock borough?
There are 99.60 Males per 100 Females in Glen Rock borough.
What is the Ratio of Females per 100 Males in Glen Rock borough?
There are 100.40 Females per 100 Males in Glen Rock borough.
What is the Median Population Age in Glen Rock borough?
Median Population Age in Glen Rock borough is 39.3 Years.
What is the Average Family Size in Glen Rock borough
Average Family Size in Glen Rock borough is 3.5 People.
What is the Average Household Size in Glen Rock borough
Average Household Size in Glen Rock borough is 3.3 People.
What is Per Capita Income in Glen Rock borough?
Per Capita income in Glen Rock borough is $74,312.
What is the Median Family Income in Glen Rock borough?
Median Family Income in Glen Rock borough is $209,255.
What is the Median Household income in Glen Rock borough?
Median Household Income in Glen Rock borough is $202,586.
What is Income or Wage Gap in Glen Rock borough?
Income or Wage Gap in Glen Rock borough is 40.0%.
Women in Glen Rock borough earn 60.0 cents for every dollar earned by a man.
What is Inequality or Gini Index in Glen Rock borough?
Inequality or Gini Index in Glen Rock borough is 0.40.
How Large is the Labor Force in Glen Rock borough?
There are 5,945 People in the Labor Forcein in Glen Rock borough.
What is the Percentage of People in the Labor Force in Glen Rock borough?
69.6% of People are in the Labor Force in Glen Rock borough.
What is the Unemployment Rate in Glen Rock borough?
Unemployment Rate in Glen Rock borough is 5.7%.