Blackwells Mills, NJ
Blackwells Mills Map
Blackwells Mills Overview
10,047
TOTAL POPULATION
5,004
MALE POPULATION
5,043
FEMALE POPULATION
99.23
MALES / 100 FEMALES
100.78
FEMALES / 100 MALES
41.3
MEDIAN AGE
3.7
AVG FAMILY SIZE
3.5
AVG HOUSEHOLD SIZE
$79,581
PER CAPITA INCOME
$243,854
AVG FAMILY INCOME
$233,516
AVG HOUSEHOLD INCOME
58.7%
WAGE / INCOME GAP [ % ]
41.3¢/ $1
WAGE / INCOME GAP [ $ ]
0.34
INEQUALITY / GINI INDEX
5,412
LABOR FORCE [ PEOPLE ]
69.4%
PERCENT IN LABOR FORCE
5.2%
UNEMPLOYMENT RATE
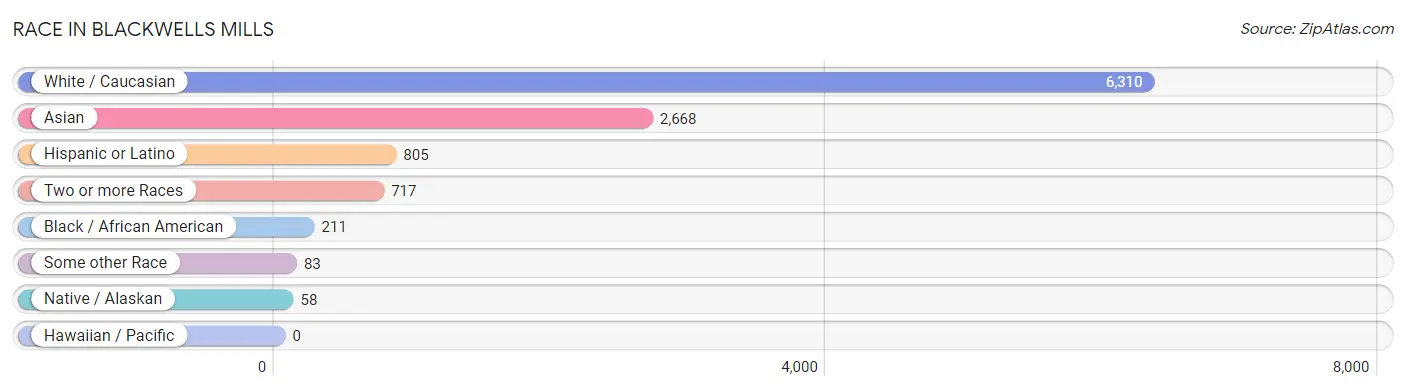
Race in Blackwells Mills
The most populous races in Blackwells Mills are White / Caucasian (6,310 | 62.8%), Asian (2,668 | 26.6%), and Hispanic or Latino (805 | 8.0%).
| Race | # Population | % Population |
| Asian | 2,668 | 26.6% |
| Black / African American | 211 | 2.1% |
| Hawaiian / Pacific | 0 | 0.0% |
| Hispanic or Latino | 805 | 8.0% |
| Native / Alaskan | 58 | 0.6% |
| White / Caucasian | 6,310 | 62.8% |
| Two or more Races | 717 | 7.1% |
| Some other Race | 83 | 0.8% |
| Total | 10,047 | 100.0% |
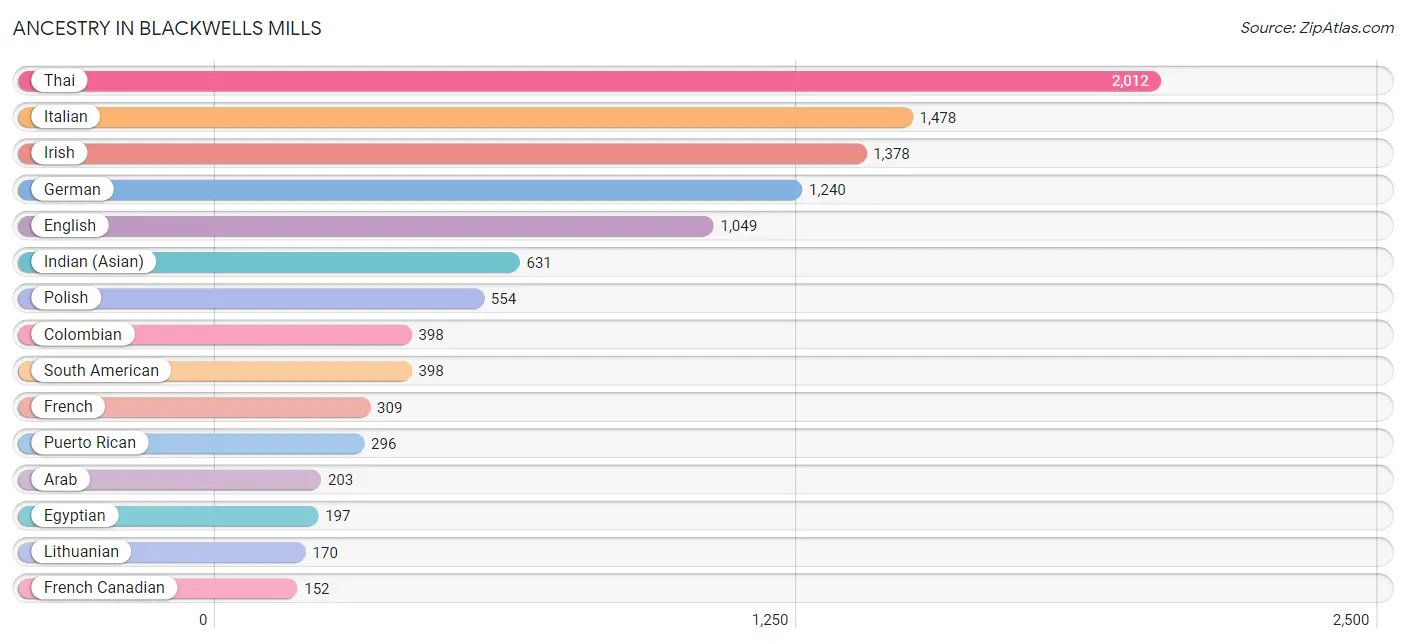
Ancestry in Blackwells Mills
The most populous ancestries reported in Blackwells Mills are Thai (2,012 | 20.0%), Italian (1,478 | 14.7%), Irish (1,378 | 13.7%), German (1,240 | 12.3%), and English (1,049 | 10.4%), together accounting for 71.2% of all Blackwells Mills residents.
| Ancestry | # Population | % Population |
| Albanian | 19 | 0.2% |
| American | 86 | 0.9% |
| Arab | 203 | 2.0% |
| Assyrian / Chaldean / Syriac | 48 | 0.5% |
| Austrian | 17 | 0.2% |
| Bhutanese | 2 | 0.0% |
| Brazilian | 30 | 0.3% |
| British | 6 | 0.1% |
| Burmese | 113 | 1.1% |
| Canadian | 19 | 0.2% |
| Carpatho Rusyn | 26 | 0.3% |
| Central American | 11 | 0.1% |
| Colombian | 398 | 4.0% |
| Croatian | 14 | 0.1% |
| Cuban | 30 | 0.3% |
| Czech | 32 | 0.3% |
| Czechoslovakian | 38 | 0.4% |
| Danish | 87 | 0.9% |
| Dutch | 103 | 1.0% |
| Eastern European | 122 | 1.2% |
| Egyptian | 197 | 2.0% |
| English | 1,049 | 10.4% |
| European | 60 | 0.6% |
| French | 309 | 3.1% |
| French Canadian | 152 | 1.5% |
| German | 1,240 | 12.3% |
| Greek | 107 | 1.1% |
| Hungarian | 147 | 1.5% |
| Indian (Asian) | 631 | 6.3% |
| Iranian | 11 | 0.1% |
| Irish | 1,378 | 13.7% |
| Israeli | 45 | 0.4% |
| Italian | 1,478 | 14.7% |
| Jamaican | 27 | 0.3% |
| Korean | 64 | 0.6% |
| Lebanese | 6 | 0.1% |
| Lithuanian | 170 | 1.7% |
| Lumbee | 58 | 0.6% |
| Mexican | 28 | 0.3% |
| Norwegian | 28 | 0.3% |
| Polish | 554 | 5.5% |
| Portuguese | 73 | 0.7% |
| Puerto Rican | 296 | 2.9% |
| Russian | 46 | 0.5% |
| Salvadoran | 11 | 0.1% |
| Scottish | 52 | 0.5% |
| Slavic | 21 | 0.2% |
| Slovak | 41 | 0.4% |
| South American | 398 | 4.0% |
| Spaniard | 11 | 0.1% |
| Spanish | 31 | 0.3% |
| Sri Lankan | 9 | 0.1% |
| Swedish | 17 | 0.2% |
| Swiss | 106 | 1.1% |
| Thai | 2,012 | 20.0% |
| Turkish | 9 | 0.1% |
| Ukrainian | 13 | 0.1% |
| Welsh | 28 | 0.3% | View All 58 Rows |
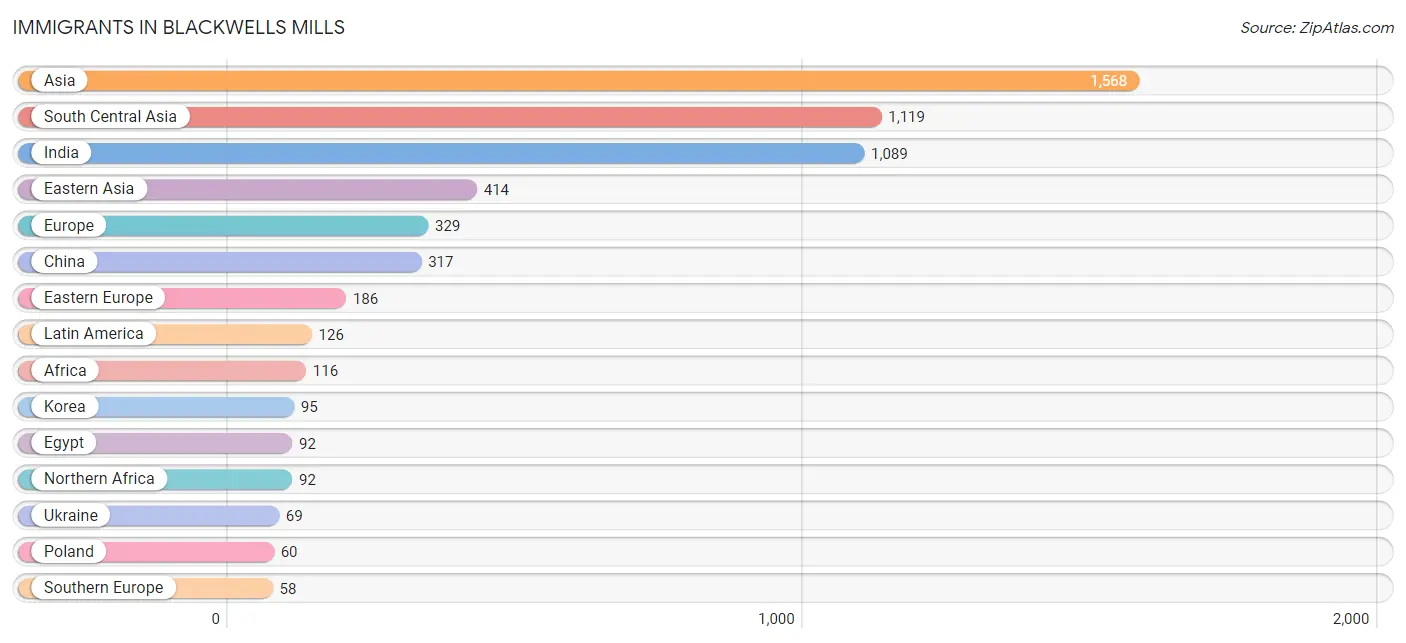
Immigrants in Blackwells Mills
The most numerous immigrant groups reported in Blackwells Mills came from Asia (1,568 | 15.6%), South Central Asia (1,119 | 11.1%), India (1,089 | 10.8%), Eastern Asia (414 | 4.1%), and Europe (329 | 3.3%), together accounting for 45.0% of all Blackwells Mills residents.
| Immigration Origin | # Population | % Population |
| Africa | 116 | 1.1% |
| Asia | 1,568 | 15.6% |
| Bangladesh | 19 | 0.2% |
| Brazil | 15 | 0.2% |
| Canada | 51 | 0.5% |
| Caribbean | 57 | 0.6% |
| Central America | 13 | 0.1% |
| China | 317 | 3.2% |
| Colombia | 41 | 0.4% |
| Cuba | 30 | 0.3% |
| Denmark | 21 | 0.2% |
| Eastern Africa | 24 | 0.2% |
| Eastern Asia | 414 | 4.1% |
| Eastern Europe | 186 | 1.8% |
| Egypt | 92 | 0.9% |
| El Salvador | 11 | 0.1% |
| England | 8 | 0.1% |
| Europe | 329 | 3.3% |
| France | 5 | 0.1% |
| Germany | 31 | 0.3% |
| Hong Kong | 24 | 0.2% |
| Hungary | 22 | 0.2% |
| India | 1,089 | 10.8% |
| Iran | 11 | 0.1% |
| Italy | 12 | 0.1% |
| Jamaica | 27 | 0.3% |
| Japan | 2 | 0.0% |
| Kenya | 7 | 0.1% |
| Korea | 95 | 0.9% |
| Latin America | 126 | 1.3% |
| Lithuania | 35 | 0.4% |
| Mexico | 2 | 0.0% |
| Northern Africa | 92 | 0.9% |
| Northern Europe | 49 | 0.5% |
| Philippines | 27 | 0.3% |
| Poland | 60 | 0.6% |
| Portugal | 29 | 0.3% |
| South America | 56 | 0.6% |
| South Central Asia | 1,119 | 11.1% |
| South Eastern Asia | 27 | 0.3% |
| Southern Europe | 58 | 0.6% |
| Taiwan | 26 | 0.3% |
| Uganda | 17 | 0.2% |
| Ukraine | 69 | 0.7% |
| Western Europe | 36 | 0.4% | View All 45 Rows |
Sex and Age in Blackwells Mills
Sex and Age in Blackwells Mills
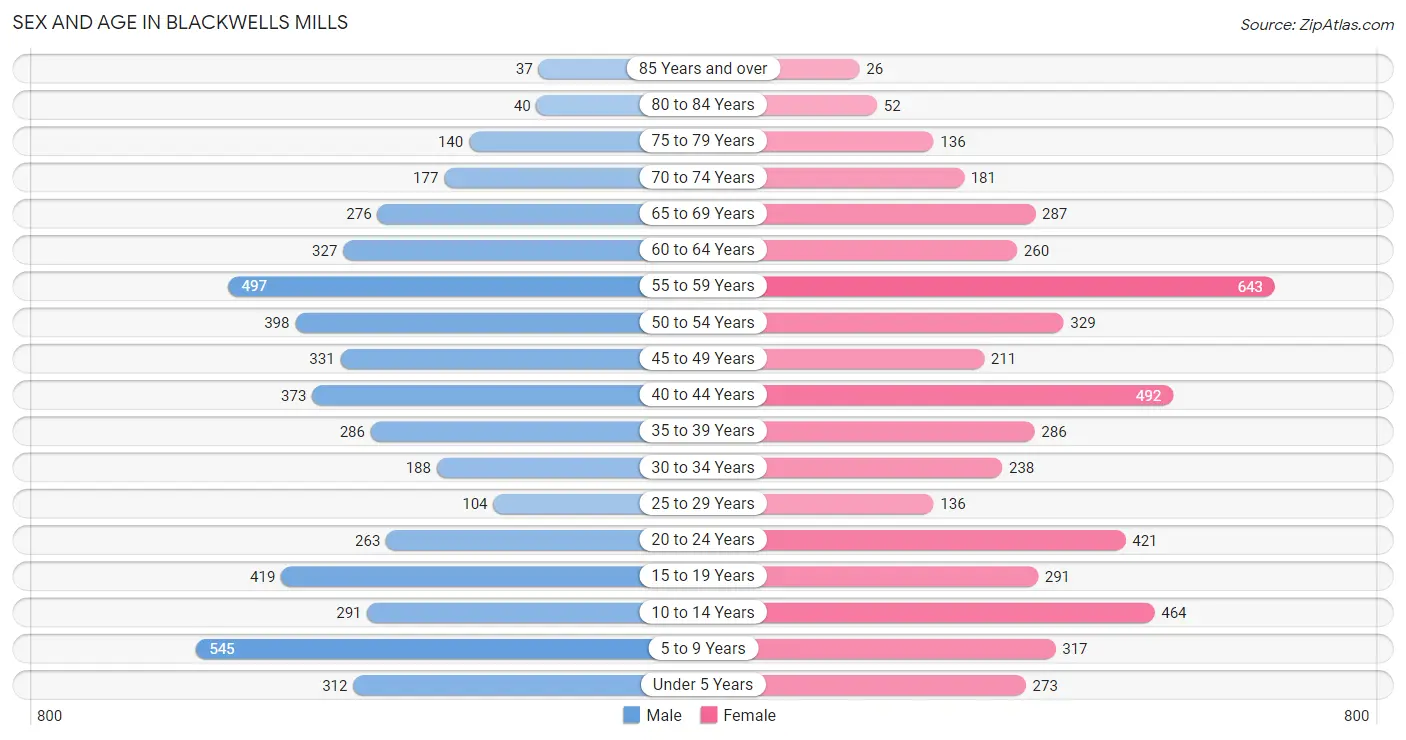
The most populous age groups in Blackwells Mills are 5 to 9 Years (545 | 10.9%) for men and 55 to 59 Years (643 | 12.8%) for women.
| Age Bracket | Male | Female |
| Under 5 Years | 312 (6.2%) | 273 (5.4%) |
| 5 to 9 Years | 545 (10.9%) | 317 (6.3%) |
| 10 to 14 Years | 291 (5.8%) | 464 (9.2%) |
| 15 to 19 Years | 419 (8.4%) | 291 (5.8%) |
| 20 to 24 Years | 263 (5.3%) | 421 (8.4%) |
| 25 to 29 Years | 104 (2.1%) | 136 (2.7%) |
| 30 to 34 Years | 188 (3.8%) | 238 (4.7%) |
| 35 to 39 Years | 286 (5.7%) | 286 (5.7%) |
| 40 to 44 Years | 373 (7.4%) | 492 (9.8%) |
| 45 to 49 Years | 331 (6.6%) | 211 (4.2%) |
| 50 to 54 Years | 398 (8.0%) | 329 (6.5%) |
| 55 to 59 Years | 497 (9.9%) | 643 (12.8%) |
| 60 to 64 Years | 327 (6.5%) | 260 (5.2%) |
| 65 to 69 Years | 276 (5.5%) | 287 (5.7%) |
| 70 to 74 Years | 177 (3.5%) | 181 (3.6%) |
| 75 to 79 Years | 140 (2.8%) | 136 (2.7%) |
| 80 to 84 Years | 40 (0.8%) | 52 (1.0%) |
| 85 Years and over | 37 (0.7%) | 26 (0.5%) |
| Total | 5,004 (100.0%) | 5,043 (100.0%) |
Families and Households in Blackwells Mills
Median Family Size in Blackwells Mills
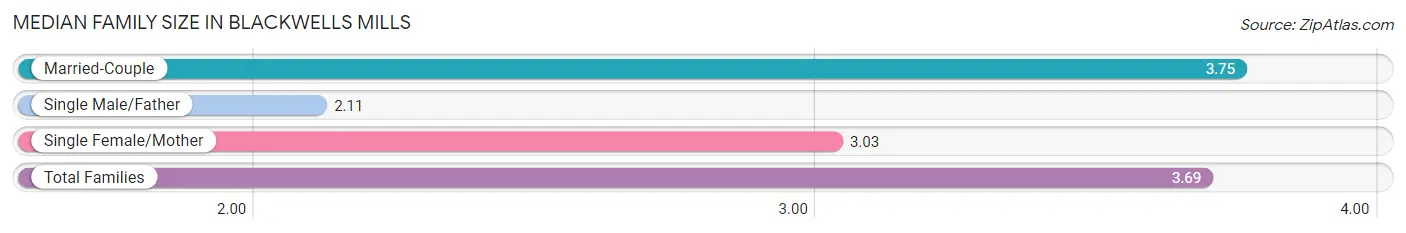
The median family size in Blackwells Mills is 3.69 persons per family, with married-couple families (2,459 | 93.8%) accounting for the largest median family size of 3.75 persons per family. On the other hand, single male/father families (57 | 2.2%) represent the smallest median family size with 2.11 persons per family.
| Family Type | # Families | Family Size |
| Married-Couple | 2,459 (93.8%) | 3.75 |
| Single Male/Father | 57 (2.2%) | 2.11 |
| Single Female/Mother | 105 (4.0%) | 3.03 |
| Total Families | 2,621 (100.0%) | 3.69 |
Median Household Size in Blackwells Mills
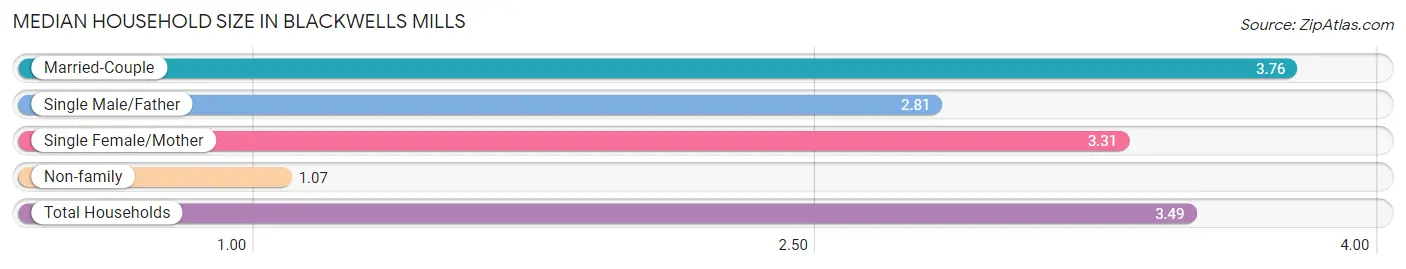
The median household size in Blackwells Mills is 3.49 persons per household, with married-couple households (2,459 | 85.7%) accounting for the largest median household size of 3.76 persons per household. non-family households (250 | 8.7%) represent the smallest median household size with 1.07 persons per household.
| Household Type | # Households | Household Size |
| Married-Couple | 2,459 (85.7%) | 3.76 |
| Single Male/Father | 57 (2.0%) | 2.81 |
| Single Female/Mother | 105 (3.7%) | 3.31 |
| Non-family | 250 (8.7%) | 1.07 |
| Total Households | 2,871 (100.0%) | 3.49 |
Household Size by Marriage Status in Blackwells Mills
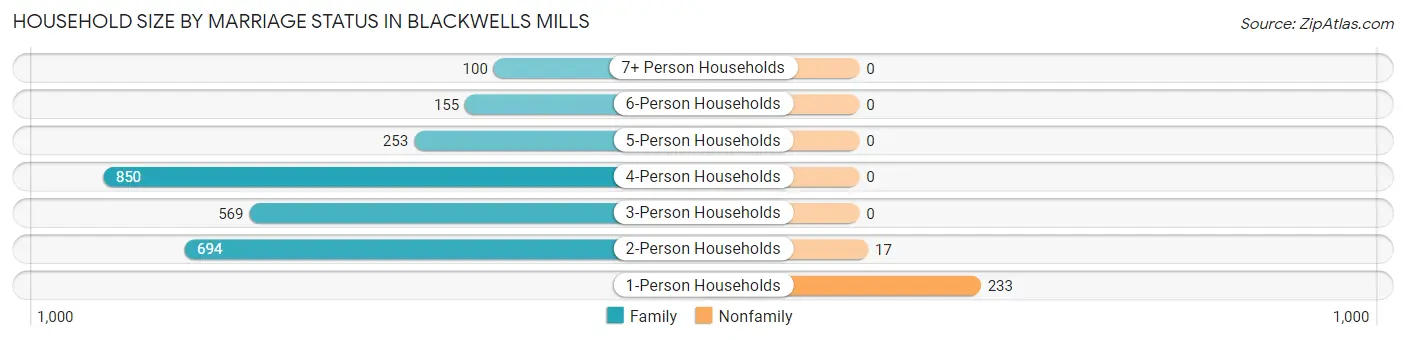
Out of a total of 2,871 households in Blackwells Mills, 2,621 (91.3%) are family households, while 250 (8.7%) are nonfamily households. The most numerous type of family households are 4-person households, comprising 850, and the most common type of nonfamily households are 1-person households, comprising 233.
| Household Size | Family Households | Nonfamily Households |
| 1-Person Households | - | 233 (8.1%) |
| 2-Person Households | 694 (24.2%) | 17 (0.6%) |
| 3-Person Households | 569 (19.8%) | 0 (0.0%) |
| 4-Person Households | 850 (29.6%) | 0 (0.0%) |
| 5-Person Households | 253 (8.8%) | 0 (0.0%) |
| 6-Person Households | 155 (5.4%) | 0 (0.0%) |
| 7+ Person Households | 100 (3.5%) | 0 (0.0%) |
| Total | 2,621 (91.3%) | 250 (8.7%) |
Female Fertility in Blackwells Mills
Fertility by Age in Blackwells Mills
Average fertility rate in Blackwells Mills is 32.0 births per 1,000 women. Women in the age bracket of 20 to 34 years have the highest fertility rate with 84.0 births per 1,000 women. Women in the age bracket of 20 to 34 years acount for 95.7% of all women with births.
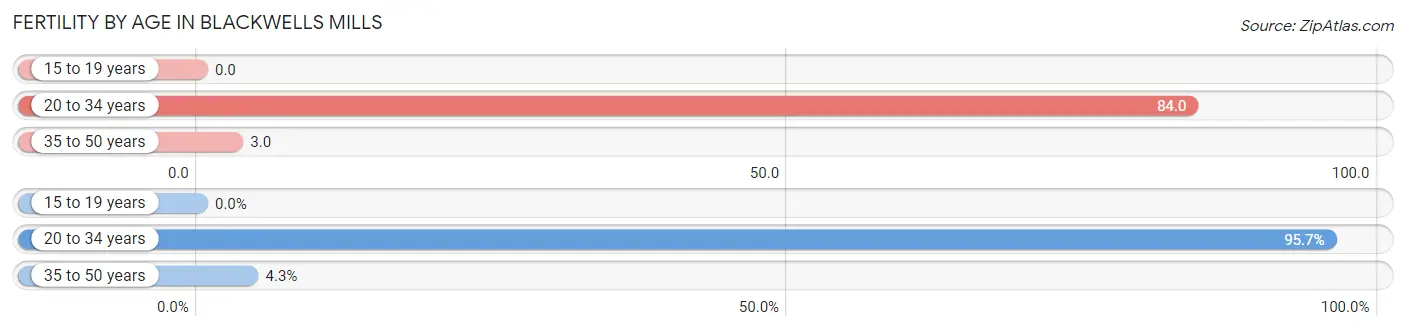
| Age Bracket | Women with Births | Births / 1,000 Women |
| 15 to 19 years | 0 (0.0%) | 0.0 |
| 20 to 34 years | 67 (95.7%) | 84.0 |
| 35 to 50 years | 3 (4.3%) | 3.0 |
| Total | 70 (100.0%) | 32.0 |
Fertility by Age by Marriage Status in Blackwells Mills
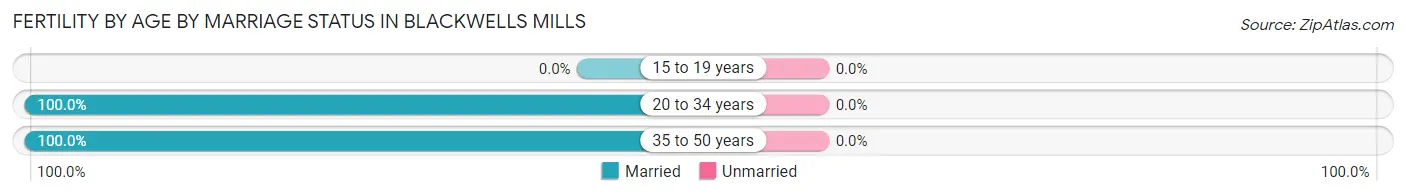
| Age Bracket | Married | Unmarried |
| 15 to 19 years | 0 (0.0%) | 0 (0.0%) |
| 20 to 34 years | 67 (100.0%) | 0 (0.0%) |
| 35 to 50 years | 3 (100.0%) | 0 (0.0%) |
| Total | 70 (100.0%) | 0 (0.0%) |
Fertility by Education in Blackwells Mills
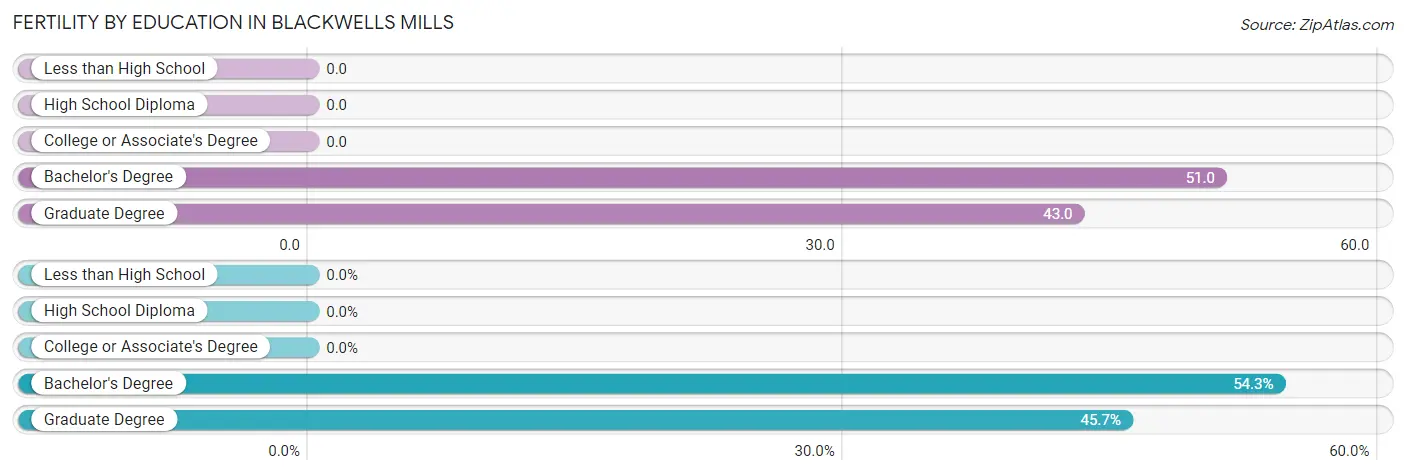
| Educational Attainment | Women with Births | Births / 1,000 Women |
| Less than High School | 0 (0.0%) | 0.0 |
| High School Diploma | 0 (0.0%) | 0.0 |
| College or Associate's Degree | 0 (0.0%) | 0.0 |
| Bachelor's Degree | 38 (54.3%) | 51.0 |
| Graduate Degree | 32 (45.7%) | 43.0 |
| Total | 70 (100.0%) | 32.0 |
Fertility by Education by Marriage Status in Blackwells Mills
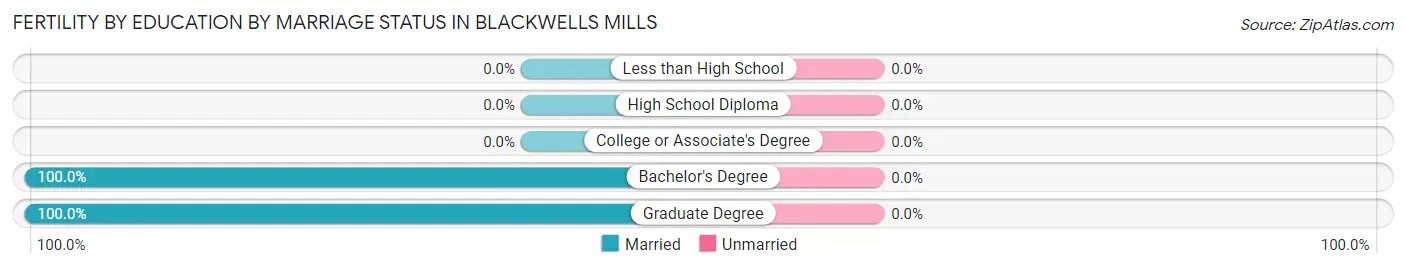
| Educational Attainment | Married | Unmarried |
| Less than High School | 0 (0.0%) | 0 (0.0%) |
| High School Diploma | 0 (0.0%) | 0 (0.0%) |
| College or Associate's Degree | 0 (0.0%) | 0 (0.0%) |
| Bachelor's Degree | 38 (100.0%) | 0 (0.0%) |
| Graduate Degree | 32 (100.0%) | 0 (0.0%) |
| Total | 70 (100.0%) | 0 (0.0%) |
Income in Blackwells Mills
Income Overview in Blackwells Mills
Per Capita Income in Blackwells Mills is $79,581, while median incomes of families and households are $243,854 and $233,516 respectively.
| Characteristic | Number | Measure |
| Per Capita Income | 10,047 | $79,581 |
| Median Family Income | 2,621 | $243,854 |
| Mean Family Income | 2,621 | $289,099 |
| Median Household Income | 2,871 | $233,516 |
| Mean Household Income | 2,871 | $276,624 |
| Income Deficit | 2,621 | $0 |
| Wage / Income Gap (%) | 10,047 | 58.74% |
| Wage / Income Gap ($) | 10,047 | 41.26¢ per $1 |
| Gini / Inequality Index | 10,047 | 0.34 |
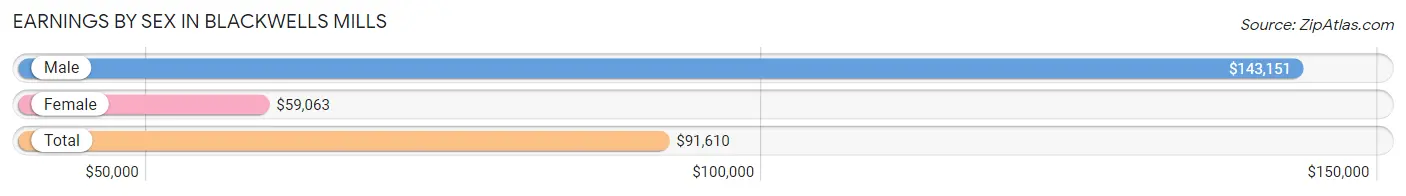
Earnings by Sex in Blackwells Mills
Average Earnings in Blackwells Mills are $91,610, $143,151 for men and $59,063 for women, a difference of 58.7%.
| Sex | Number | Average Earnings |
| Male | 2,854 (51.5%) | $143,151 |
| Female | 2,684 (48.5%) | $59,063 |
| Total | 5,538 (100.0%) | $91,610 |
Earnings by Sex by Income Bracket in Blackwells Mills
The most common earnings brackets in Blackwells Mills are $100,000+ for men (1,763 | 61.8%) and $100,000+ for women (802 | 29.9%).
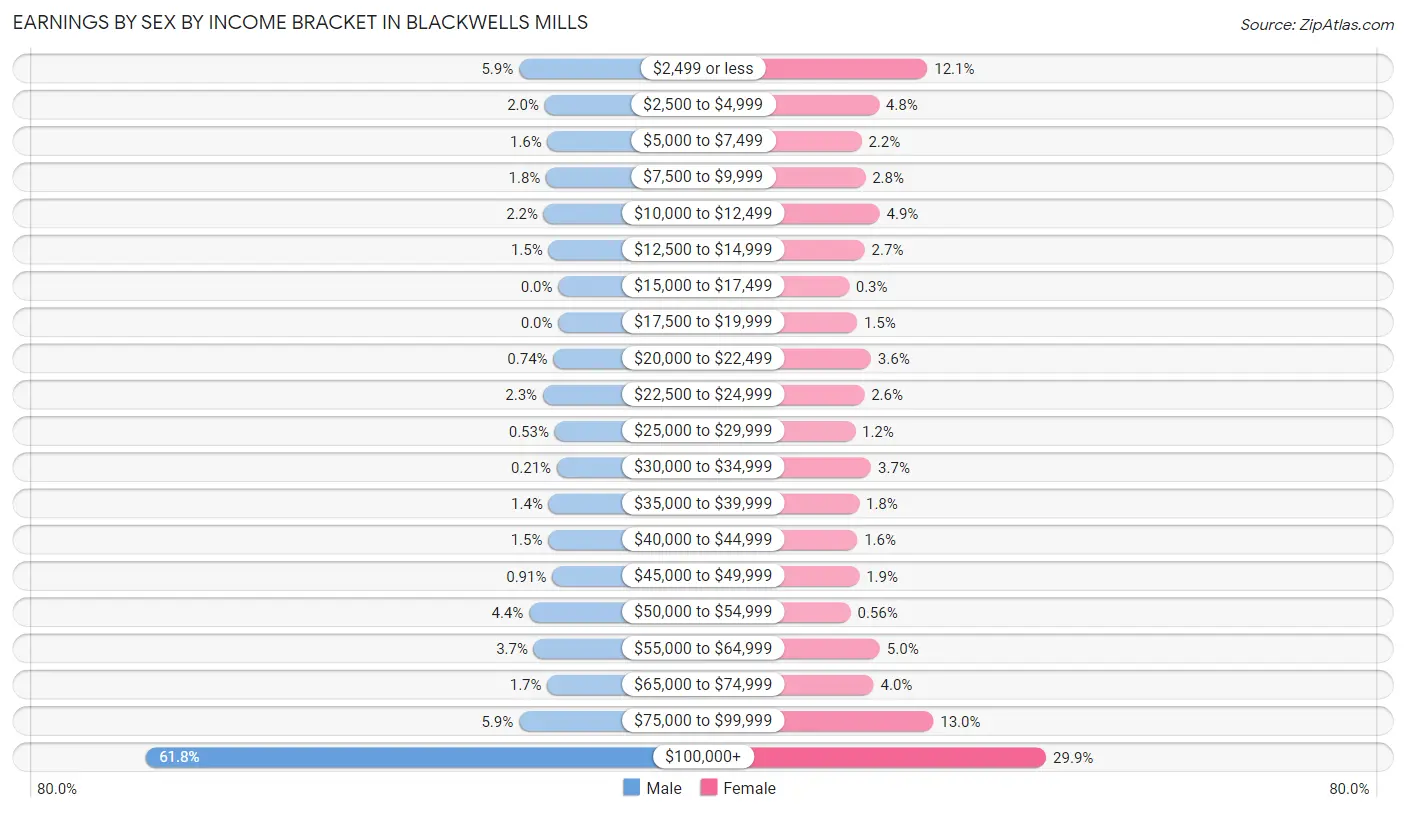
| Income | Male | Female |
| $2,499 or less | 168 (5.9%) | 324 (12.1%) |
| $2,500 to $4,999 | 58 (2.0%) | 129 (4.8%) |
| $5,000 to $7,499 | 46 (1.6%) | 59 (2.2%) |
| $7,500 to $9,999 | 52 (1.8%) | 74 (2.8%) |
| $10,000 to $12,499 | 62 (2.2%) | 132 (4.9%) |
| $12,500 to $14,999 | 42 (1.5%) | 72 (2.7%) |
| $15,000 to $17,499 | 0 (0.0%) | 8 (0.3%) |
| $17,500 to $19,999 | 0 (0.0%) | 41 (1.5%) |
| $20,000 to $22,499 | 21 (0.7%) | 97 (3.6%) |
| $22,500 to $24,999 | 66 (2.3%) | 70 (2.6%) |
| $25,000 to $29,999 | 15 (0.5%) | 33 (1.2%) |
| $30,000 to $34,999 | 6 (0.2%) | 98 (3.6%) |
| $35,000 to $39,999 | 41 (1.4%) | 49 (1.8%) |
| $40,000 to $44,999 | 43 (1.5%) | 42 (1.6%) |
| $45,000 to $49,999 | 26 (0.9%) | 50 (1.9%) |
| $50,000 to $54,999 | 125 (4.4%) | 15 (0.6%) |
| $55,000 to $64,999 | 105 (3.7%) | 133 (5.0%) |
| $65,000 to $74,999 | 47 (1.7%) | 108 (4.0%) |
| $75,000 to $99,999 | 168 (5.9%) | 348 (13.0%) |
| $100,000+ | 1,763 (61.8%) | 802 (29.9%) |
| Total | 2,854 (100.0%) | 2,684 (100.0%) |
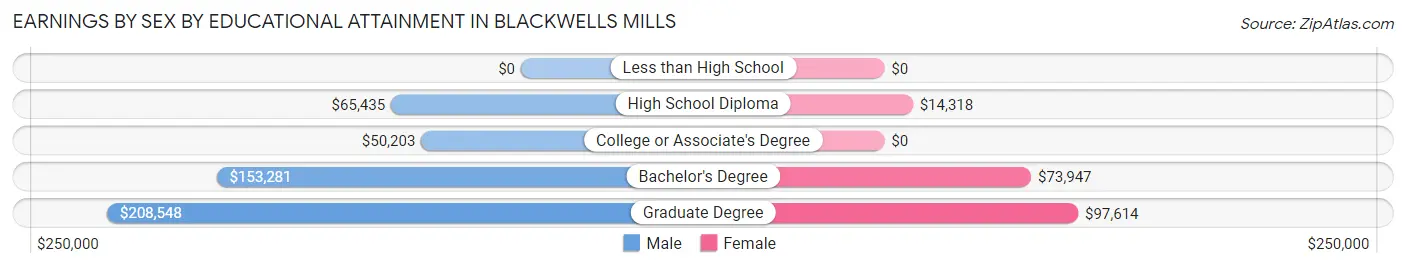
Earnings by Sex by Educational Attainment in Blackwells Mills
Average earnings in Blackwells Mills are $171,563 for men and $77,951 for women, a difference of 54.6%. Men with an educational attainment of graduate degree enjoy the highest average annual earnings of $208,548, while those with college or associate's degree education earn the least with $50,203. Women with an educational attainment of graduate degree earn the most with the average annual earnings of $97,614, while those with high school diploma education have the smallest earnings of $14,318.
| Educational Attainment | Male Income | Female Income |
| Less than High School | - | - |
| High School Diploma | $65,435 | $14,318 |
| College or Associate's Degree | $50,203 | $0 |
| Bachelor's Degree | $153,281 | $73,947 |
| Graduate Degree | $208,548 | $97,614 |
| Total | $171,563 | $77,951 |
Family Income in Blackwells Mills
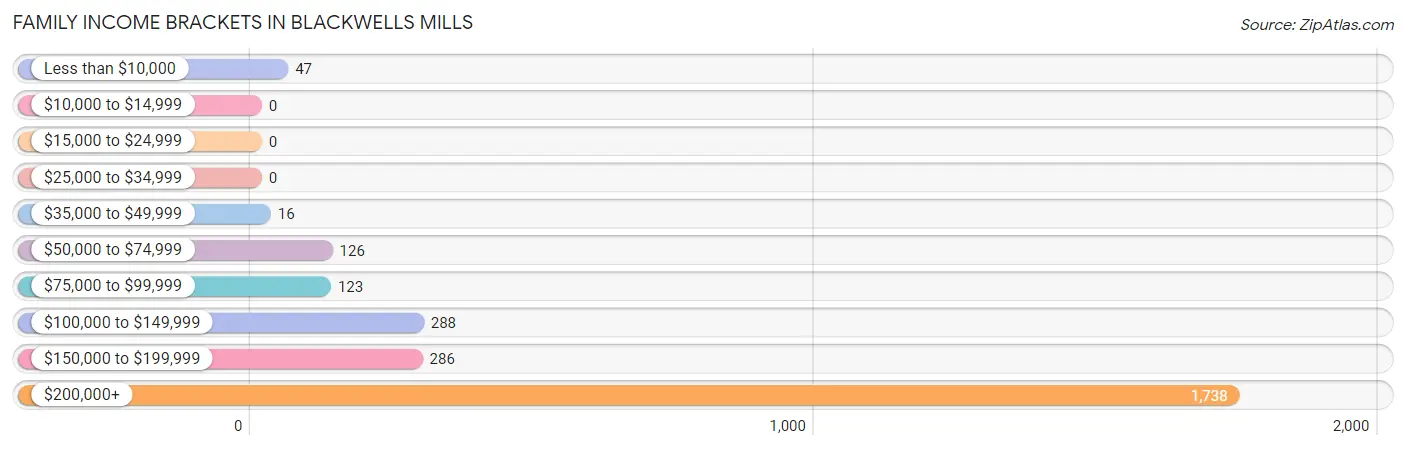
Family Income Brackets in Blackwells Mills
According to the Blackwells Mills family income data, there are 1,738 families falling into the $200,000+ income range, which is the most common income bracket and makes up 66.3% of all families.
| Income Bracket | # Families | % Families |
| Less than $10,000 | 47 | 1.8% |
| $10,000 to $14,999 | 0 | 0.0% |
| $15,000 to $24,999 | 0 | 0.0% |
| $25,000 to $34,999 | 0 | 0.0% |
| $35,000 to $49,999 | 16 | 0.6% |
| $50,000 to $74,999 | 126 | 4.8% |
| $75,000 to $99,999 | 123 | 4.7% |
| $100,000 to $149,999 | 288 | 11.0% |
| $150,000 to $199,999 | 286 | 10.9% |
| $200,000+ | 1,738 | 66.3% |
Family Income by Famaliy Size in Blackwells Mills
4-person families (828 | 31.6%) account for the highest median family income in Blackwells Mills with $250,001 per family, while 2-person families (758 | 28.9%) have the highest median income of $92,237 per family member.
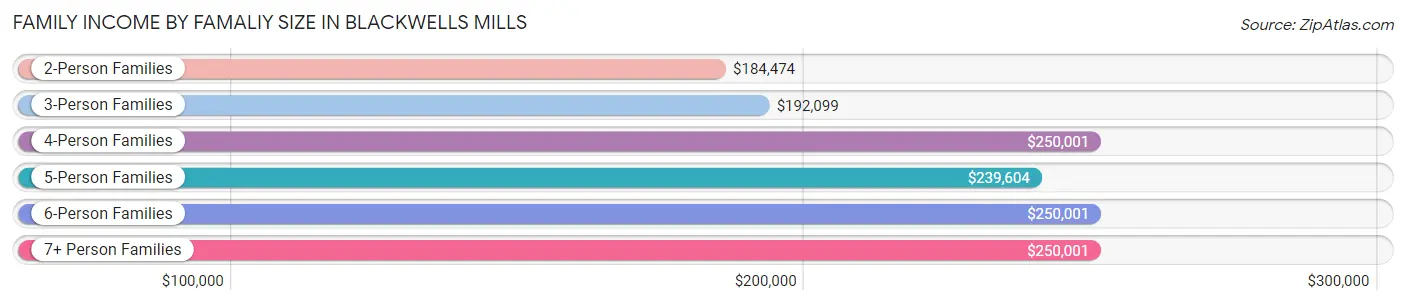
| Income Bracket | # Families | Median Income |
| 2-Person Families | 758 (28.9%) | $184,474 |
| 3-Person Families | 527 (20.1%) | $192,099 |
| 4-Person Families | 828 (31.6%) | $250,001 |
| 5-Person Families | 253 (9.7%) | $239,604 |
| 6-Person Families | 155 (5.9%) | $250,001 |
| 7+ Person Families | 100 (3.8%) | $250,001 |
| Total | 2,621 (100.0%) | $243,854 |
Family Income by Number of Earners in Blackwells Mills
The median family income in Blackwells Mills is $243,854, with families comprising 2 earners (1,403) having the highest median family income of $250,001, while families with no earners (290) have the lowest median family income of $113,269, accounting for 53.5% and 11.1% of families, respectively.
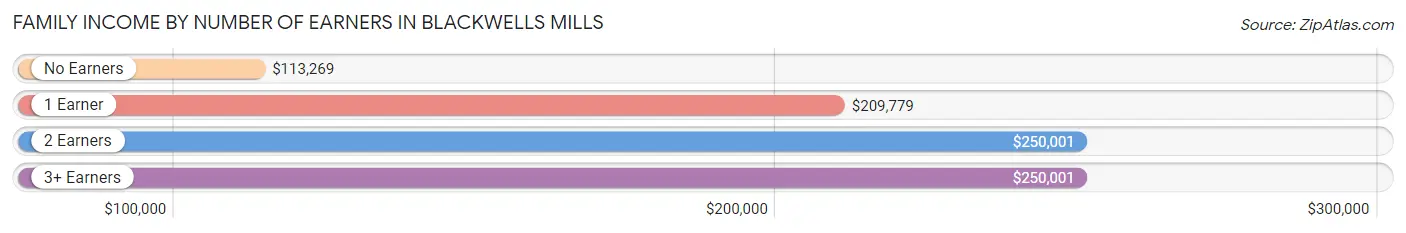
| Number of Earners | # Families | Median Income |
| No Earners | 290 (11.1%) | $113,269 |
| 1 Earner | 403 (15.4%) | $209,779 |
| 2 Earners | 1,403 (53.5%) | $250,001 |
| 3+ Earners | 525 (20.0%) | $250,001 |
| Total | 2,621 (100.0%) | $243,854 |
Household Income in Blackwells Mills
Household Income Brackets in Blackwells Mills
With 1,751 households falling in the category, the $200,000+ income range is the most frequent in Blackwells Mills, accounting for 61.0% of all households.
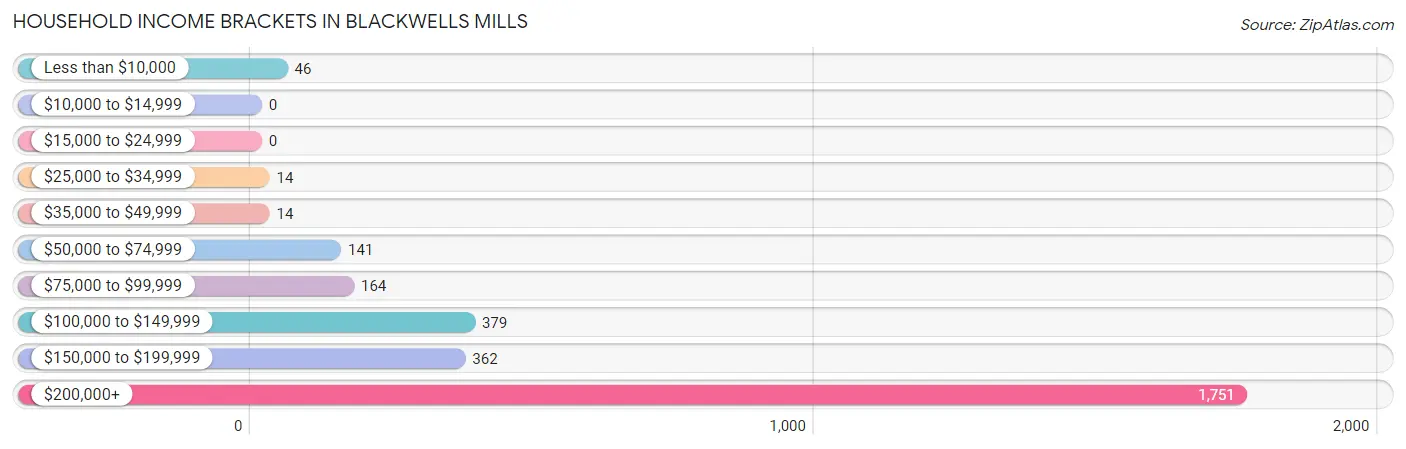
| Income Bracket | # Households | % Households |
| Less than $10,000 | 46 | 1.6% |
| $10,000 to $14,999 | 0 | 0.0% |
| $15,000 to $24,999 | 0 | 0.0% |
| $25,000 to $34,999 | 14 | 0.5% |
| $35,000 to $49,999 | 14 | 0.5% |
| $50,000 to $74,999 | 141 | 4.9% |
| $75,000 to $99,999 | 164 | 5.7% |
| $100,000 to $149,999 | 379 | 13.2% |
| $150,000 to $199,999 | 362 | 12.6% |
| $200,000+ | 1,751 | 61.0% |
Household Income by Householder Age in Blackwells Mills
The median household income in Blackwells Mills is $233,516, with the highest median household income of $250,001 found in the 25 to 44 years age bracket for the primary householder. A total of 792 households (27.6%) fall into this category.
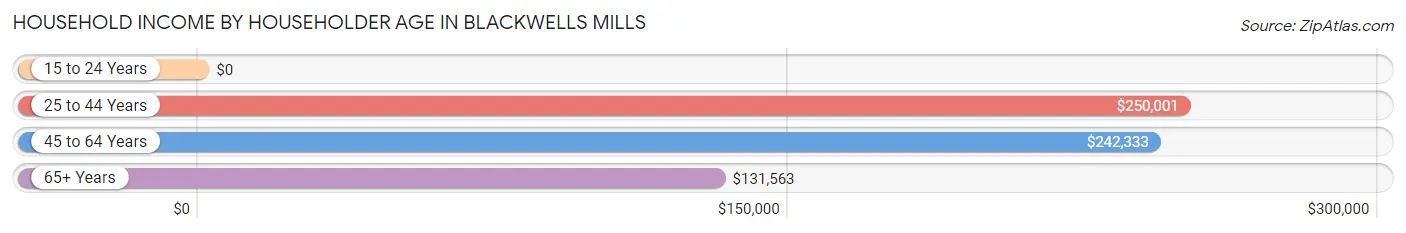
| Income Bracket | # Households | Median Income |
| 15 to 24 Years | 0 (0.0%) | $0 |
| 25 to 44 Years | 792 (27.6%) | $250,001 |
| 45 to 64 Years | 1,512 (52.7%) | $242,333 |
| 65+ Years | 567 (19.8%) | $131,563 |
| Total | 2,871 (100.0%) | $233,516 |
Poverty in Blackwells Mills
Income Below Poverty by Sex and Age in Blackwells Mills
With 0.6% poverty level for males and 2.1% for females among the residents of Blackwells Mills, 25 to 34 year old males and 16 and 17 year old females are the most vulnerable to poverty, with 23 males (7.9%) and 30 females (18.5%) in their respective age groups living below the poverty level.
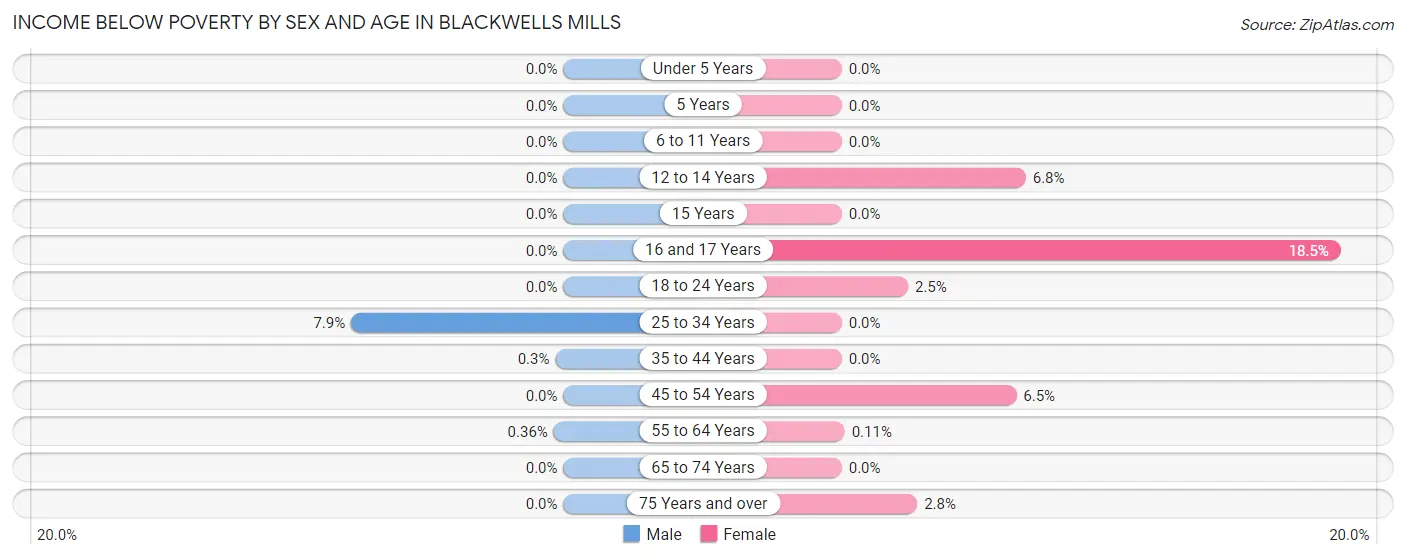
| Age Bracket | Male | Female |
| Under 5 Years | 0 (0.0%) | 0 (0.0%) |
| 5 Years | 0 (0.0%) | 0 (0.0%) |
| 6 to 11 Years | 0 (0.0%) | 0 (0.0%) |
| 12 to 14 Years | 0 (0.0%) | 22 (6.8%) |
| 15 Years | 0 (0.0%) | 0 (0.0%) |
| 16 and 17 Years | 0 (0.0%) | 30 (18.5%) |
| 18 to 24 Years | 0 (0.0%) | 13 (2.5%) |
| 25 to 34 Years | 23 (7.9%) | 0 (0.0%) |
| 35 to 44 Years | 2 (0.3%) | 0 (0.0%) |
| 45 to 54 Years | 0 (0.0%) | 35 (6.5%) |
| 55 to 64 Years | 3 (0.4%) | 1 (0.1%) |
| 65 to 74 Years | 0 (0.0%) | 0 (0.0%) |
| 75 Years and over | 0 (0.0%) | 6 (2.8%) |
| Total | 28 (0.6%) | 107 (2.1%) |
Income Above Poverty by Sex and Age in Blackwells Mills
According to the poverty statistics in Blackwells Mills, males aged under 5 years and females aged under 5 years are the age groups that are most secure financially, with 100.0% of males and 100.0% of females in these age groups living above the poverty line.
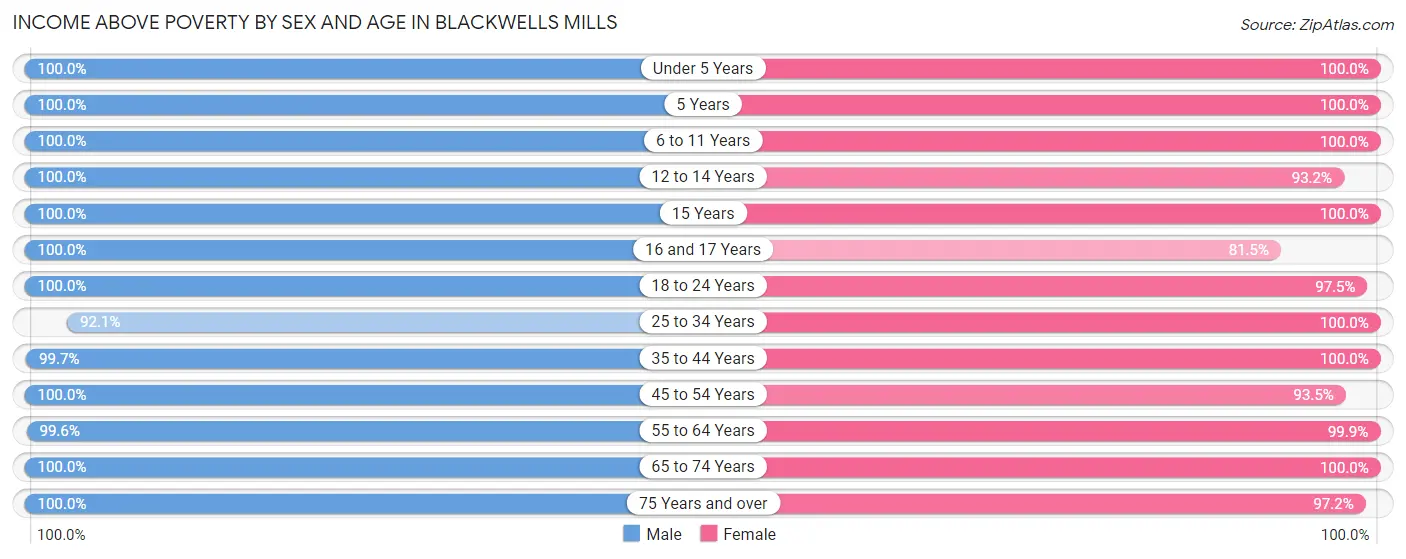
| Age Bracket | Male | Female |
| Under 5 Years | 312 (100.0%) | 273 (100.0%) |
| 5 Years | 56 (100.0%) | 10 (100.0%) |
| 6 to 11 Years | 684 (100.0%) | 449 (100.0%) |
| 12 to 14 Years | 96 (100.0%) | 300 (93.2%) |
| 15 Years | 25 (100.0%) | 22 (100.0%) |
| 16 and 17 Years | 167 (100.0%) | 132 (81.5%) |
| 18 to 24 Years | 490 (100.0%) | 515 (97.5%) |
| 25 to 34 Years | 269 (92.1%) | 374 (100.0%) |
| 35 to 44 Years | 657 (99.7%) | 778 (100.0%) |
| 45 to 54 Years | 729 (100.0%) | 505 (93.5%) |
| 55 to 64 Years | 821 (99.6%) | 902 (99.9%) |
| 65 to 74 Years | 453 (100.0%) | 468 (100.0%) |
| 75 Years and over | 217 (100.0%) | 208 (97.2%) |
| Total | 4,976 (99.4%) | 4,936 (97.9%) |
Income Below Poverty Among Married-Couple Families in Blackwells Mills
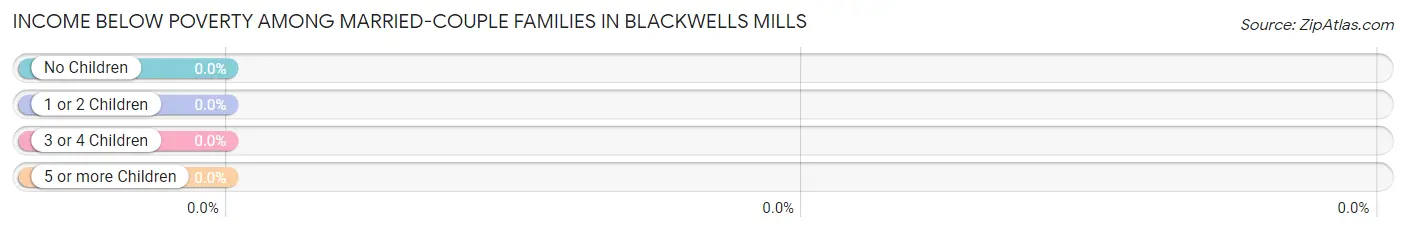
| Children | Above Poverty | Below Poverty |
| No Children | 1,160 (100.0%) | 0 (0.0%) |
| 1 or 2 Children | 1,093 (100.0%) | 0 (0.0%) |
| 3 or 4 Children | 169 (100.0%) | 0 (0.0%) |
| 5 or more Children | 37 (100.0%) | 0 (0.0%) |
| Total | 2,459 (100.0%) | 0 (0.0%) |
Income Below Poverty Among Single-Parent Households in Blackwells Mills
According to the poverty data in Blackwells Mills, 38.6% or 22 single-father households and 23.8% or 25 single-mother households are living below the poverty line. Among single-father households, those with no children have the highest poverty rate, with 22 households (38.6%) experiencing poverty. Likewise, among single-mother households, those with 1 or 2 children have the highest poverty rate, with 25 households (34.7%) falling below the poverty line.
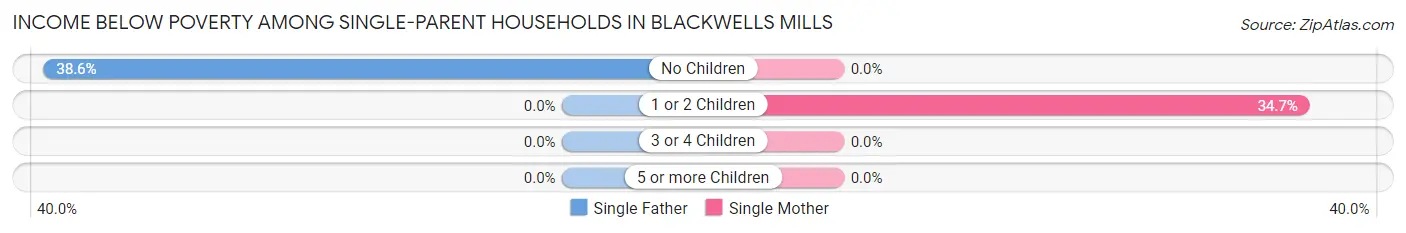
| Children | Single Father | Single Mother |
| No Children | 22 (38.6%) | 0 (0.0%) |
| 1 or 2 Children | 0 (0.0%) | 25 (34.7%) |
| 3 or 4 Children | 0 (0.0%) | 0 (0.0%) |
| 5 or more Children | 0 (0.0%) | 0 (0.0%) |
| Total | 22 (38.6%) | 25 (23.8%) |
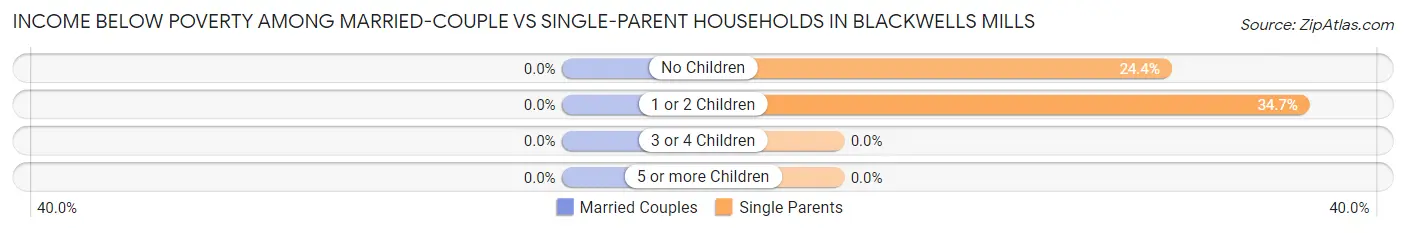
Income Below Poverty Among Married-Couple vs Single-Parent Households in Blackwells Mills
| Children | Married-Couple Families | Single-Parent Households |
| No Children | 0 (0.0%) | 22 (24.4%) |
| 1 or 2 Children | 0 (0.0%) | 25 (34.7%) |
| 3 or 4 Children | 0 (0.0%) | 0 (0.0%) |
| 5 or more Children | 0 (0.0%) | 0 (0.0%) |
| Total | 0 (0.0%) | 47 (29.0%) |
Employment Characteristics in Blackwells Mills
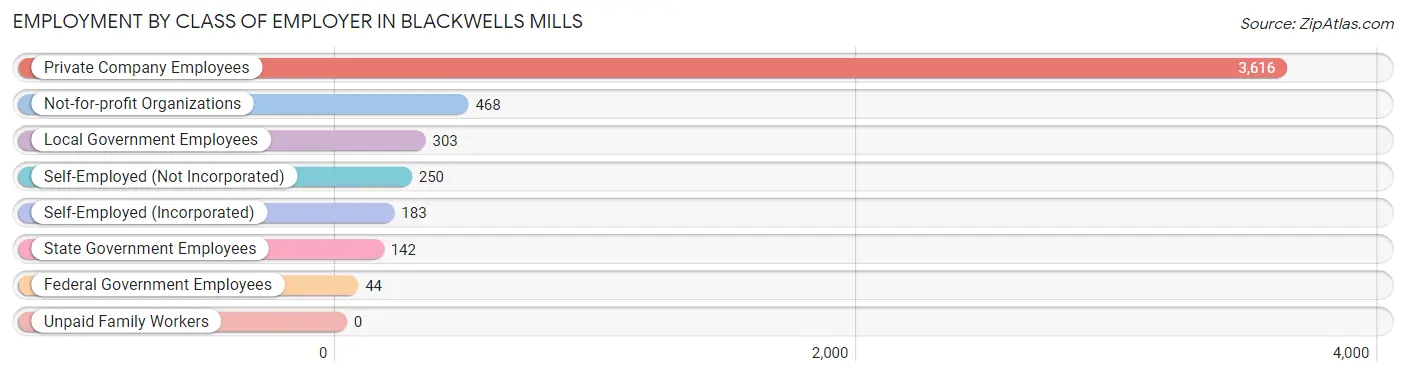
Employment by Class of Employer in Blackwells Mills
Among the 5,006 employed individuals in Blackwells Mills, private company employees (3,616 | 72.2%), not-for-profit organizations (468 | 9.3%), and local government employees (303 | 6.0%) make up the most common classes of employment.
| Employer Class | # Employees | % Employees |
| Private Company Employees | 3,616 | 72.2% |
| Self-Employed (Incorporated) | 183 | 3.7% |
| Self-Employed (Not Incorporated) | 250 | 5.0% |
| Not-for-profit Organizations | 468 | 9.3% |
| Local Government Employees | 303 | 6.0% |
| State Government Employees | 142 | 2.8% |
| Federal Government Employees | 44 | 0.9% |
| Unpaid Family Workers | 0 | 0.0% |
| Total | 5,006 | 100.0% |
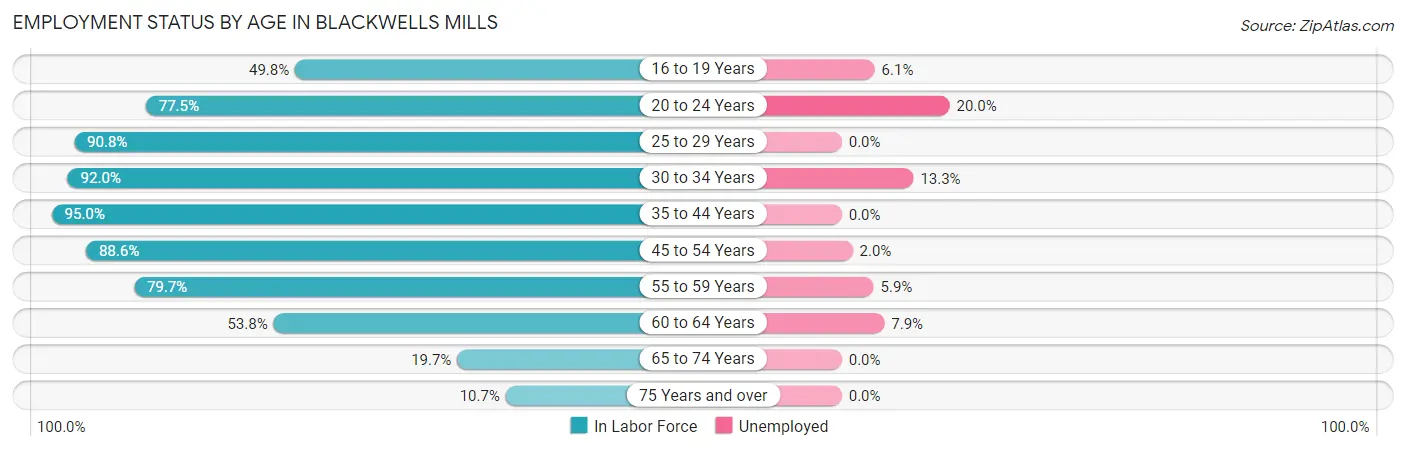
Employment Status by Age in Blackwells Mills
According to the labor force statistics for Blackwells Mills, out of the total population over 16 years of age (7,798), 69.4% or 5,412 individuals are in the labor force, with 5.2% or 281 of them unemployed. The age group with the highest labor force participation rate is 35 to 44 years, with 95.0% or 1,365 individuals in the labor force. Within the labor force, the 20 to 24 years age range has the highest percentage of unemployed individuals, with 20.0% or 106 of them being unemployed.
| Age Bracket | In Labor Force | Unemployed |
| 16 to 19 Years | 330 (49.8%) | 20 (6.1%) |
| 20 to 24 Years | 530 (77.5%) | 106 (20.0%) |
| 25 to 29 Years | 218 (90.8%) | 0 (0.0%) |
| 30 to 34 Years | 392 (92.0%) | 52 (13.3%) |
| 35 to 44 Years | 1,365 (95.0%) | 0 (0.0%) |
| 45 to 54 Years | 1,124 (88.6%) | 22 (2.0%) |
| 55 to 59 Years | 909 (79.7%) | 54 (5.9%) |
| 60 to 64 Years | 316 (53.8%) | 25 (7.9%) |
| 65 to 74 Years | 181 (19.7%) | 0 (0.0%) |
| 75 Years and over | 46 (10.7%) | 0 (0.0%) |
| Total | 5,412 (69.4%) | 281 (5.2%) |
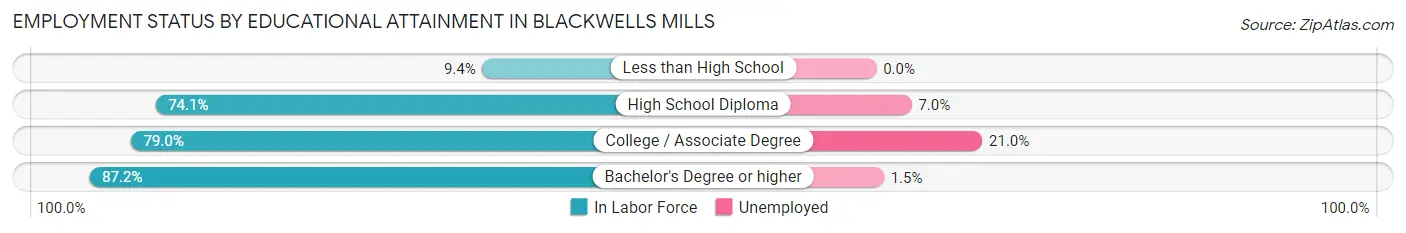
Employment Status by Educational Attainment in Blackwells Mills
According to labor force statistics for Blackwells Mills, 84.8% of individuals (4,324) out of the total population between 25 and 64 years of age (5,099) are in the labor force, with 3.5% or 151 of them being unemployed. The group with the highest labor force participation rate are those with the educational attainment of bachelor's degree or higher, with 87.2% or 3,753 individuals in the labor force. Within the labor force, individuals with college / associate degree education have the highest percentage of unemployment, with 21.0% or 86 of them being unemployed.
| Educational Attainment | In Labor Force | Unemployed |
| Less than High School | 6 (9.4%) | 0 (0.0%) |
| High School Diploma | 157 (74.1%) | 15 (7.0%) |
| College / Associate Degree | 410 (79.0%) | 109 (21.0%) |
| Bachelor's Degree or higher | 3,753 (87.2%) | 65 (1.5%) |
| Total | 4,324 (84.8%) | 178 (3.5%) |
Employment Occupations by Sex in Blackwells Mills
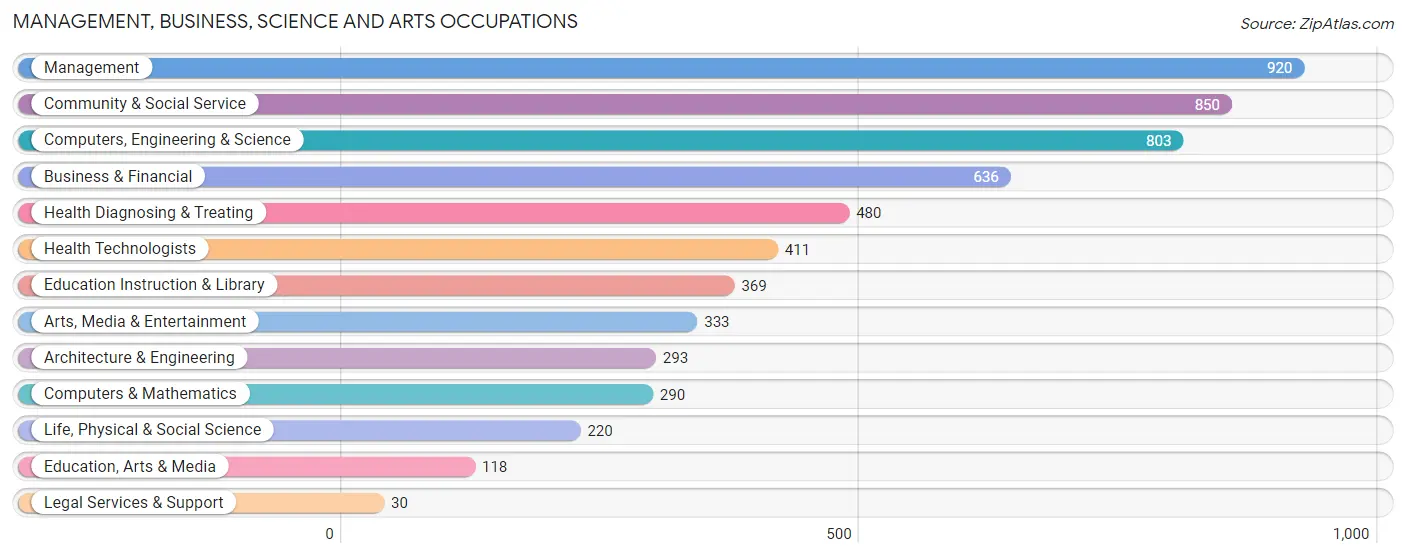
Management, Business, Science and Arts Occupations
The most common Management, Business, Science and Arts occupations in Blackwells Mills are Management (920 | 17.9%), Community & Social Service (850 | 16.6%), Computers, Engineering & Science (803 | 15.7%), Business & Financial (636 | 12.4%), and Health Diagnosing & Treating (480 | 9.3%).
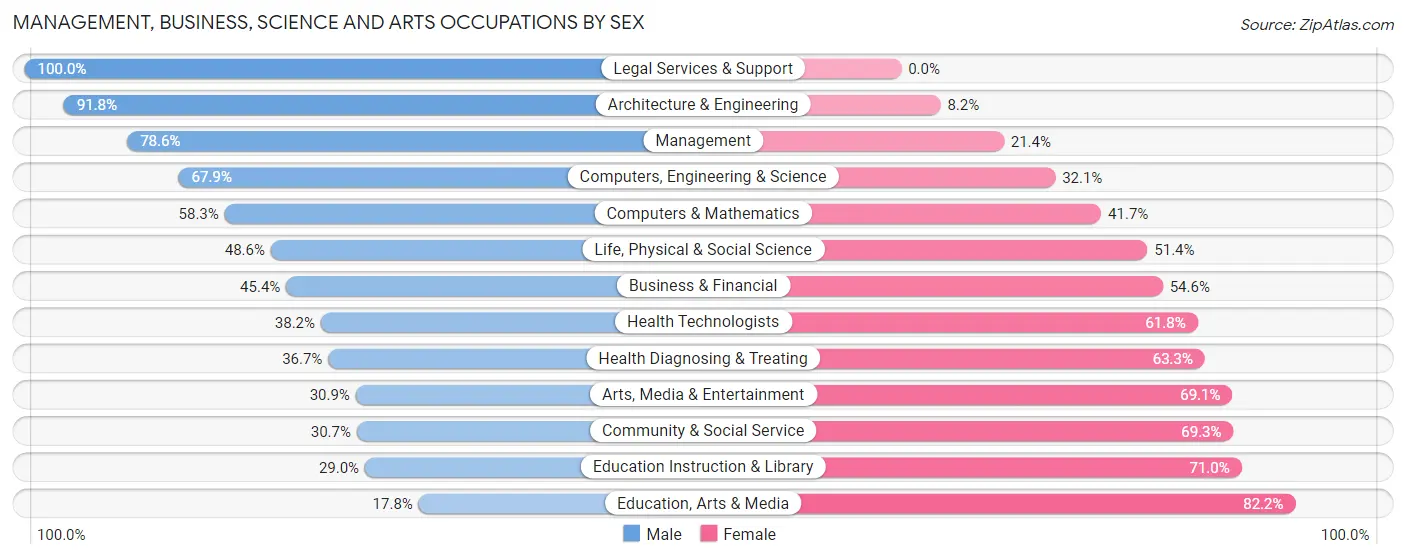
Management, Business, Science and Arts Occupations by Sex
Within the Management, Business, Science and Arts occupations in Blackwells Mills, the most male-oriented occupations are Legal Services & Support (100.0%), Architecture & Engineering (91.8%), and Management (78.6%), while the most female-oriented occupations are Education, Arts & Media (82.2%), Education Instruction & Library (71.0%), and Community & Social Service (69.3%).
| Occupation | Male | Female |
| Management | 723 (78.6%) | 197 (21.4%) |
| Business & Financial | 289 (45.4%) | 347 (54.6%) |
| Computers, Engineering & Science | 545 (67.9%) | 258 (32.1%) |
| Computers & Mathematics | 169 (58.3%) | 121 (41.7%) |
| Architecture & Engineering | 269 (91.8%) | 24 (8.2%) |
| Life, Physical & Social Science | 107 (48.6%) | 113 (51.4%) |
| Community & Social Service | 261 (30.7%) | 589 (69.3%) |
| Education, Arts & Media | 21 (17.8%) | 97 (82.2%) |
| Legal Services & Support | 30 (100.0%) | 0 (0.0%) |
| Education Instruction & Library | 107 (29.0%) | 262 (71.0%) |
| Arts, Media & Entertainment | 103 (30.9%) | 230 (69.1%) |
| Health Diagnosing & Treating | 176 (36.7%) | 304 (63.3%) |
| Health Technologists | 157 (38.2%) | 254 (61.8%) |
| Total (Category) | 1,994 (54.0%) | 1,695 (46.0%) |
| Total (Overall) | 2,709 (52.8%) | 2,423 (47.2%) |
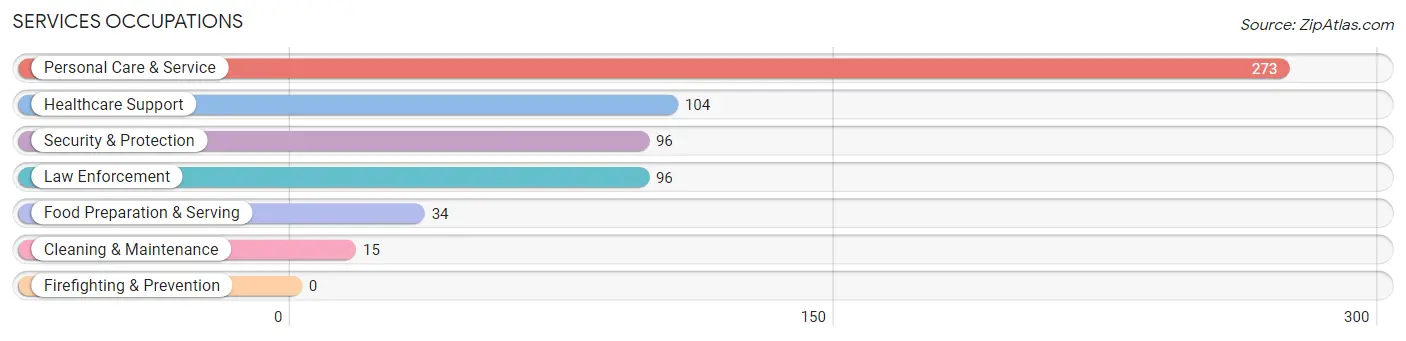
Services Occupations
The most common Services occupations in Blackwells Mills are Personal Care & Service (273 | 5.3%), Healthcare Support (104 | 2.0%), Security & Protection (96 | 1.9%), Law Enforcement (96 | 1.9%), and Food Preparation & Serving (34 | 0.7%).
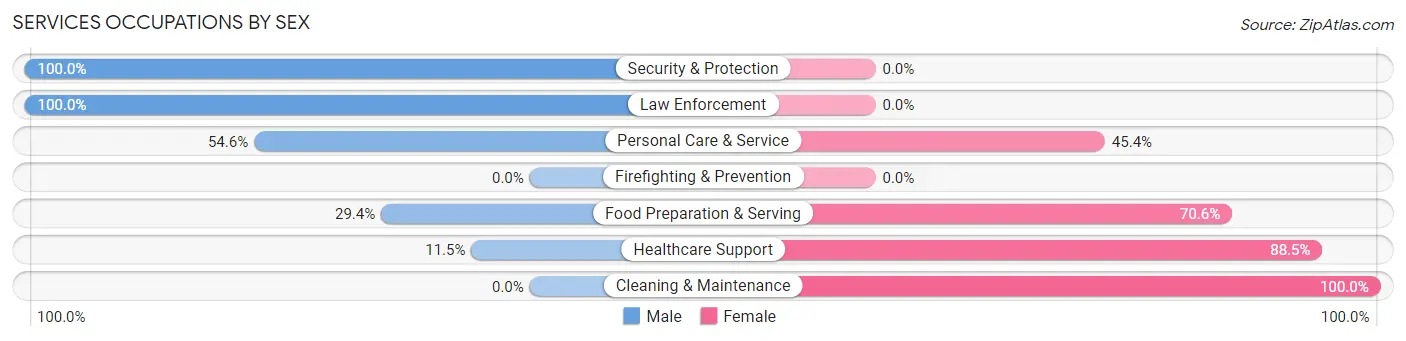
Services Occupations by Sex
Within the Services occupations in Blackwells Mills, the most male-oriented occupations are Security & Protection (100.0%), Law Enforcement (100.0%), and Personal Care & Service (54.6%), while the most female-oriented occupations are Cleaning & Maintenance (100.0%), Healthcare Support (88.5%), and Food Preparation & Serving (70.6%).
| Occupation | Male | Female |
| Healthcare Support | 12 (11.5%) | 92 (88.5%) |
| Security & Protection | 96 (100.0%) | 0 (0.0%) |
| Firefighting & Prevention | 0 (0.0%) | 0 (0.0%) |
| Law Enforcement | 96 (100.0%) | 0 (0.0%) |
| Food Preparation & Serving | 10 (29.4%) | 24 (70.6%) |
| Cleaning & Maintenance | 0 (0.0%) | 15 (100.0%) |
| Personal Care & Service | 149 (54.6%) | 124 (45.4%) |
| Total (Category) | 267 (51.1%) | 255 (48.8%) |
| Total (Overall) | 2,709 (52.8%) | 2,423 (47.2%) |
Sales and Office Occupations
The most common Sales and Office occupations in Blackwells Mills are Sales & Related (400 | 7.8%), and Office & Administration (342 | 6.7%).
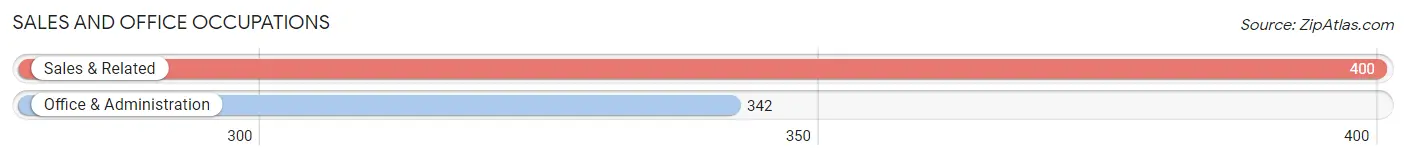
Sales and Office Occupations by Sex
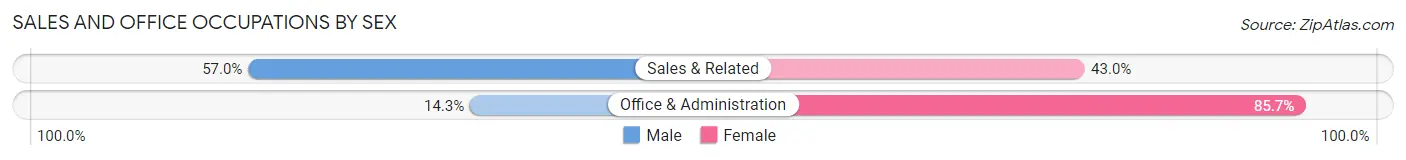
| Occupation | Male | Female |
| Sales & Related | 228 (57.0%) | 172 (43.0%) |
| Office & Administration | 49 (14.3%) | 293 (85.7%) |
| Total (Category) | 277 (37.3%) | 465 (62.7%) |
| Total (Overall) | 2,709 (52.8%) | 2,423 (47.2%) |
Natural Resources, Construction and Maintenance Occupations
The most common Natural Resources, Construction and Maintenance occupations in Blackwells Mills are Installation, Maintenance & Repair (57 | 1.1%), and Construction & Extraction (27 | 0.5%).
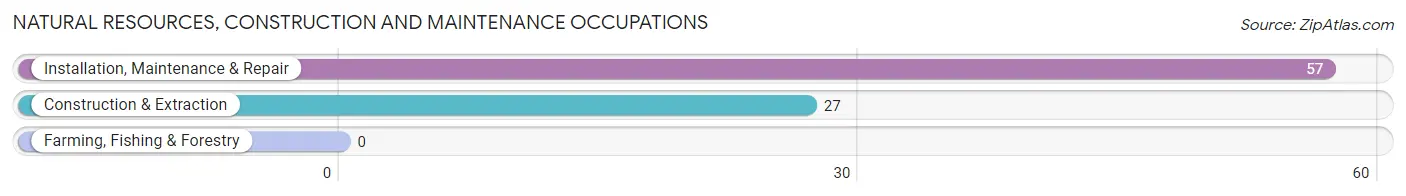
Natural Resources, Construction and Maintenance Occupations by Sex
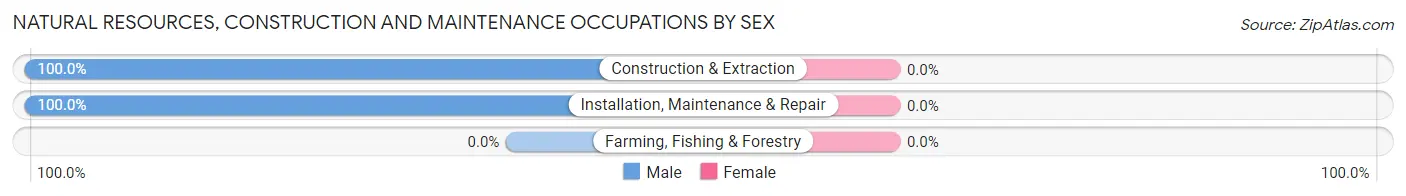
| Occupation | Male | Female |
| Farming, Fishing & Forestry | 0 (0.0%) | 0 (0.0%) |
| Construction & Extraction | 27 (100.0%) | 0 (0.0%) |
| Installation, Maintenance & Repair | 57 (100.0%) | 0 (0.0%) |
| Total (Category) | 84 (100.0%) | 0 (0.0%) |
| Total (Overall) | 2,709 (52.8%) | 2,423 (47.2%) |
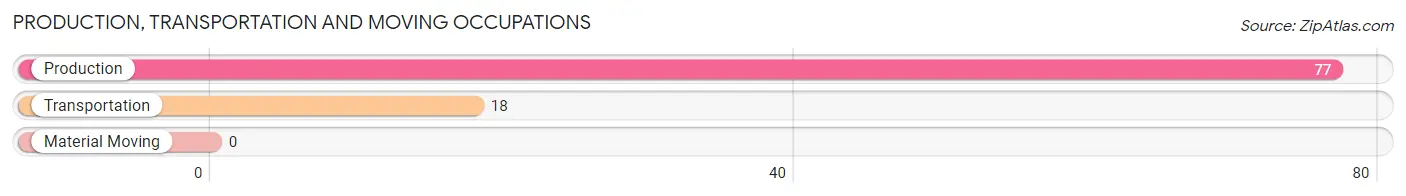
Production, Transportation and Moving Occupations
The most common Production, Transportation and Moving occupations in Blackwells Mills are Production (77 | 1.5%), and Transportation (18 | 0.4%).
Production, Transportation and Moving Occupations by Sex
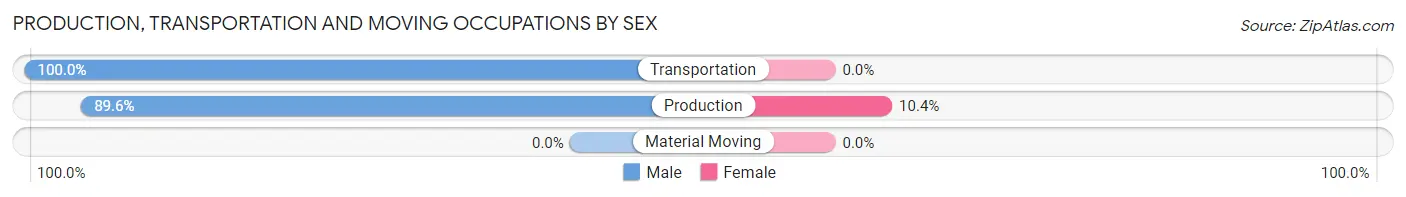
| Occupation | Male | Female |
| Production | 69 (89.6%) | 8 (10.4%) |
| Transportation | 18 (100.0%) | 0 (0.0%) |
| Material Moving | 0 (0.0%) | 0 (0.0%) |
| Total (Category) | 87 (91.6%) | 8 (8.4%) |
| Total (Overall) | 2,709 (52.8%) | 2,423 (47.2%) |
Employment Industries by Sex in Blackwells Mills
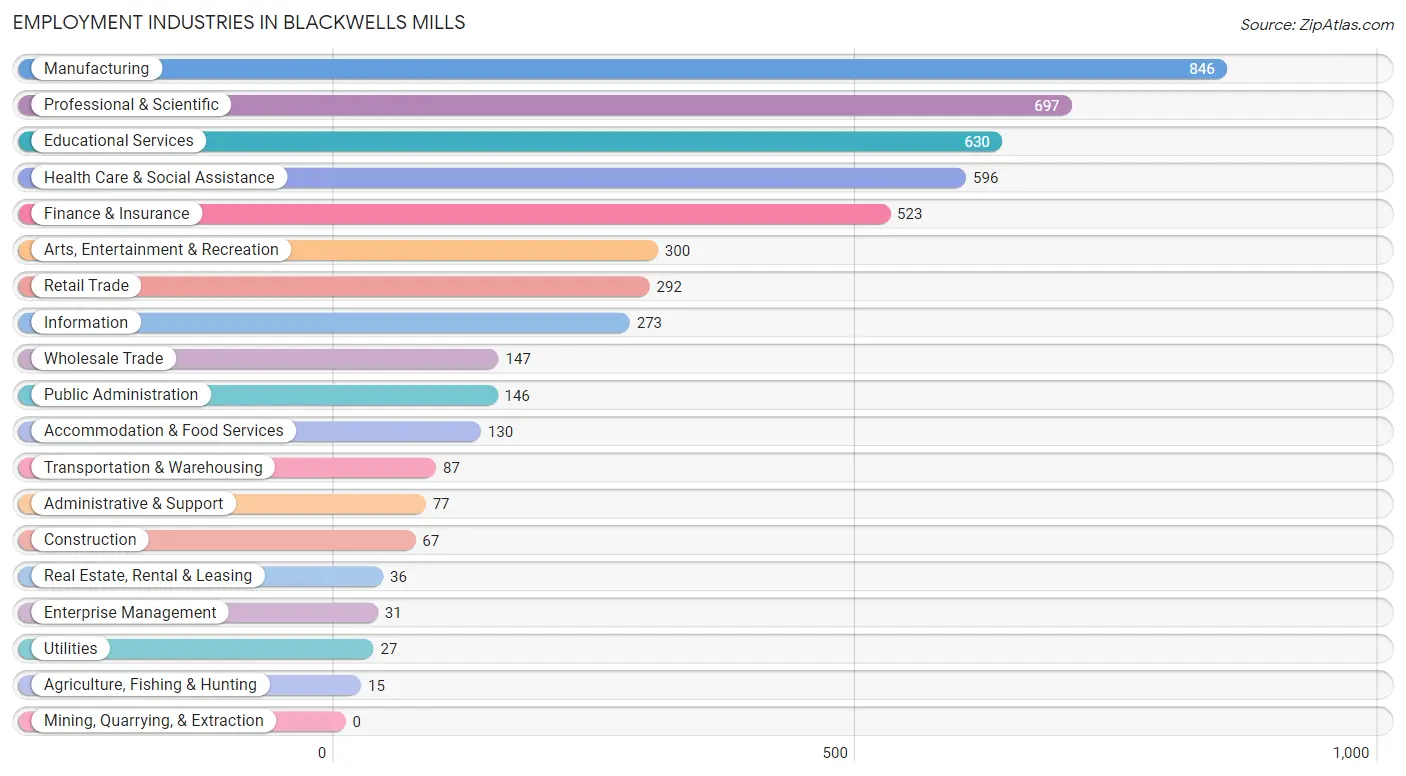
Employment Industries in Blackwells Mills
The major employment industries in Blackwells Mills include Manufacturing (846 | 16.5%), Professional & Scientific (697 | 13.6%), Educational Services (630 | 12.3%), Health Care & Social Assistance (596 | 11.6%), and Finance & Insurance (523 | 10.2%).
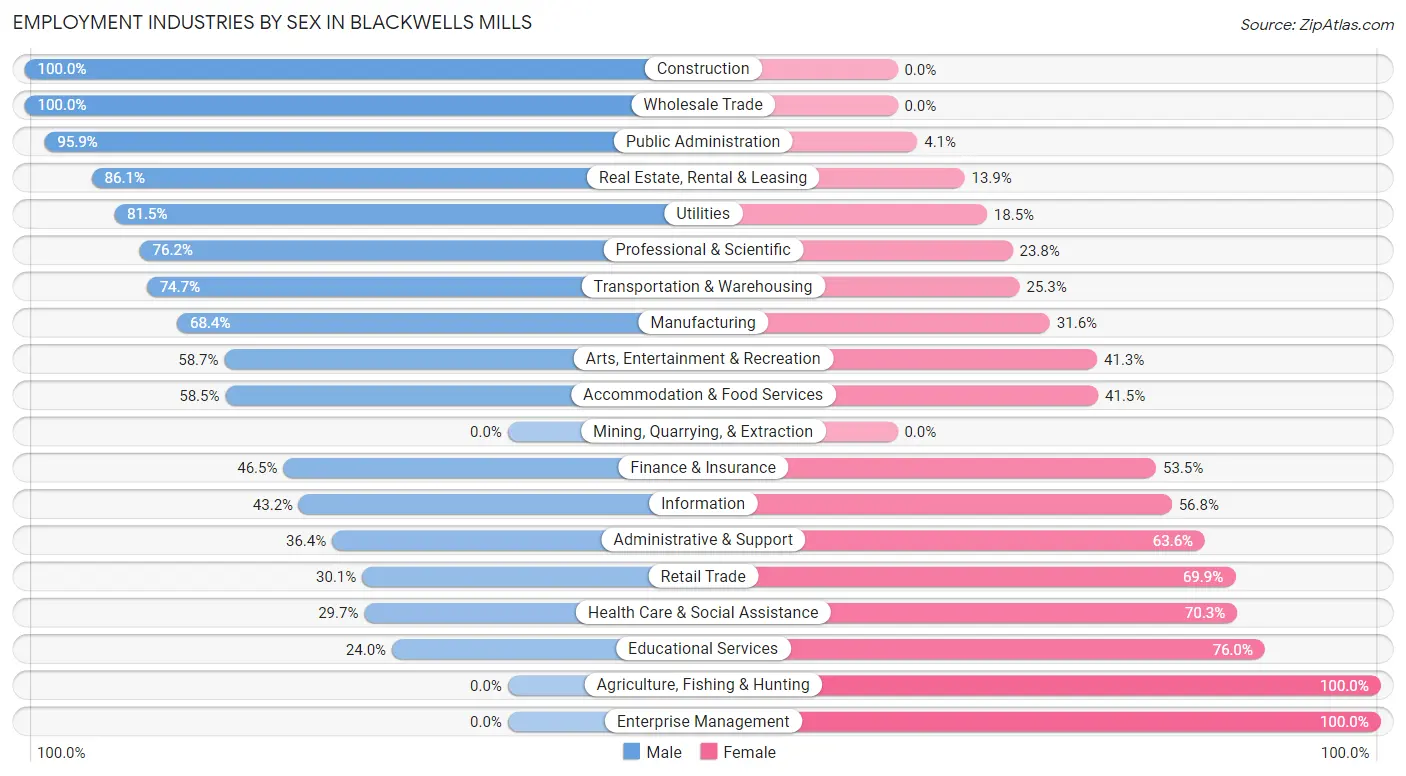
Employment Industries by Sex in Blackwells Mills
The Blackwells Mills industries that see more men than women are Construction (100.0%), Wholesale Trade (100.0%), and Public Administration (95.9%), whereas the industries that tend to have a higher number of women are Agriculture, Fishing & Hunting (100.0%), Enterprise Management (100.0%), and Educational Services (76.0%).
| Industry | Male | Female |
| Agriculture, Fishing & Hunting | 0 (0.0%) | 15 (100.0%) |
| Mining, Quarrying, & Extraction | 0 (0.0%) | 0 (0.0%) |
| Construction | 67 (100.0%) | 0 (0.0%) |
| Manufacturing | 579 (68.4%) | 267 (31.6%) |
| Wholesale Trade | 147 (100.0%) | 0 (0.0%) |
| Retail Trade | 88 (30.1%) | 204 (69.9%) |
| Transportation & Warehousing | 65 (74.7%) | 22 (25.3%) |
| Utilities | 22 (81.5%) | 5 (18.5%) |
| Information | 118 (43.2%) | 155 (56.8%) |
| Finance & Insurance | 243 (46.5%) | 280 (53.5%) |
| Real Estate, Rental & Leasing | 31 (86.1%) | 5 (13.9%) |
| Professional & Scientific | 531 (76.2%) | 166 (23.8%) |
| Enterprise Management | 0 (0.0%) | 31 (100.0%) |
| Administrative & Support | 28 (36.4%) | 49 (63.6%) |
| Educational Services | 151 (24.0%) | 479 (76.0%) |
| Health Care & Social Assistance | 177 (29.7%) | 419 (70.3%) |
| Arts, Entertainment & Recreation | 176 (58.7%) | 124 (41.3%) |
| Accommodation & Food Services | 76 (58.5%) | 54 (41.5%) |
| Public Administration | 140 (95.9%) | 6 (4.1%) |
| Total | 2,709 (52.8%) | 2,423 (47.2%) |
Education in Blackwells Mills
School Enrollment in Blackwells Mills
The most common levels of schooling among the 3,001 students in Blackwells Mills are elementary school (754 | 25.1%), high school (693 | 23.1%), and middle school (516 | 17.2%).
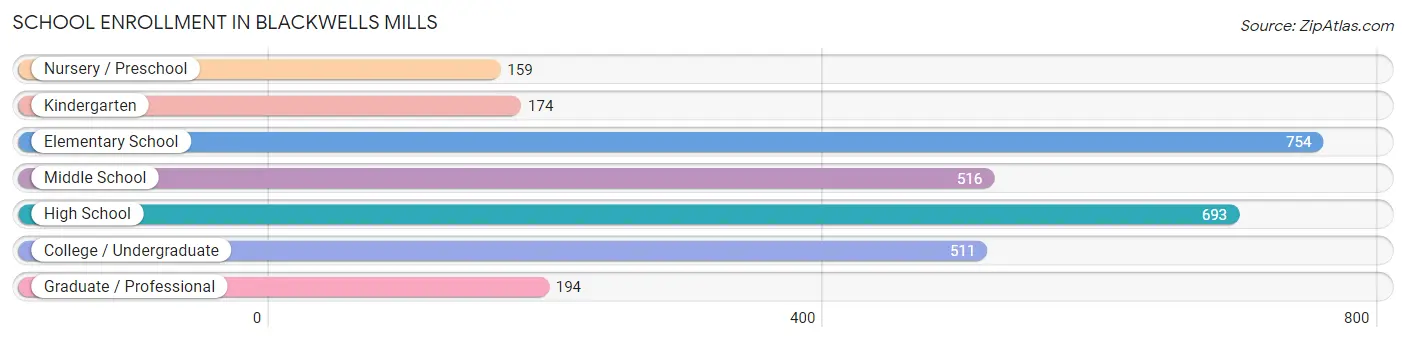
| School Level | # Students | % Students |
| Nursery / Preschool | 159 | 5.3% |
| Kindergarten | 174 | 5.8% |
| Elementary School | 754 | 25.1% |
| Middle School | 516 | 17.2% |
| High School | 693 | 23.1% |
| College / Undergraduate | 511 | 17.0% |
| Graduate / Professional | 194 | 6.5% |
| Total | 3,001 | 100.0% |
School Enrollment by Age by Funding Source in Blackwells Mills
Out of a total of 3,001 students who are enrolled in schools in Blackwells Mills, 624 (20.8%) attend a private institution, while the remaining 2,377 (79.2%) are enrolled in public schools. The age group of 25 to 34 year olds has the highest likelihood of being enrolled in private schools, with 68 (53.1% in the age bracket) enrolled. Conversely, the age group of 35 years and over has the lowest likelihood of being enrolled in a private school, with 86 (95.6% in the age bracket) attending a public institution.
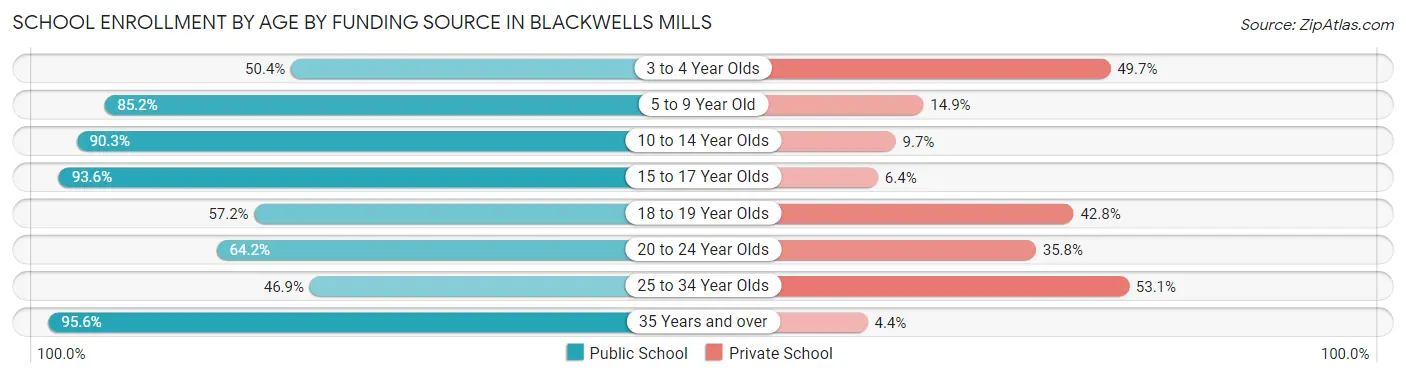
| Age Bracket | Public School | Private School |
| 3 to 4 Year Olds | 72 (50.3%) | 71 (49.6%) |
| 5 to 9 Year Old | 734 (85.2%) | 128 (14.8%) |
| 10 to 14 Year Olds | 682 (90.3%) | 73 (9.7%) |
| 15 to 17 Year Olds | 352 (93.6%) | 24 (6.4%) |
| 18 to 19 Year Olds | 191 (57.2%) | 143 (42.8%) |
| 20 to 24 Year Olds | 201 (64.2%) | 112 (35.8%) |
| 25 to 34 Year Olds | 60 (46.9%) | 68 (53.1%) |
| 35 Years and over | 86 (95.6%) | 4 (4.4%) |
| Total | 2,377 (79.2%) | 624 (20.8%) |
Educational Attainment by Field of Study in Blackwells Mills
Business (897 | 16.6%), computers & mathematics (728 | 13.5%), engineering (660 | 12.2%), science & technology (550 | 10.2%), and bio, nature & agricultural (395 | 7.3%) are the most common fields of study among 5,405 individuals in Blackwells Mills who have obtained a bachelor's degree or higher.
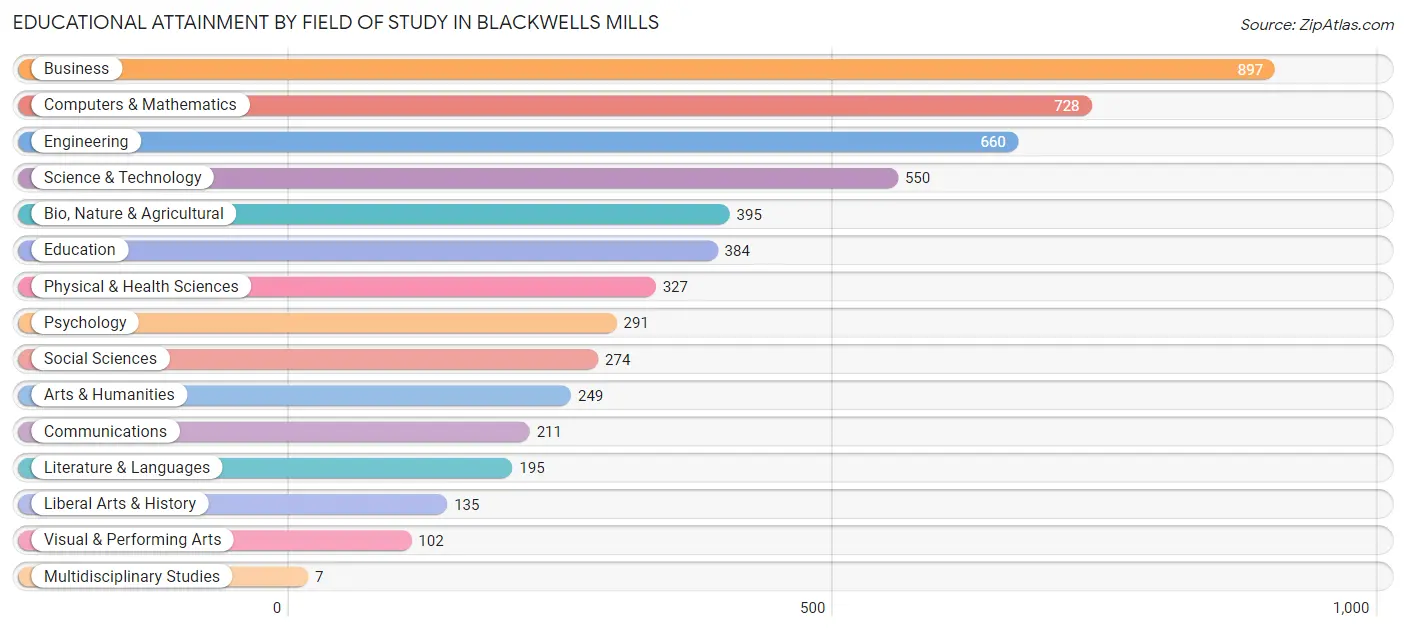
| Field of Study | # Graduates | % Graduates |
| Computers & Mathematics | 728 | 13.5% |
| Bio, Nature & Agricultural | 395 | 7.3% |
| Physical & Health Sciences | 327 | 6.0% |
| Psychology | 291 | 5.4% |
| Social Sciences | 274 | 5.1% |
| Engineering | 660 | 12.2% |
| Multidisciplinary Studies | 7 | 0.1% |
| Science & Technology | 550 | 10.2% |
| Business | 897 | 16.6% |
| Education | 384 | 7.1% |
| Literature & Languages | 195 | 3.6% |
| Liberal Arts & History | 135 | 2.5% |
| Visual & Performing Arts | 102 | 1.9% |
| Communications | 211 | 3.9% |
| Arts & Humanities | 249 | 4.6% |
| Total | 5,405 | 100.0% |
Transportation & Commute in Blackwells Mills
Vehicle Availability by Sex in Blackwells Mills
The most prevalent vehicle ownership categories in Blackwells Mills are males with 2 vehicles (1,137, accounting for 42.0%) and females with 2 vehicles (981, making up 49.5%).
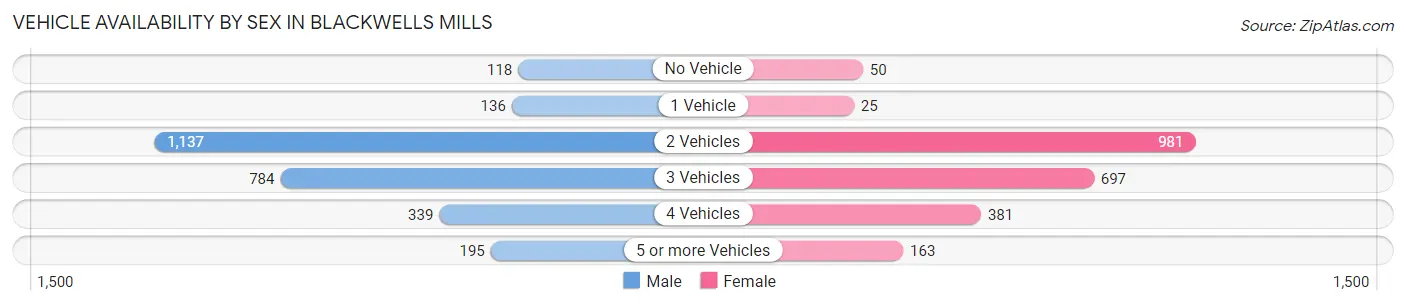
| Vehicles Available | Male | Female |
| No Vehicle | 118 (4.4%) | 50 (2.2%) |
| 1 Vehicle | 136 (5.0%) | 25 (1.1%) |
| 2 Vehicles | 1,137 (42.0%) | 981 (42.7%) |
| 3 Vehicles | 784 (28.9%) | 697 (30.3%) |
| 4 Vehicles | 339 (12.5%) | 381 (16.6%) |
| 5 or more Vehicles | 195 (7.2%) | 163 (7.1%) |
| Total | 2,709 (100.0%) | 2,297 (100.0%) |
Commute Time in Blackwells Mills
The most frequently occuring commute durations in Blackwells Mills are 45 to 59 minutes (864 commuters, 22.4%), 20 to 24 minutes (636 commuters, 16.5%), and 30 to 34 minutes (476 commuters, 12.4%).
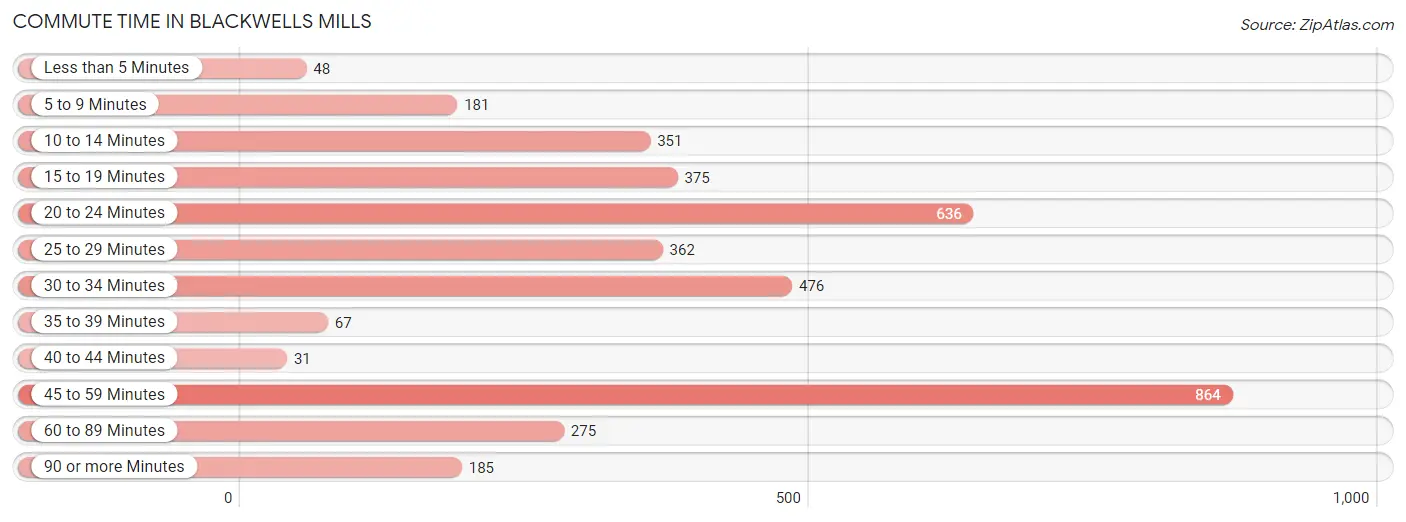
| Commute Time | # Commuters | % Commuters |
| Less than 5 Minutes | 48 | 1.3% |
| 5 to 9 Minutes | 181 | 4.7% |
| 10 to 14 Minutes | 351 | 9.1% |
| 15 to 19 Minutes | 375 | 9.7% |
| 20 to 24 Minutes | 636 | 16.5% |
| 25 to 29 Minutes | 362 | 9.4% |
| 30 to 34 Minutes | 476 | 12.4% |
| 35 to 39 Minutes | 67 | 1.7% |
| 40 to 44 Minutes | 31 | 0.8% |
| 45 to 59 Minutes | 864 | 22.4% |
| 60 to 89 Minutes | 275 | 7.1% |
| 90 or more Minutes | 185 | 4.8% |
Commute Time by Sex in Blackwells Mills
The most common commute times in Blackwells Mills are 45 to 59 minutes (508 commuters, 26.2%) for males and 45 to 59 minutes (356 commuters, 18.6%) for females.
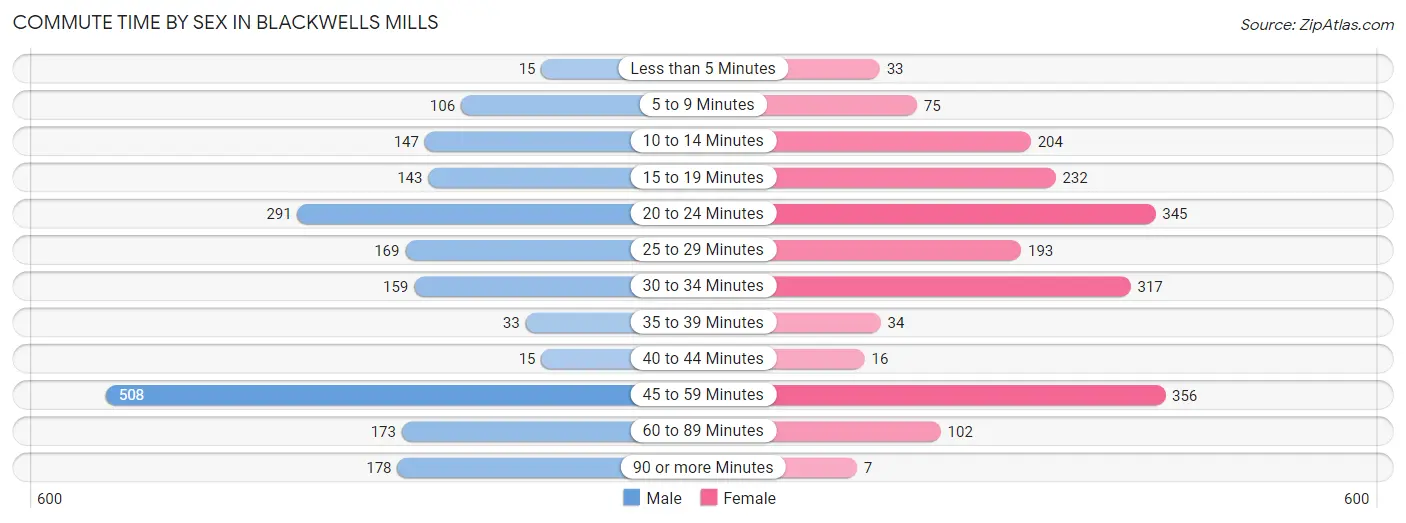
| Commute Time | Male | Female |
| Less than 5 Minutes | 15 (0.8%) | 33 (1.7%) |
| 5 to 9 Minutes | 106 (5.5%) | 75 (3.9%) |
| 10 to 14 Minutes | 147 (7.6%) | 204 (10.7%) |
| 15 to 19 Minutes | 143 (7.4%) | 232 (12.1%) |
| 20 to 24 Minutes | 291 (15.0%) | 345 (18.0%) |
| 25 to 29 Minutes | 169 (8.7%) | 193 (10.1%) |
| 30 to 34 Minutes | 159 (8.2%) | 317 (16.6%) |
| 35 to 39 Minutes | 33 (1.7%) | 34 (1.8%) |
| 40 to 44 Minutes | 15 (0.8%) | 16 (0.8%) |
| 45 to 59 Minutes | 508 (26.2%) | 356 (18.6%) |
| 60 to 89 Minutes | 173 (8.9%) | 102 (5.3%) |
| 90 or more Minutes | 178 (9.2%) | 7 (0.4%) |
Time of Departure to Work by Sex in Blackwells Mills
The most frequent times of departure to work in Blackwells Mills are 8:00 AM to 8:29 AM (419, 21.6%) for males and 8:00 AM to 8:29 AM (586, 30.6%) for females.
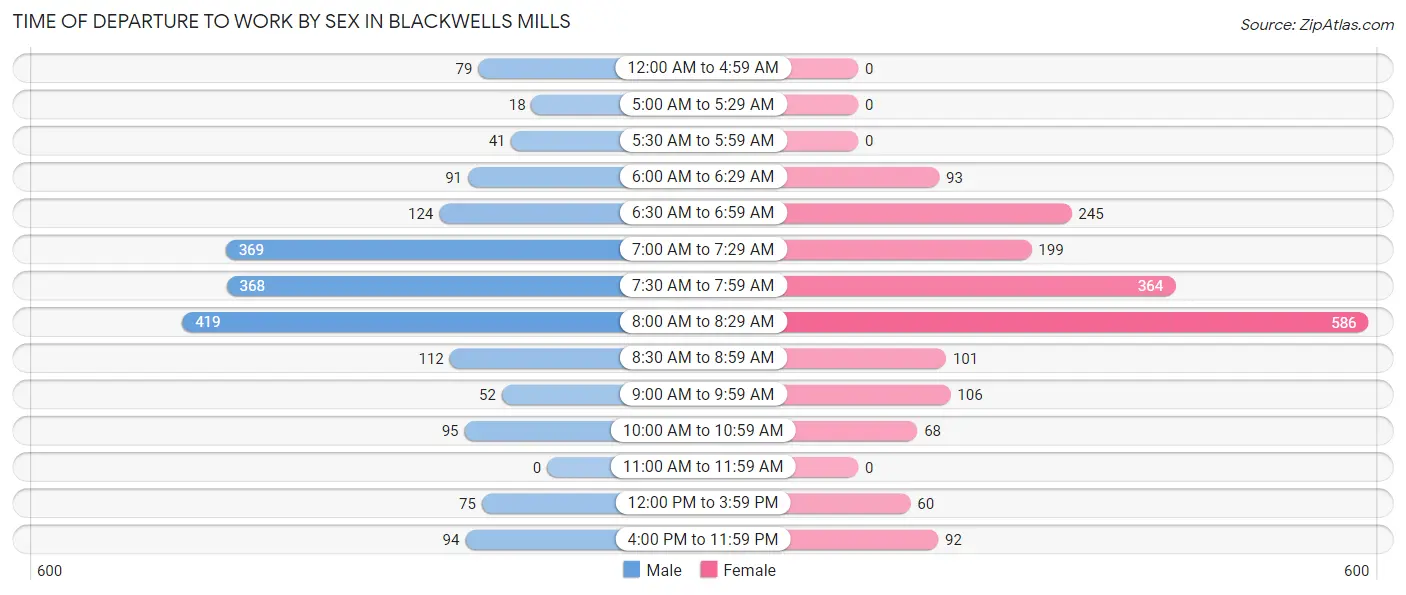
| Time of Departure | Male | Female |
| 12:00 AM to 4:59 AM | 79 (4.1%) | 0 (0.0%) |
| 5:00 AM to 5:29 AM | 18 (0.9%) | 0 (0.0%) |
| 5:30 AM to 5:59 AM | 41 (2.1%) | 0 (0.0%) |
| 6:00 AM to 6:29 AM | 91 (4.7%) | 93 (4.9%) |
| 6:30 AM to 6:59 AM | 124 (6.4%) | 245 (12.8%) |
| 7:00 AM to 7:29 AM | 369 (19.1%) | 199 (10.4%) |
| 7:30 AM to 7:59 AM | 368 (19.0%) | 364 (19.0%) |
| 8:00 AM to 8:29 AM | 419 (21.6%) | 586 (30.6%) |
| 8:30 AM to 8:59 AM | 112 (5.8%) | 101 (5.3%) |
| 9:00 AM to 9:59 AM | 52 (2.7%) | 106 (5.5%) |
| 10:00 AM to 10:59 AM | 95 (4.9%) | 68 (3.5%) |
| 11:00 AM to 11:59 AM | 0 (0.0%) | 0 (0.0%) |
| 12:00 PM to 3:59 PM | 75 (3.9%) | 60 (3.1%) |
| 4:00 PM to 11:59 PM | 94 (4.9%) | 92 (4.8%) |
| Total | 1,937 (100.0%) | 1,914 (100.0%) |
Housing Occupancy in Blackwells Mills
Occupancy by Ownership in Blackwells Mills
Of the total 2,871 dwellings in Blackwells Mills, owner-occupied units account for 2,796 (97.4%), while renter-occupied units make up 75 (2.6%).
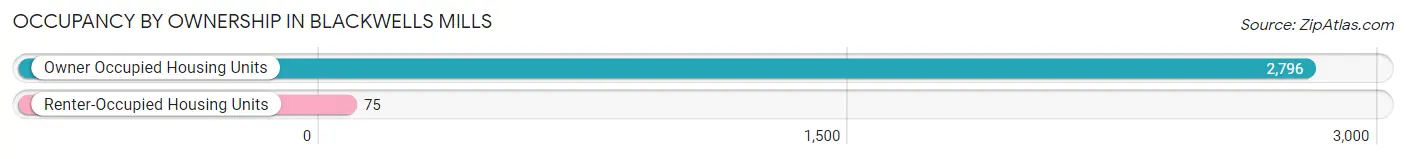
| Occupancy | # Housing Units | % Housing Units |
| Owner Occupied Housing Units | 2,796 | 97.4% |
| Renter-Occupied Housing Units | 75 | 2.6% |
| Total Occupied Housing Units | 2,871 | 100.0% |
Occupancy by Household Size in Blackwells Mills
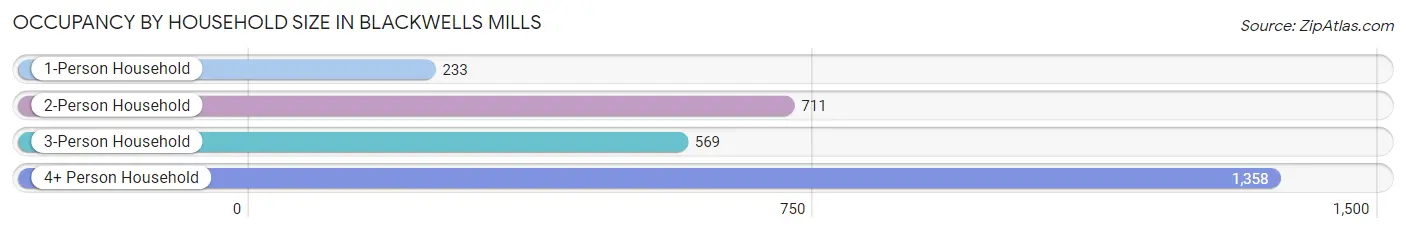
| Household Size | # Housing Units | % Housing Units |
| 1-Person Household | 233 | 8.1% |
| 2-Person Household | 711 | 24.8% |
| 3-Person Household | 569 | 19.8% |
| 4+ Person Household | 1,358 | 47.3% |
| Total Housing Units | 2,871 | 100.0% |
Occupancy by Ownership by Household Size in Blackwells Mills
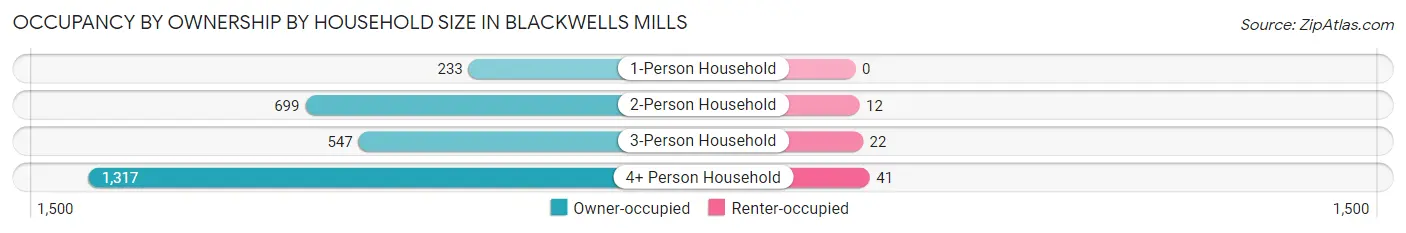
| Household Size | Owner-occupied | Renter-occupied |
| 1-Person Household | 233 (100.0%) | 0 (0.0%) |
| 2-Person Household | 699 (98.3%) | 12 (1.7%) |
| 3-Person Household | 547 (96.1%) | 22 (3.9%) |
| 4+ Person Household | 1,317 (97.0%) | 41 (3.0%) |
| Total Housing Units | 2,796 (97.4%) | 75 (2.6%) |
Occupancy by Educational Attainment in Blackwells Mills
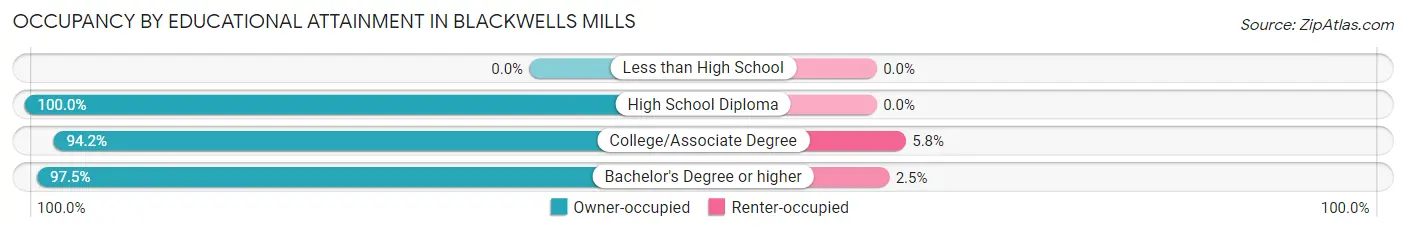
| Household Size | Owner-occupied | Renter-occupied |
| Less than High School | 0 (0.0%) | 0 (0.0%) |
| High School Diploma | 124 (100.0%) | 0 (0.0%) |
| College/Associate Degree | 196 (94.2%) | 12 (5.8%) |
| Bachelor's Degree or higher | 2,476 (97.5%) | 63 (2.5%) |
Occupancy by Age of Householder in Blackwells Mills
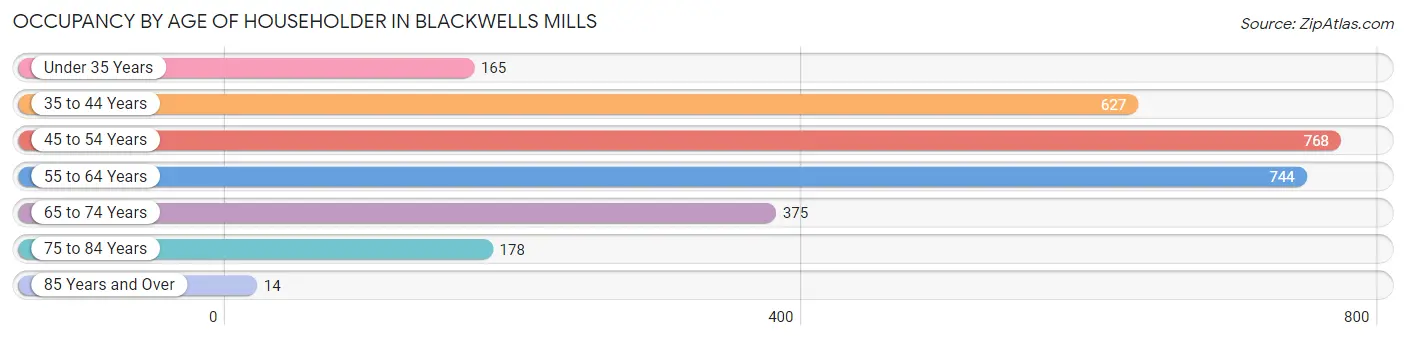
| Age Bracket | # Households | % Households |
| Under 35 Years | 165 | 5.8% |
| 35 to 44 Years | 627 | 21.8% |
| 45 to 54 Years | 768 | 26.8% |
| 55 to 64 Years | 744 | 25.9% |
| 65 to 74 Years | 375 | 13.1% |
| 75 to 84 Years | 178 | 6.2% |
| 85 Years and Over | 14 | 0.5% |
| Total | 2,871 | 100.0% |
Housing Finances in Blackwells Mills
Median Income by Occupancy in Blackwells Mills
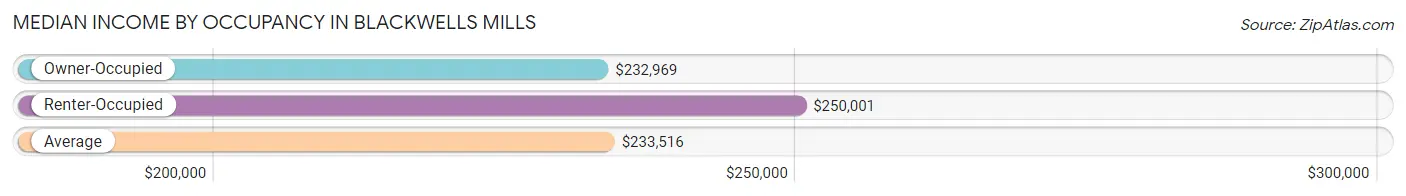
| Occupancy Type | # Households | Median Income |
| Owner-Occupied | 2,796 (97.4%) | $232,969 |
| Renter-Occupied | 75 (2.6%) | $250,001 |
| Average | 2,871 (100.0%) | $233,516 |
Occupancy by Householder Income Bracket in Blackwells Mills
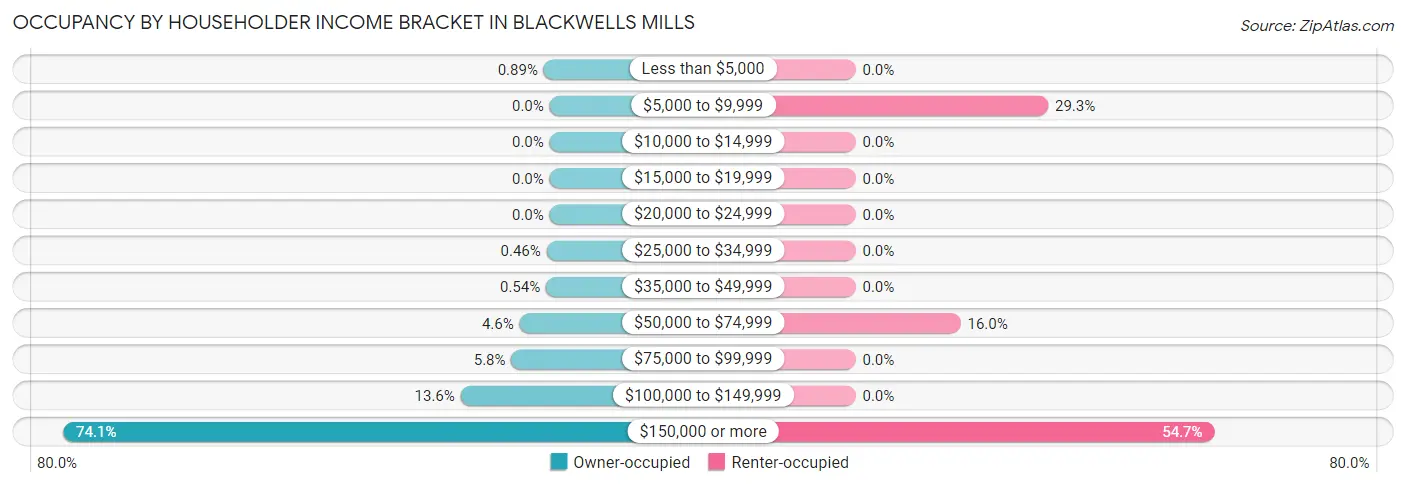
| Income Bracket | Owner-occupied | Renter-occupied |
| Less than $5,000 | 25 (0.9%) | 0 (0.0%) |
| $5,000 to $9,999 | 0 (0.0%) | 22 (29.3%) |
| $10,000 to $14,999 | 0 (0.0%) | 0 (0.0%) |
| $15,000 to $19,999 | 0 (0.0%) | 0 (0.0%) |
| $20,000 to $24,999 | 0 (0.0%) | 0 (0.0%) |
| $25,000 to $34,999 | 13 (0.5%) | 0 (0.0%) |
| $35,000 to $49,999 | 15 (0.5%) | 0 (0.0%) |
| $50,000 to $74,999 | 128 (4.6%) | 12 (16.0%) |
| $75,000 to $99,999 | 163 (5.8%) | 0 (0.0%) |
| $100,000 to $149,999 | 379 (13.6%) | 0 (0.0%) |
| $150,000 or more | 2,073 (74.1%) | 41 (54.7%) |
| Total | 2,796 (100.0%) | 75 (100.0%) |
Monthly Housing Cost Tiers in Blackwells Mills
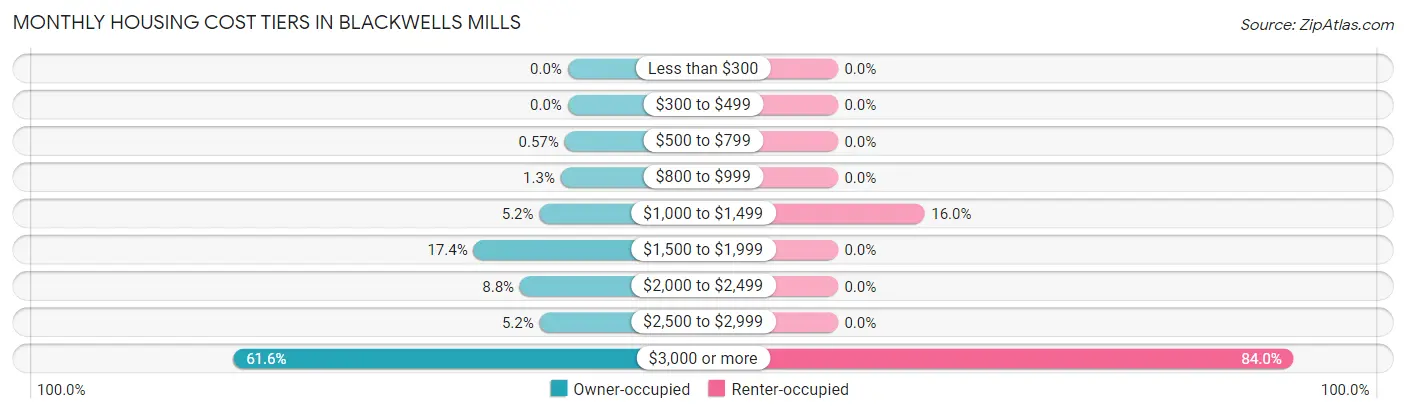
| Monthly Cost | Owner-occupied | Renter-occupied |
| Less than $300 | 0 (0.0%) | 0 (0.0%) |
| $300 to $499 | 0 (0.0%) | 0 (0.0%) |
| $500 to $799 | 16 (0.6%) | 0 (0.0%) |
| $800 to $999 | 36 (1.3%) | 0 (0.0%) |
| $1,000 to $1,499 | 146 (5.2%) | 12 (16.0%) |
| $1,500 to $1,999 | 485 (17.3%) | 0 (0.0%) |
| $2,000 to $2,499 | 246 (8.8%) | 0 (0.0%) |
| $2,500 to $2,999 | 145 (5.2%) | 0 (0.0%) |
| $3,000 or more | 1,722 (61.6%) | 63 (84.0%) |
| Total | 2,796 (100.0%) | 75 (100.0%) |
Physical Housing Characteristics in Blackwells Mills
Housing Structures in Blackwells Mills
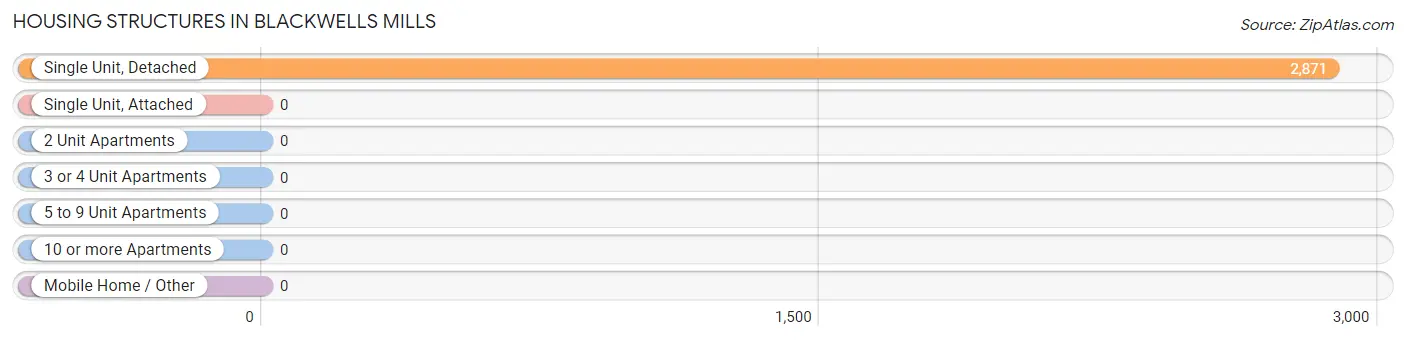
| Structure Type | # Housing Units | % Housing Units |
| Single Unit, Detached | 2,871 | 100.0% |
| Single Unit, Attached | 0 | 0.0% |
| 2 Unit Apartments | 0 | 0.0% |
| 3 or 4 Unit Apartments | 0 | 0.0% |
| 5 to 9 Unit Apartments | 0 | 0.0% |
| 10 or more Apartments | 0 | 0.0% |
| Mobile Home / Other | 0 | 0.0% |
| Total | 2,871 | 100.0% |
Housing Structures by Occupancy in Blackwells Mills
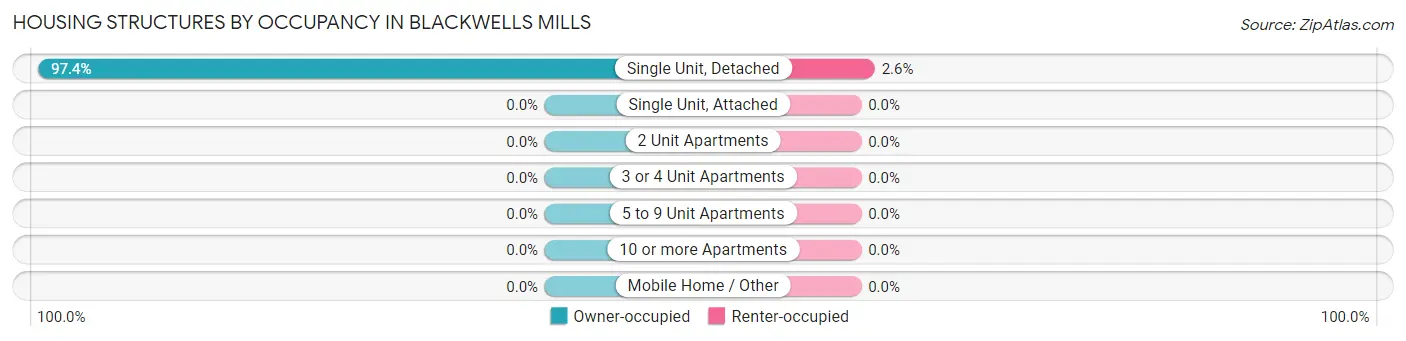
| Structure Type | Owner-occupied | Renter-occupied |
| Single Unit, Detached | 2,796 (97.4%) | 75 (2.6%) |
| Single Unit, Attached | 0 (0.0%) | 0 (0.0%) |
| 2 Unit Apartments | 0 (0.0%) | 0 (0.0%) |
| 3 or 4 Unit Apartments | 0 (0.0%) | 0 (0.0%) |
| 5 to 9 Unit Apartments | 0 (0.0%) | 0 (0.0%) |
| 10 or more Apartments | 0 (0.0%) | 0 (0.0%) |
| Mobile Home / Other | 0 (0.0%) | 0 (0.0%) |
| Total | 2,796 (97.4%) | 75 (2.6%) |
Housing Structures by Number of Rooms in Blackwells Mills
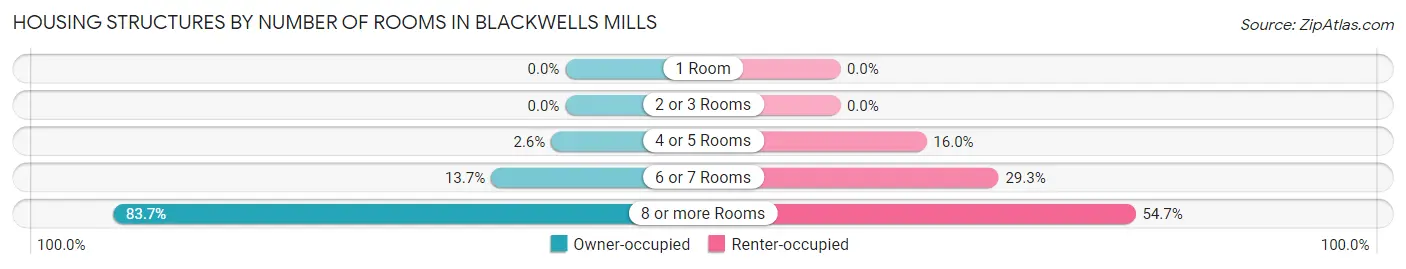
| Number of Rooms | Owner-occupied | Renter-occupied |
| 1 Room | 0 (0.0%) | 0 (0.0%) |
| 2 or 3 Rooms | 0 (0.0%) | 0 (0.0%) |
| 4 or 5 Rooms | 73 (2.6%) | 12 (16.0%) |
| 6 or 7 Rooms | 384 (13.7%) | 22 (29.3%) |
| 8 or more Rooms | 2,339 (83.7%) | 41 (54.7%) |
| Total | 2,796 (100.0%) | 75 (100.0%) |
Housing Structure by Heating Type in Blackwells Mills
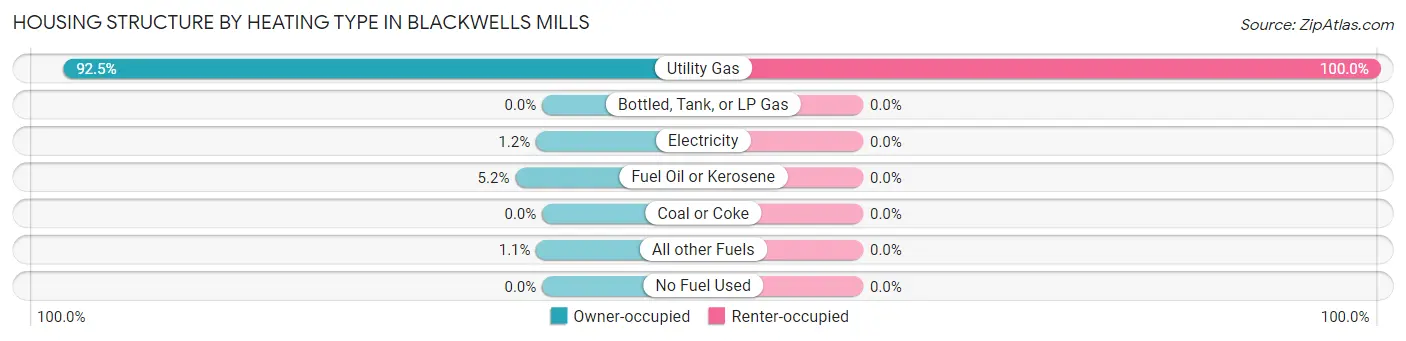
| Heating Type | Owner-occupied | Renter-occupied |
| Utility Gas | 2,587 (92.5%) | 75 (100.0%) |
| Bottled, Tank, or LP Gas | 0 (0.0%) | 0 (0.0%) |
| Electricity | 33 (1.2%) | 0 (0.0%) |
| Fuel Oil or Kerosene | 145 (5.2%) | 0 (0.0%) |
| Coal or Coke | 0 (0.0%) | 0 (0.0%) |
| All other Fuels | 31 (1.1%) | 0 (0.0%) |
| No Fuel Used | 0 (0.0%) | 0 (0.0%) |
| Total | 2,796 (100.0%) | 75 (100.0%) |
Household Vehicle Usage in Blackwells Mills
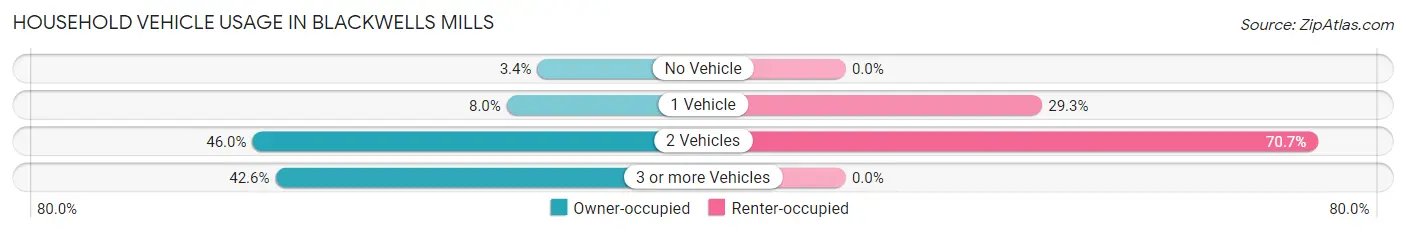
| Vehicles per Household | Owner-occupied | Renter-occupied |
| No Vehicle | 96 (3.4%) | 0 (0.0%) |
| 1 Vehicle | 224 (8.0%) | 22 (29.3%) |
| 2 Vehicles | 1,286 (46.0%) | 53 (70.7%) |
| 3 or more Vehicles | 1,190 (42.6%) | 0 (0.0%) |
| Total | 2,796 (100.0%) | 75 (100.0%) |
Real Estate & Mortgages in Blackwells Mills
Real Estate and Mortgage Overview in Blackwells Mills
| Characteristic | Without Mortgage | With Mortgage |
| Housing Units | 809 | 1,987 |
| Median Property Value | $639,800 | $717,900 |
| Median Household Income | $213,487 | $1,527 |
| Monthly Housing Costs | $1,501 | $1,712 |
| Real Estate Taxes | $10,001 | $0 |
Property Value by Mortgage Status in Blackwells Mills
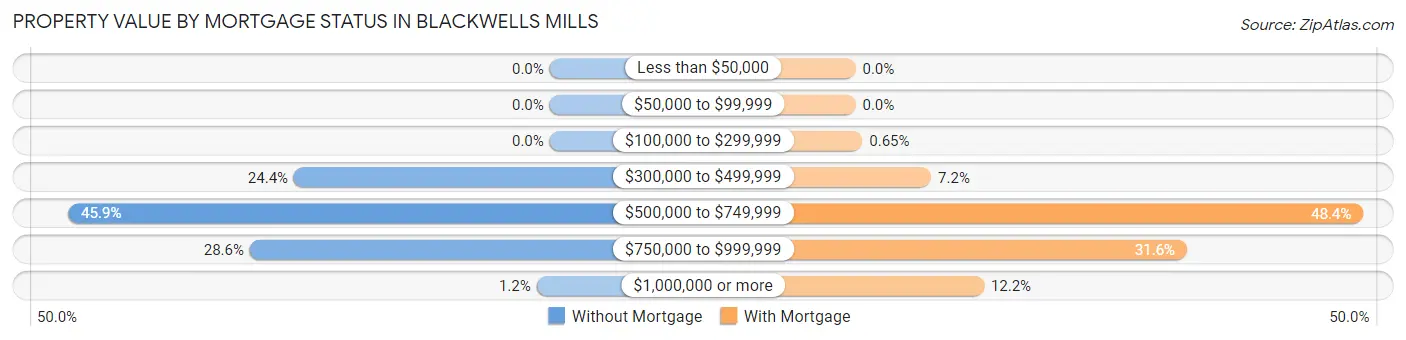
| Property Value | Without Mortgage | With Mortgage |
| Less than $50,000 | 0 (0.0%) | 0 (0.0%) |
| $50,000 to $99,999 | 0 (0.0%) | 0 (0.0%) |
| $100,000 to $299,999 | 0 (0.0%) | 13 (0.6%) |
| $300,000 to $499,999 | 197 (24.3%) | 143 (7.2%) |
| $500,000 to $749,999 | 371 (45.9%) | 961 (48.4%) |
| $750,000 to $999,999 | 231 (28.5%) | 627 (31.6%) |
| $1,000,000 or more | 10 (1.2%) | 243 (12.2%) |
| Total | 809 (100.0%) | 1,987 (100.0%) |
Household Income by Mortgage Status in Blackwells Mills
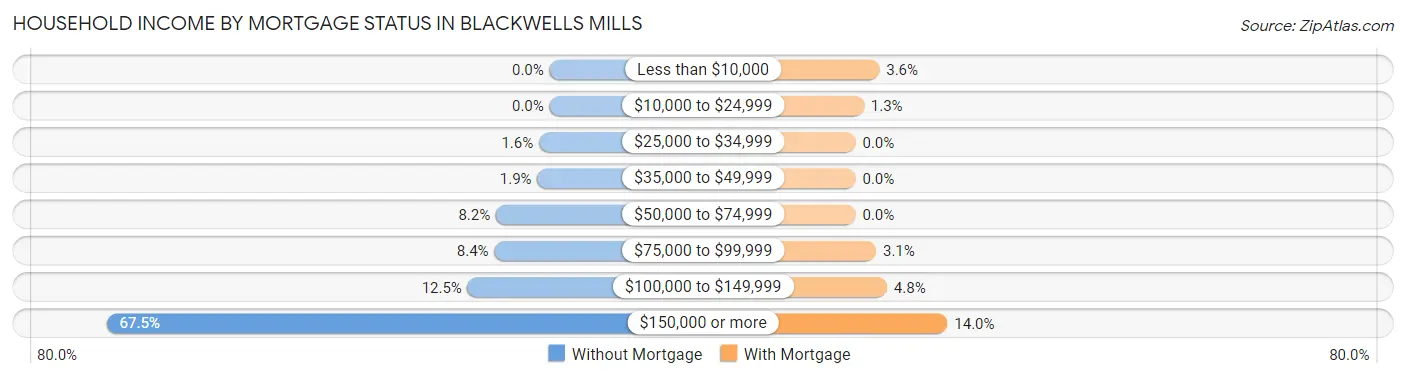
| Household Income | Without Mortgage | With Mortgage |
| Less than $10,000 | 0 (0.0%) | 72 (3.6%) |
| $10,000 to $24,999 | 0 (0.0%) | 25 (1.3%) |
| $25,000 to $34,999 | 13 (1.6%) | 0 (0.0%) |
| $35,000 to $49,999 | 15 (1.8%) | 0 (0.0%) |
| $50,000 to $74,999 | 66 (8.2%) | 0 (0.0%) |
| $75,000 to $99,999 | 68 (8.4%) | 62 (3.1%) |
| $100,000 to $149,999 | 101 (12.5%) | 95 (4.8%) |
| $150,000 or more | 546 (67.5%) | 278 (14.0%) |
| Total | 809 (100.0%) | 1,987 (100.0%) |
Property Value to Household Income Ratio in Blackwells Mills
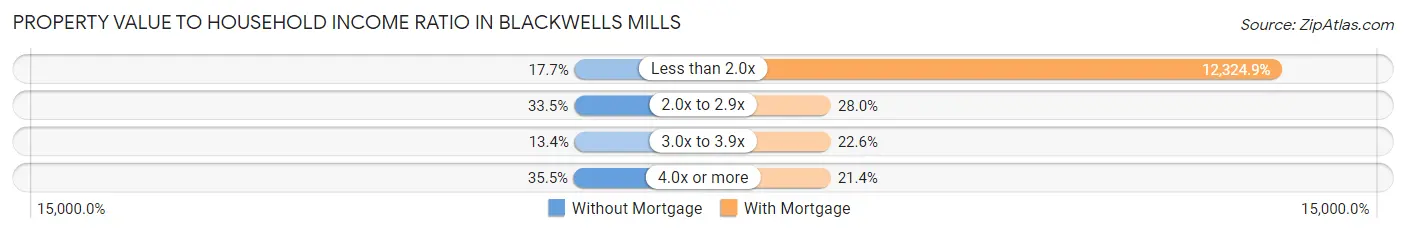
| Value-to-Income Ratio | Without Mortgage | With Mortgage |
| Less than 2.0x | 143 (17.7%) | 244,896 (12,324.9%) |
| 2.0x to 2.9x | 271 (33.5%) | 556 (28.0%) |
| 3.0x to 3.9x | 108 (13.4%) | 449 (22.6%) |
| 4.0x or more | 287 (35.5%) | 426 (21.4%) |
| Total | 809 (100.0%) | 1,987 (100.0%) |
Real Estate Taxes by Mortgage Status in Blackwells Mills
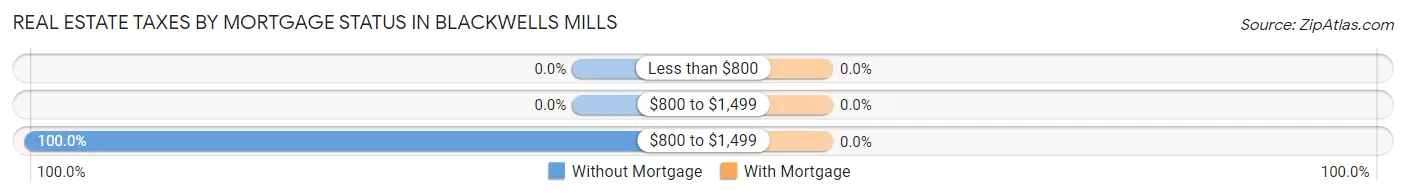
| Property Taxes | Without Mortgage | With Mortgage |
| Less than $800 | 0 (0.0%) | 0 (0.0%) |
| $800 to $1,499 | 0 (0.0%) | 0 (0.0%) |
| $800 to $1,499 | 809 (100.0%) | 0 (0.0%) |
| Total | 809 (100.0%) | 1,987 (100.0%) |
Health & Disability in Blackwells Mills
Health Insurance Coverage by Age in Blackwells Mills
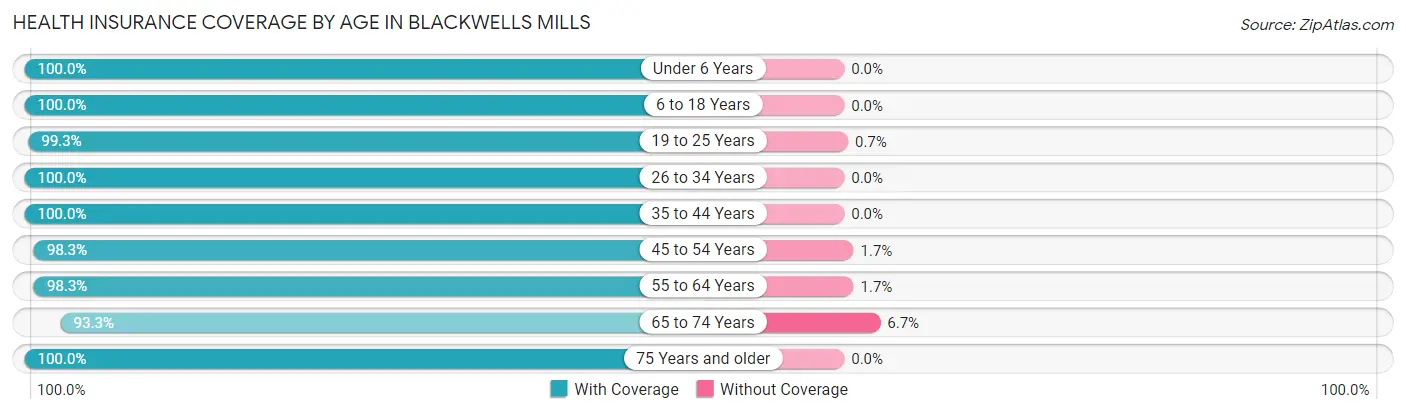
| Age Bracket | With Coverage | Without Coverage |
| Under 6 Years | 651 (100.0%) | 0 (0.0%) |
| 6 to 18 Years | 2,110 (100.0%) | 0 (0.0%) |
| 19 to 25 Years | 857 (99.3%) | 6 (0.7%) |
| 26 to 34 Years | 638 (100.0%) | 0 (0.0%) |
| 35 to 44 Years | 1,437 (100.0%) | 0 (0.0%) |
| 45 to 54 Years | 1,247 (98.3%) | 22 (1.7%) |
| 55 to 64 Years | 1,697 (98.3%) | 30 (1.7%) |
| 65 to 74 Years | 859 (93.3%) | 62 (6.7%) |
| 75 Years and older | 431 (100.0%) | 0 (0.0%) |
| Total | 9,927 (98.8%) | 120 (1.2%) |
Health Insurance Coverage by Citizenship Status in Blackwells Mills
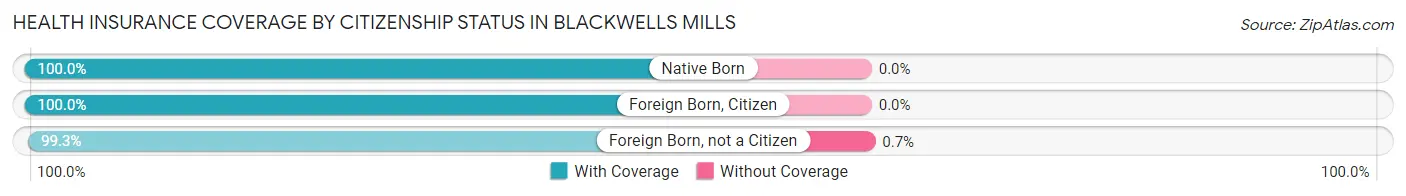
| Citizenship Status | With Coverage | Without Coverage |
| Native Born | 651 (100.0%) | 0 (0.0%) |
| Foreign Born, Citizen | 2,110 (100.0%) | 0 (0.0%) |
| Foreign Born, not a Citizen | 857 (99.3%) | 6 (0.7%) |
Health Insurance Coverage by Household Income in Blackwells Mills
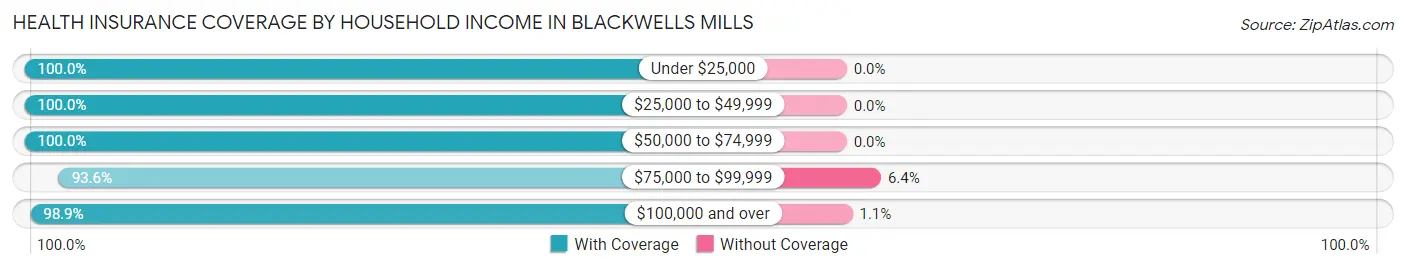
| Household Income | With Coverage | Without Coverage |
| Under $25,000 | 121 (100.0%) | 0 (0.0%) |
| $25,000 to $49,999 | 58 (100.0%) | 0 (0.0%) |
| $50,000 to $74,999 | 347 (100.0%) | 0 (0.0%) |
| $75,000 to $99,999 | 322 (93.6%) | 22 (6.4%) |
| $100,000 and over | 9,047 (98.9%) | 98 (1.1%) |
Public vs Private Health Insurance Coverage by Age in Blackwells Mills
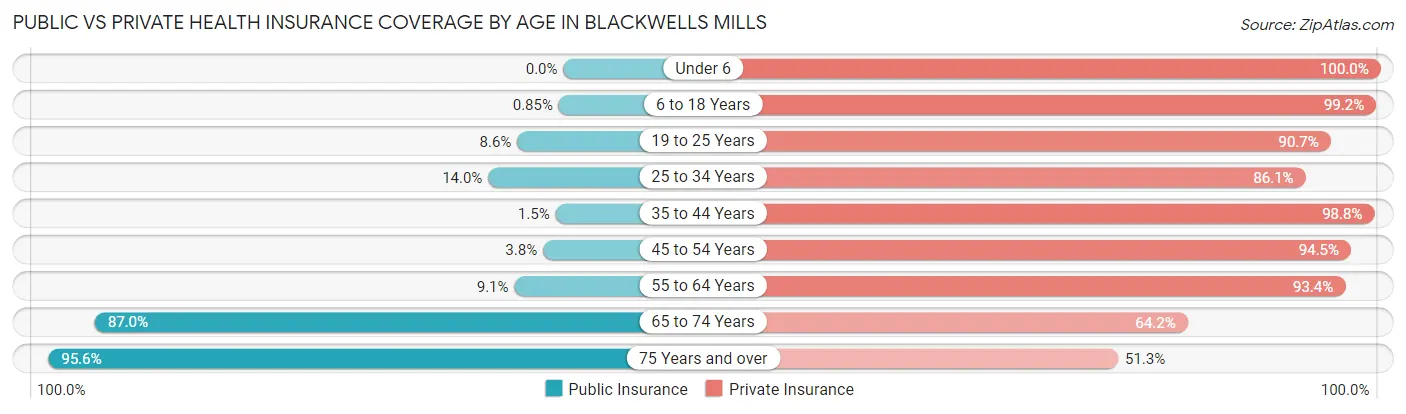
| Age Bracket | Public Insurance | Private Insurance |
| Under 6 | 0 (0.0%) | 651 (100.0%) |
| 6 to 18 Years | 18 (0.9%) | 2,092 (99.2%) |
| 19 to 25 Years | 74 (8.6%) | 783 (90.7%) |
| 25 to 34 Years | 89 (14.0%) | 549 (86.1%) |
| 35 to 44 Years | 21 (1.5%) | 1,420 (98.8%) |
| 45 to 54 Years | 48 (3.8%) | 1,199 (94.5%) |
| 55 to 64 Years | 157 (9.1%) | 1,613 (93.4%) |
| 65 to 74 Years | 801 (87.0%) | 591 (64.2%) |
| 75 Years and over | 412 (95.6%) | 221 (51.3%) |
| Total | 1,620 (16.1%) | 9,119 (90.8%) |
Disability Status by Sex by Age in Blackwells Mills
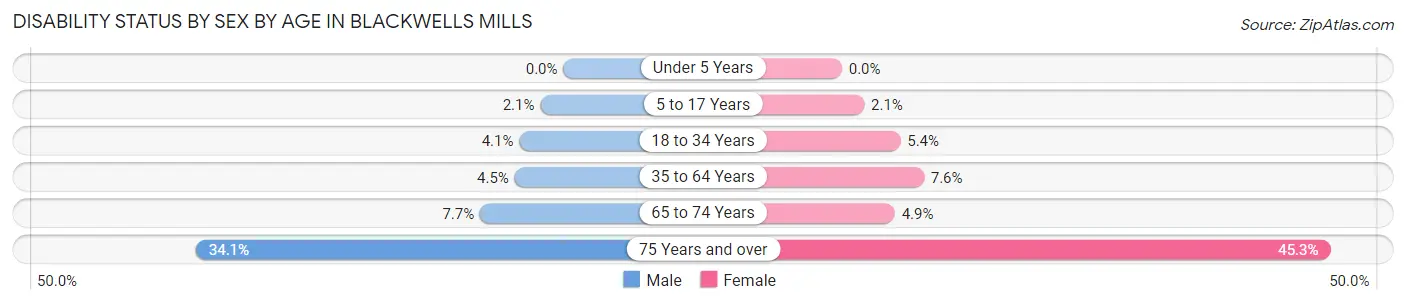
| Age Bracket | Male | Female |
| Under 5 Years | 0 (0.0%) | 0 (0.0%) |
| 5 to 17 Years | 22 (2.1%) | 20 (2.1%) |
| 18 to 34 Years | 32 (4.1%) | 49 (5.4%) |
| 35 to 64 Years | 100 (4.5%) | 169 (7.6%) |
| 65 to 74 Years | 35 (7.7%) | 23 (4.9%) |
| 75 Years and over | 74 (34.1%) | 97 (45.3%) |
Disability Class by Sex by Age in Blackwells Mills
Disability Class: Hearing Difficulty
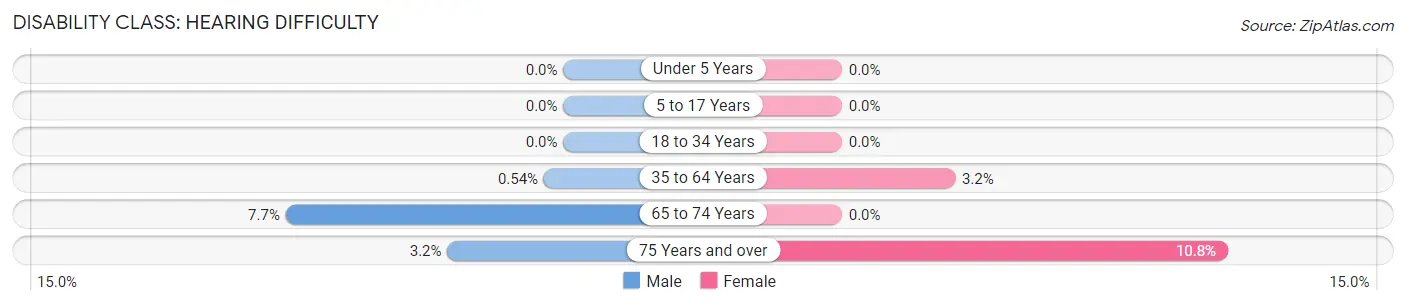
| Age Bracket | Male | Female |
| Under 5 Years | 0 (0.0%) | 0 (0.0%) |
| 5 to 17 Years | 0 (0.0%) | 0 (0.0%) |
| 18 to 34 Years | 0 (0.0%) | 0 (0.0%) |
| 35 to 64 Years | 12 (0.5%) | 70 (3.2%) |
| 65 to 74 Years | 35 (7.7%) | 0 (0.0%) |
| 75 Years and over | 7 (3.2%) | 23 (10.7%) |
Disability Class: Vision Difficulty
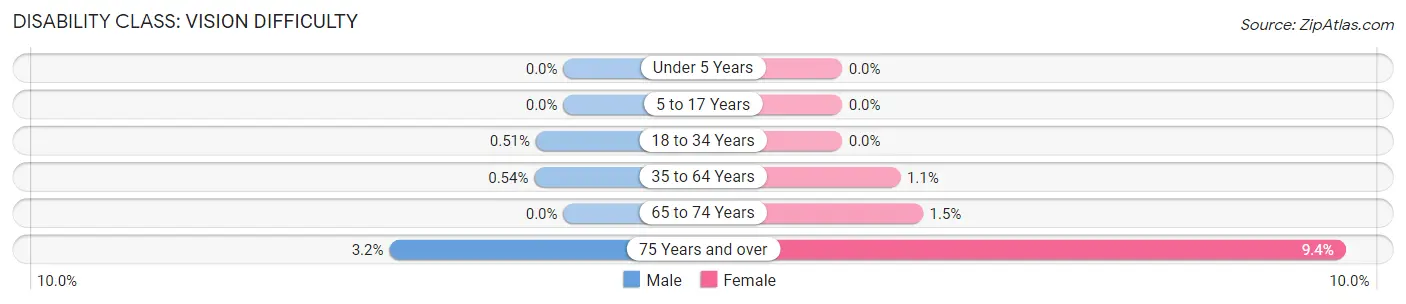
| Age Bracket | Male | Female |
| Under 5 Years | 0 (0.0%) | 0 (0.0%) |
| 5 to 17 Years | 0 (0.0%) | 0 (0.0%) |
| 18 to 34 Years | 4 (0.5%) | 0 (0.0%) |
| 35 to 64 Years | 12 (0.5%) | 24 (1.1%) |
| 65 to 74 Years | 0 (0.0%) | 7 (1.5%) |
| 75 Years and over | 7 (3.2%) | 20 (9.3%) |
Disability Class: Cognitive Difficulty
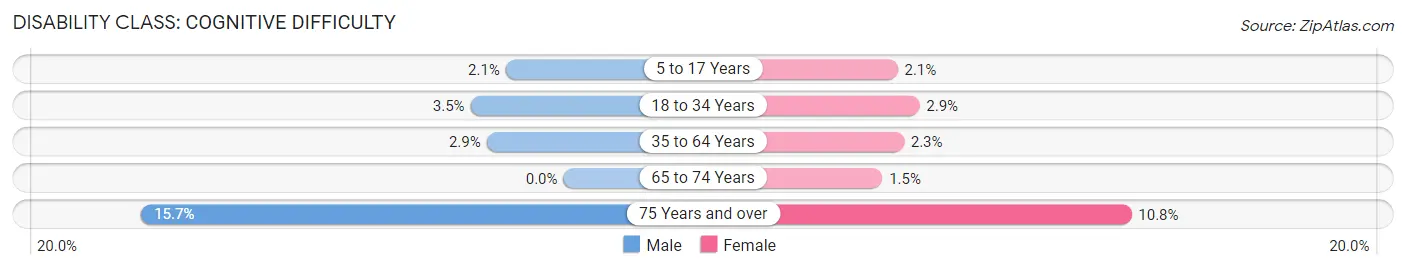
| Age Bracket | Male | Female |
| 5 to 17 Years | 22 (2.1%) | 20 (2.1%) |
| 18 to 34 Years | 27 (3.5%) | 26 (2.9%) |
| 35 to 64 Years | 63 (2.9%) | 51 (2.3%) |
| 65 to 74 Years | 0 (0.0%) | 7 (1.5%) |
| 75 Years and over | 34 (15.7%) | 23 (10.7%) |
Disability Class: Ambulatory Difficulty
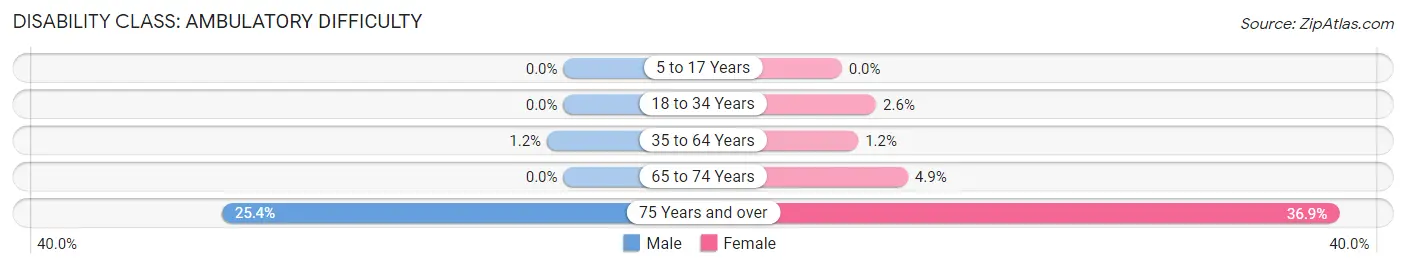
| Age Bracket | Male | Female |
| 5 to 17 Years | 0 (0.0%) | 0 (0.0%) |
| 18 to 34 Years | 0 (0.0%) | 23 (2.5%) |
| 35 to 64 Years | 27 (1.2%) | 27 (1.2%) |
| 65 to 74 Years | 0 (0.0%) | 23 (4.9%) |
| 75 Years and over | 55 (25.4%) | 79 (36.9%) |
Disability Class: Self-Care Difficulty
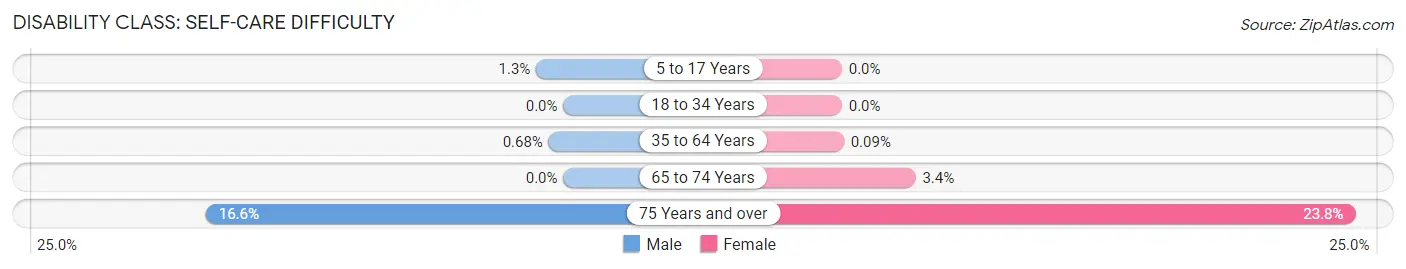
| Age Bracket | Male | Female |
| 5 to 17 Years | 13 (1.3%) | 0 (0.0%) |
| 18 to 34 Years | 0 (0.0%) | 0 (0.0%) |
| 35 to 64 Years | 15 (0.7%) | 2 (0.1%) |
| 65 to 74 Years | 0 (0.0%) | 16 (3.4%) |
| 75 Years and over | 36 (16.6%) | 51 (23.8%) |
Technology Access in Blackwells Mills
Computing Device Access in Blackwells Mills
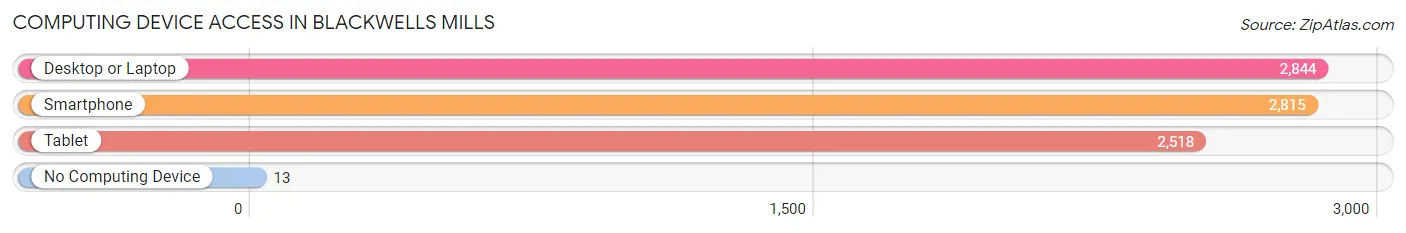
| Device Type | # Households | % Households |
| Desktop or Laptop | 2,844 | 99.1% |
| Smartphone | 2,815 | 98.1% |
| Tablet | 2,518 | 87.7% |
| No Computing Device | 13 | 0.4% |
| Total | 2,871 | 100.0% |
Internet Access in Blackwells Mills
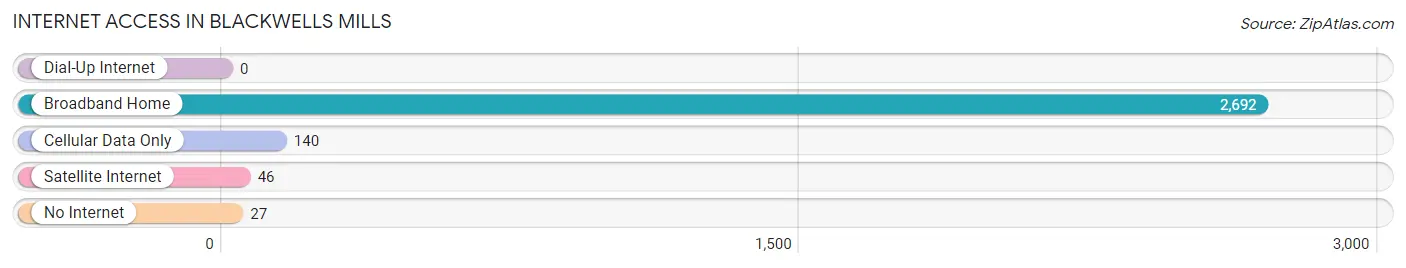
| Internet Type | # Households | % Households |
| Dial-Up Internet | 0 | 0.0% |
| Broadband Home | 2,692 | 93.8% |
| Cellular Data Only | 140 | 4.9% |
| Satellite Internet | 46 | 1.6% |
| No Internet | 27 | 0.9% |
| Total | 2,871 | 100.0% |
Blackwells Mills Summary
Blackwells Mills is an unincorporated community located in Franklin Township, Somerset County, New Jersey. It is situated along the Millstone River, which is a tributary of the Raritan River. The community is located near the border of Hunterdon County and is approximately 10 miles south of Somerville.
History
Blackwells Mills was first settled in the late 1700s by the Blackwell family, who were of English descent. The family owned a grist mill and a saw mill, which were powered by the Millstone River. The mills were used to grind grain and saw lumber for the local community. The mills were in operation until the early 1900s.
In the late 1800s, the Blackwells Mills area was home to a number of small farms. The farms produced a variety of crops, including corn, wheat, oats, and hay. The area was also home to a number of small businesses, including a blacksmith shop, a general store, and a post office.
Geography
Blackwells Mills is located in Franklin Township, Somerset County, New Jersey. It is situated along the Millstone River, which is a tributary of the Raritan River. The community is located near the border of Hunterdon County and is approximately 10 miles south of Somerville.
The area is mostly rural, with a few small residential neighborhoods. The terrain is mostly flat, with some rolling hills. The climate is temperate, with hot summers and cold winters.
Economy
The economy of Blackwells Mills is largely based on agriculture. The area is home to a number of small farms, which produce a variety of crops, including corn, wheat, oats, and hay. The area is also home to a number of small businesses, including a blacksmith shop, a general store, and a post office.
Demographics
As of the 2010 census, the population of Blackwells Mills was 1,845. The racial makeup of the community was 94.3% White, 2.2% African American, 0.3% Native American, 0.7% Asian, and 2.5% from other races. The median household income was $76,250, and the median family income was $87,500. The per capita income was $30,945.
Conclusion
Blackwells Mills is an unincorporated community located in Franklin Township, Somerset County, New Jersey. It is situated along the Millstone River, which is a tributary of the Raritan River. The community was first settled in the late 1700s by the Blackwell family, who owned a grist mill and a saw mill. The area is mostly rural, with a few small residential neighborhoods. The economy of Blackwells Mills is largely based on agriculture, with a number of small farms producing a variety of crops. As of the 2010 census, the population of Blackwells Mills was 1,845. The racial makeup of the community was 94.3% White, 2.2% African American, 0.3% Native American, 0.7% Asian, and 2.5% from other races. The median household income was $76,250, and the median family income was $87,500.
Common Questions
What is the Total Population of Blackwells Mills?
Total Population of Blackwells Mills is 10,047.
What is the Total Male Population of Blackwells Mills?
Total Male Population of Blackwells Mills is 5,004.
What is the Total Female Population of Blackwells Mills?
Total Female Population of Blackwells Mills is 5,043.
What is the Ratio of Males per 100 Females in Blackwells Mills?
There are 99.23 Males per 100 Females in Blackwells Mills.
What is the Ratio of Females per 100 Males in Blackwells Mills?
There are 100.78 Females per 100 Males in Blackwells Mills.
What is the Median Population Age in Blackwells Mills?
Median Population Age in Blackwells Mills is 41.3 Years.
What is the Average Family Size in Blackwells Mills
Average Family Size in Blackwells Mills is 3.7 People.
What is the Average Household Size in Blackwells Mills
Average Household Size in Blackwells Mills is 3.5 People.
What is Per Capita Income in Blackwells Mills?
Per Capita income in Blackwells Mills is $79,581.
What is the Median Family Income in Blackwells Mills?
Median Family Income in Blackwells Mills is $243,854.
What is the Median Household income in Blackwells Mills?
Median Household Income in Blackwells Mills is $233,516.
What is Income or Wage Gap in Blackwells Mills?
Income or Wage Gap in Blackwells Mills is 58.7%.
Women in Blackwells Mills earn 41.3 cents for every dollar earned by a man.
What is Inequality or Gini Index in Blackwells Mills?
Inequality or Gini Index in Blackwells Mills is 0.34.
How Large is the Labor Force in Blackwells Mills?
There are 5,412 People in the Labor Forcein in Blackwells Mills.
What is the Percentage of People in the Labor Force in Blackwells Mills?
69.4% of People are in the Labor Force in Blackwells Mills.
What is the Unemployment Rate in Blackwells Mills?
Unemployment Rate in Blackwells Mills is 5.2%.