Cities with the Largest Asian Community in Mississippi
RELATED REPORTS & OPTIONS
Asian
Mississippi
Compare Cities
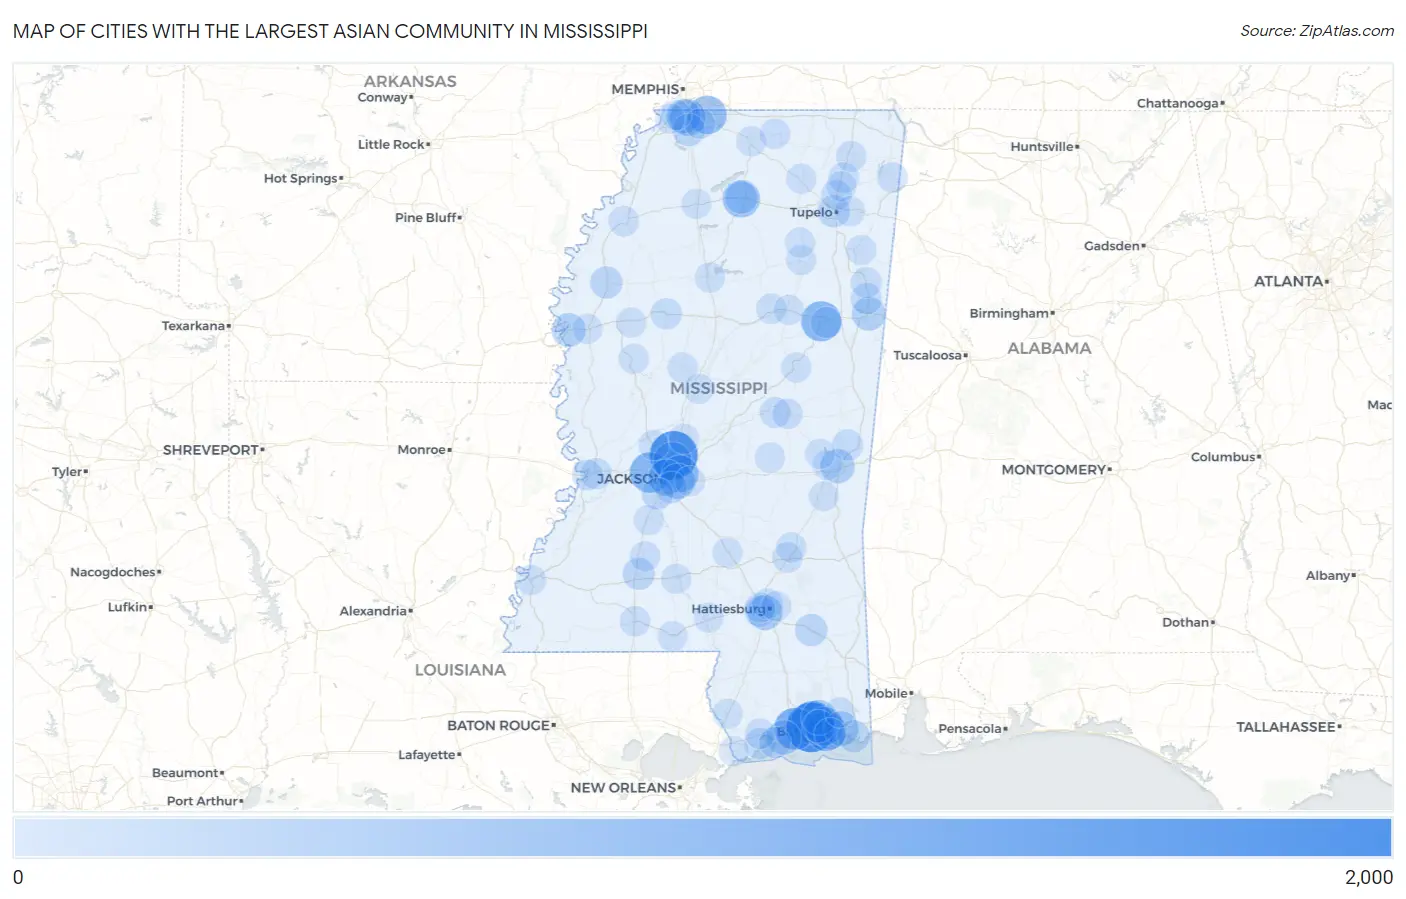
Map of Cities with the Largest Asian Community in Mississippi
0
2,000
Cities with the Largest Asian Community in Mississippi
| City | Asian | vs State | vs National | |
| 1. | Biloxi | 1,823 | 29,041(6.28%)#1 | 19,112,979(0.01%)#1,305 |
| 2. | Madison | 1,661 | 29,041(5.72%)#2 | 19,112,979(0.01%)#1,387 |
| 3. | D Iberville | 1,177 | 29,041(4.05%)#3 | 19,112,979(0.01%)#1,734 |
| 4. | Gulfport | 1,090 | 29,041(3.75%)#4 | 19,112,979(0.01%)#1,829 |
| 5. | Clinton | 955 | 29,041(3.29%)#5 | 19,112,979(0.00%)#1,977 |
| 6. | Starkville | 923 | 29,041(3.18%)#6 | 19,112,979(0.00%)#2,023 |
| 7. | Ocean Springs | 885 | 29,041(3.05%)#7 | 19,112,979(0.00%)#2,072 |
| 8. | Gulf Hills | 804 | 29,041(2.77%)#8 | 19,112,979(0.00%)#2,196 |
| 9. | Ridgeland | 759 | 29,041(2.61%)#9 | 19,112,979(0.00%)#2,259 |
| 10. | Olive Branch | 756 | 29,041(2.60%)#10 | 19,112,979(0.00%)#2,268 |
| 11. | Oxford | 662 | 29,041(2.28%)#11 | 19,112,979(0.00%)#2,451 |
| 12. | Flowood | 641 | 29,041(2.21%)#12 | 19,112,979(0.00%)#2,495 |
| 13. | Southaven | 585 | 29,041(2.01%)#13 | 19,112,979(0.00%)#2,622 |
| 14. | Jackson | 545 | 29,041(1.88%)#14 | 19,112,979(0.00%)#2,723 |
| 15. | Pearl | 483 | 29,041(1.66%)#15 | 19,112,979(0.00%)#2,913 |
| 16. | Hattiesburg | 461 | 29,041(1.59%)#16 | 19,112,979(0.00%)#2,993 |
| 17. | Latimer | 455 | 29,041(1.57%)#17 | 19,112,979(0.00%)#3,018 |
| 18. | Gautier | 419 | 29,041(1.44%)#18 | 19,112,979(0.00%)#3,151 |
| 19. | Long Beach | 385 | 29,041(1.33%)#19 | 19,112,979(0.00%)#3,314 |
| 20. | Meridian | 381 | 29,041(1.31%)#20 | 19,112,979(0.00%)#3,335 |
| 21. | Horn Lake | 374 | 29,041(1.29%)#21 | 19,112,979(0.00%)#3,368 |
| 22. | Columbus | 350 | 29,041(1.21%)#22 | 19,112,979(0.00%)#3,486 |
| 23. | Greenville | 345 | 29,041(1.19%)#23 | 19,112,979(0.00%)#3,512 |
| 24. | St Martin | 241 | 29,041(0.83%)#24 | 19,112,979(0.00%)#4,141 |
| 25. | Gluckstadt | 234 | 29,041(0.81%)#25 | 19,112,979(0.00%)#4,201 |
| 26. | Hernando | 228 | 29,041(0.79%)#26 | 19,112,979(0.00%)#4,250 |
| 27. | University | 212 | 29,041(0.73%)#27 | 19,112,979(0.00%)#4,379 |
| 28. | Beaumont | 206 | 29,041(0.71%)#28 | 19,112,979(0.00%)#4,438 |
| 29. | Cleveland | 201 | 29,041(0.69%)#29 | 19,112,979(0.00%)#4,479 |
| 30. | Tupelo | 196 | 29,041(0.67%)#30 | 19,112,979(0.00%)#4,536 |
| 31. | Pascagoula | 194 | 29,041(0.67%)#31 | 19,112,979(0.00%)#4,559 |
| 32. | Brookhaven | 177 | 29,041(0.61%)#32 | 19,112,979(0.00%)#4,733 |
| 33. | Richland | 152 | 29,041(0.52%)#33 | 19,112,979(0.00%)#5,052 |
| 34. | Byram | 148 | 29,041(0.51%)#34 | 19,112,979(0.00%)#5,095 |
| 35. | Gulf Park Estates | 134 | 29,041(0.46%)#35 | 19,112,979(0.00%)#5,293 |
| 36. | Bay St Louis | 121 | 29,041(0.42%)#36 | 19,112,979(0.00%)#5,491 |
| 37. | West Hattiesburg | 113 | 29,041(0.39%)#37 | 19,112,979(0.00%)#5,631 |
| 38. | Pass Christian | 105 | 29,041(0.36%)#38 | 19,112,979(0.00%)#5,773 |
| 39. | Meridian Station | 101 | 29,041(0.35%)#39 | 19,112,979(0.00%)#5,854 |
| 40. | Mississippi State | 96 | 29,041(0.33%)#40 | 19,112,979(0.00%)#5,939 |
| 41. | Greenwood | 95 | 29,041(0.33%)#41 | 19,112,979(0.00%)#5,950 |
| 42. | Beechwood | 93 | 29,041(0.32%)#42 | 19,112,979(0.00%)#6,009 |
| 43. | Columbus Afb | 93 | 29,041(0.32%)#43 | 19,112,979(0.00%)#6,019 |
| 44. | New Hamilton | 81 | 29,041(0.28%)#44 | 19,112,979(0.00%)#6,302 |
| 45. | Pearl River | 69 | 29,041(0.24%)#45 | 19,112,979(0.00%)#6,641 |
| 46. | Vicksburg | 67 | 29,041(0.23%)#46 | 19,112,979(0.00%)#6,691 |
| 47. | Booneville | 54 | 29,041(0.19%)#47 | 19,112,979(0.00%)#7,200 |
| 48. | Diamondhead | 51 | 29,041(0.18%)#48 | 19,112,979(0.00%)#7,315 |
| 49. | Baldwyn | 45 | 29,041(0.15%)#49 | 19,112,979(0.00%)#7,624 |
| 50. | Glendale | 43 | 29,041(0.15%)#50 | 19,112,979(0.00%)#7,747 |
| 51. | Lakeview | 41 | 29,041(0.14%)#51 | 19,112,979(0.00%)#7,848 |
| 52. | Clarksdale | 40 | 29,041(0.14%)#52 | 19,112,979(0.00%)#7,855 |
| 53. | Philadelphia | 39 | 29,041(0.13%)#53 | 19,112,979(0.00%)#7,929 |
| 54. | Saltillo | 39 | 29,041(0.13%)#54 | 19,112,979(0.00%)#7,935 |
| 55. | Laurel | 36 | 29,041(0.12%)#55 | 19,112,979(0.00%)#8,083 |
| 56. | Mccomb | 33 | 29,041(0.11%)#56 | 19,112,979(0.00%)#8,290 |
| 57. | Bridgetown | 31 | 29,041(0.11%)#57 | 19,112,979(0.00%)#8,466 |
| 58. | Flora | 31 | 29,041(0.11%)#58 | 19,112,979(0.00%)#8,472 |
| 59. | Belmont | 30 | 29,041(0.10%)#59 | 19,112,979(0.00%)#8,544 |
| 60. | Snow Lake Shores | 30 | 29,041(0.10%)#60 | 19,112,979(0.00%)#8,588 |
| 61. | Eupora | 29 | 29,041(0.10%)#61 | 19,112,979(0.00%)#8,643 |
| 62. | Beauregard | 28 | 29,041(0.10%)#62 | 19,112,979(0.00%)#8,763 |
| 63. | Brandon | 23 | 29,041(0.08%)#63 | 19,112,979(0.00%)#9,152 |
| 64. | New Albany | 23 | 29,041(0.08%)#64 | 19,112,979(0.00%)#9,161 |
| 65. | Tylertown | 23 | 29,041(0.08%)#65 | 19,112,979(0.00%)#9,203 |
| 66. | Lexington | 22 | 29,041(0.08%)#66 | 19,112,979(0.00%)#9,331 |
| 67. | Grenada | 21 | 29,041(0.07%)#67 | 19,112,979(0.00%)#9,373 |
| 68. | Canton | 20 | 29,041(0.07%)#68 | 19,112,979(0.00%)#9,485 |
| 69. | Pearlington | 20 | 29,041(0.07%)#69 | 19,112,979(0.00%)#9,569 |
| 70. | Louisville | 19 | 29,041(0.07%)#70 | 19,112,979(0.00%)#9,599 |
| 71. | Houston | 18 | 29,041(0.06%)#71 | 19,112,979(0.00%)#9,743 |
| 72. | Sharon | 18 | 29,041(0.06%)#72 | 19,112,979(0.00%)#9,783 |
| 73. | Nellieburg | 18 | 29,041(0.06%)#73 | 19,112,979(0.00%)#9,802 |
| 74. | Monticello | 18 | 29,041(0.06%)#74 | 19,112,979(0.00%)#9,803 |
| 75. | Bolivar | 18 | 29,041(0.06%)#75 | 19,112,979(0.00%)#9,844 |
| 76. | Crystal Springs | 17 | 29,041(0.06%)#76 | 19,112,979(0.00%)#9,866 |
| 77. | Arnold Line | 17 | 29,041(0.06%)#77 | 19,112,979(0.00%)#9,916 |
| 78. | Mount Olive | 17 | 29,041(0.06%)#78 | 19,112,979(0.00%)#9,935 |
| 79. | Mathiston | 17 | 29,041(0.06%)#79 | 19,112,979(0.00%)#9,968 |
| 80. | Vancleave | 16 | 29,041(0.06%)#80 | 19,112,979(0.00%)#10,030 |
| 81. | Guntown | 16 | 29,041(0.06%)#81 | 19,112,979(0.00%)#10,066 |
| 82. | Collinsville | 14 | 29,041(0.05%)#82 | 19,112,979(0.00%)#10,376 |
| 83. | Amory | 13 | 29,041(0.04%)#83 | 19,112,979(0.00%)#10,470 |
| 84. | Leland | 13 | 29,041(0.04%)#84 | 19,112,979(0.00%)#10,496 |
| 85. | Belzoni | 13 | 29,041(0.04%)#85 | 19,112,979(0.00%)#10,543 |
| 86. | Mooreville | 13 | 29,041(0.04%)#86 | 19,112,979(0.00%)#10,548 |
| 87. | Enterprise | 13 | 29,041(0.04%)#87 | 19,112,979(0.00%)#10,617 |
| 88. | Picayune | 12 | 29,041(0.04%)#88 | 19,112,979(0.00%)#10,648 |
| 89. | New Houlka | 12 | 29,041(0.04%)#89 | 19,112,979(0.00%)#10,801 |
| 90. | Batesville | 11 | 29,041(0.04%)#90 | 19,112,979(0.00%)#10,840 |
| 91. | Goodman | 11 | 29,041(0.04%)#91 | 19,112,979(0.00%)#10,944 |
| 92. | Hermanville | 11 | 29,041(0.04%)#92 | 19,112,979(0.00%)#11,013 |
| 93. | Natchez | 10 | 29,041(0.03%)#93 | 19,112,979(0.00%)#11,048 |
| 94. | Holly Springs | 10 | 29,041(0.03%)#94 | 19,112,979(0.00%)#11,062 |
| 95. | Walls | 10 | 29,041(0.03%)#95 | 19,112,979(0.00%)#11,163 |
| 96. | Conehatta | 10 | 29,041(0.03%)#96 | 19,112,979(0.00%)#11,177 |
| 97. | Petal | 9 | 29,041(0.03%)#97 | 19,112,979(0.00%)#11,276 |
| 98. | Columbia | 9 | 29,041(0.03%)#98 | 19,112,979(0.00%)#11,286 |
| 99. | Lynchburg | 9 | 29,041(0.03%)#99 | 19,112,979(0.00%)#11,350 |
| 100. | Moorhead | 9 | 29,041(0.03%)#100 | 19,112,979(0.00%)#11,377 |
Common Questions
What are the Top 10 Cities with the Largest Asian Community in Mississippi?
Top 10 Cities with the Largest Asian Community in Mississippi are:
#1
1,823
#2
1,661
#3
1,177
#4
1,090
#5
955
#6
923
#7
885
#8
804
#9
759
#10
756
What city has the Largest Asian Community in Mississippi?
Biloxi has the Largest Asian Community in Mississippi with 1,823.
What is the Total Asian Population in the State of Mississippi?
Total Asian Population in Mississippi is 29,041.
What is the Total Asian Population in the United States?
Total Asian Population in the United States is 19,112,979.