Sawmills, NC
Sawmills Map
Sawmills Overview
5,026
TOTAL POPULATION
2,921
MALE POPULATION
2,105
FEMALE POPULATION
138.76
MALES / 100 FEMALES
72.06
FEMALES / 100 MALES
47.5
MEDIAN AGE
3.0
AVG FAMILY SIZE
2.6
AVG HOUSEHOLD SIZE
$28,858
PER CAPITA INCOME
$81,518
AVG FAMILY INCOME
$63,388
AVG HOUSEHOLD INCOME
6.5%
WAGE / INCOME GAP [ % ]
93.5¢/ $1
WAGE / INCOME GAP [ $ ]
$11,458
FAMILY INCOME DEFICIT
0.43
INEQUALITY / GINI INDEX
2,569
LABOR FORCE [ PEOPLE ]
58.3%
PERCENT IN LABOR FORCE
8.0%
UNEMPLOYMENT RATE
Sawmills Area Codes
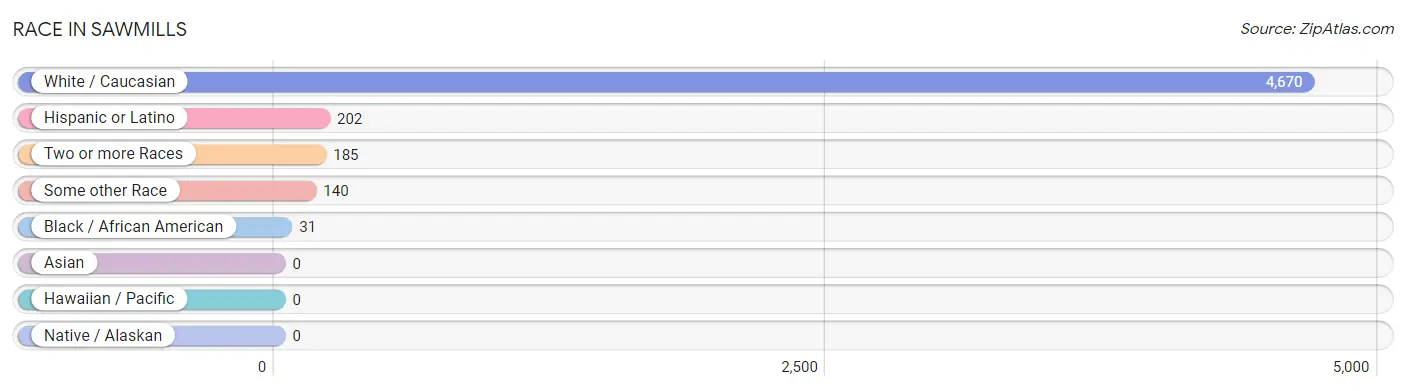
Race in Sawmills
The most populous races in Sawmills are White / Caucasian (4,670 | 92.9%), Hispanic or Latino (202 | 4.0%), and Two or more Races (185 | 3.7%).
| Race | # Population | % Population |
| Asian | 0 | 0.0% |
| Black / African American | 31 | 0.6% |
| Hawaiian / Pacific | 0 | 0.0% |
| Hispanic or Latino | 202 | 4.0% |
| Native / Alaskan | 0 | 0.0% |
| White / Caucasian | 4,670 | 92.9% |
| Two or more Races | 185 | 3.7% |
| Some other Race | 140 | 2.8% |
| Total | 5,026 | 100.0% |
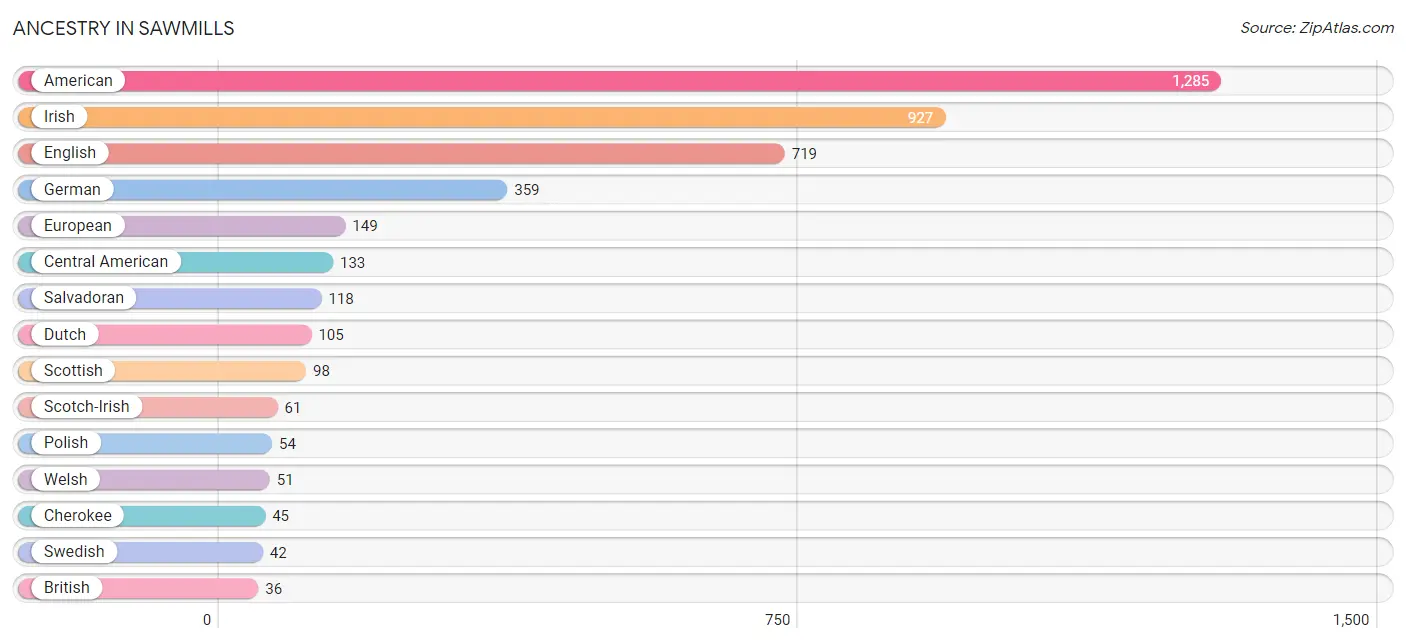
Ancestry in Sawmills
The most populous ancestries reported in Sawmills are American (1,285 | 25.6%), Irish (927 | 18.4%), English (719 | 14.3%), German (359 | 7.1%), and European (149 | 3.0%), together accounting for 68.4% of all Sawmills residents.
| Ancestry | # Population | % Population |
| American | 1,285 | 25.6% |
| British | 36 | 0.7% |
| Central American | 133 | 2.6% |
| Cherokee | 45 | 0.9% |
| Czech | 8 | 0.2% |
| Dutch | 105 | 2.1% |
| English | 719 | 14.3% |
| European | 149 | 3.0% |
| German | 359 | 7.1% |
| Honduran | 15 | 0.3% |
| Hungarian | 16 | 0.3% |
| Irish | 927 | 18.4% |
| Italian | 26 | 0.5% |
| Korean | 17 | 0.3% |
| Mexican | 22 | 0.4% |
| Pennsylvania German | 15 | 0.3% |
| Polish | 54 | 1.1% |
| Puerto Rican | 22 | 0.4% |
| Salvadoran | 118 | 2.4% |
| Scandinavian | 11 | 0.2% |
| Scotch-Irish | 61 | 1.2% |
| Scottish | 98 | 1.9% |
| South American | 6 | 0.1% |
| Spanish | 5 | 0.1% |
| Swedish | 42 | 0.8% |
| Venezuelan | 6 | 0.1% |
| Welsh | 51 | 1.0% | View All 27 Rows |
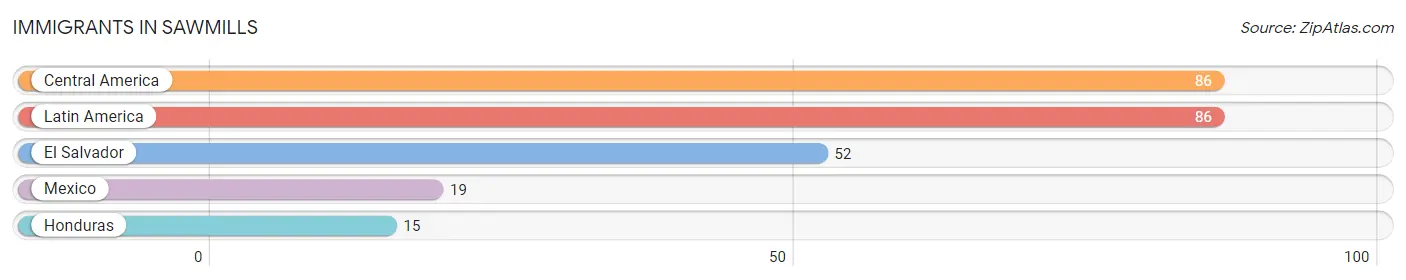
Immigrants in Sawmills
The most numerous immigrant groups reported in Sawmills came from Central America (86 | 1.7%), Latin America (86 | 1.7%), El Salvador (52 | 1.0%), Mexico (19 | 0.4%), and Honduras (15 | 0.3%), together accounting for 5.1% of all Sawmills residents.
| Immigration Origin | # Population | % Population |
| Central America | 86 | 1.7% |
| El Salvador | 52 | 1.0% |
| Honduras | 15 | 0.3% |
| Latin America | 86 | 1.7% |
| Mexico | 19 | 0.4% | View All 5 Rows |
Sex and Age in Sawmills
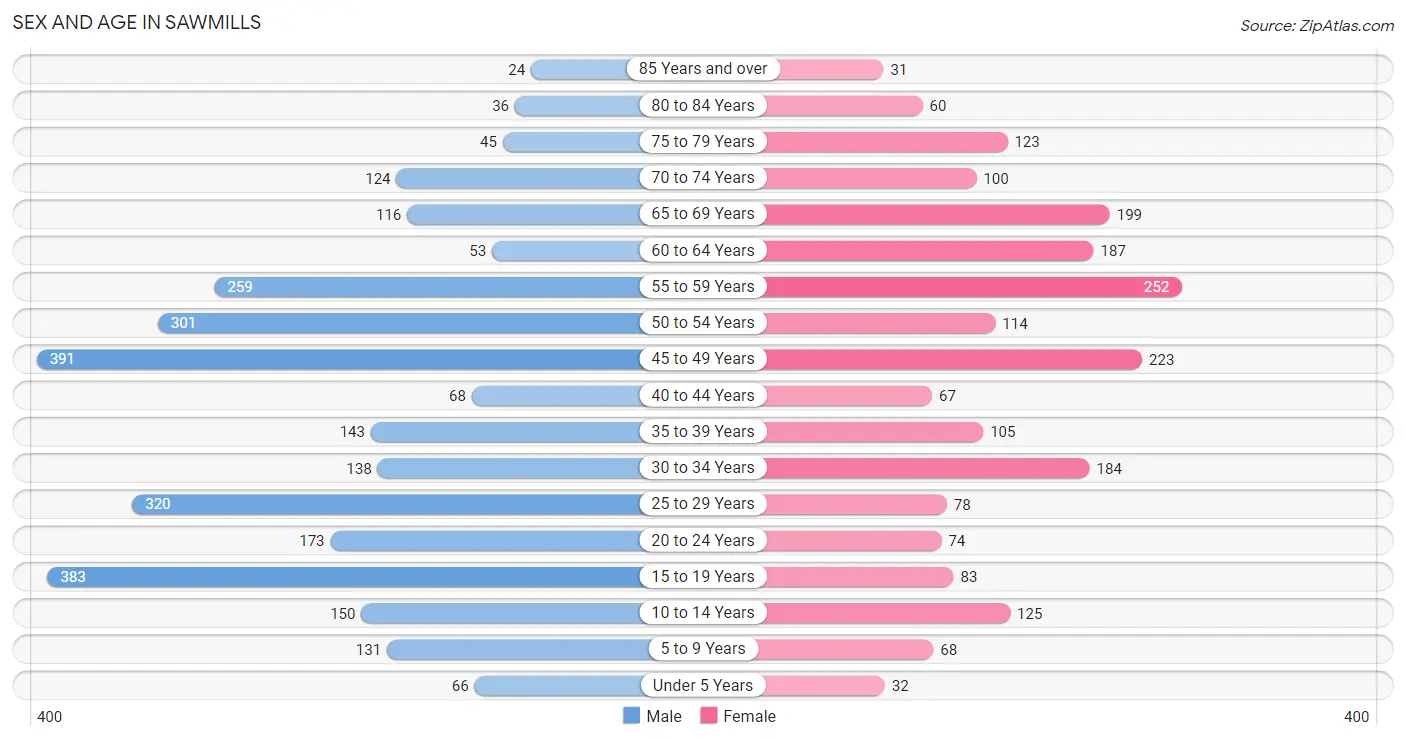
Sex and Age in Sawmills
The most populous age groups in Sawmills are 45 to 49 Years (391 | 13.4%) for men and 55 to 59 Years (252 | 12.0%) for women.
| Age Bracket | Male | Female |
| Under 5 Years | 66 (2.3%) | 32 (1.5%) |
| 5 to 9 Years | 131 (4.5%) | 68 (3.2%) |
| 10 to 14 Years | 150 (5.1%) | 125 (5.9%) |
| 15 to 19 Years | 383 (13.1%) | 83 (3.9%) |
| 20 to 24 Years | 173 (5.9%) | 74 (3.5%) |
| 25 to 29 Years | 320 (11.0%) | 78 (3.7%) |
| 30 to 34 Years | 138 (4.7%) | 184 (8.7%) |
| 35 to 39 Years | 143 (4.9%) | 105 (5.0%) |
| 40 to 44 Years | 68 (2.3%) | 67 (3.2%) |
| 45 to 49 Years | 391 (13.4%) | 223 (10.6%) |
| 50 to 54 Years | 301 (10.3%) | 114 (5.4%) |
| 55 to 59 Years | 259 (8.9%) | 252 (12.0%) |
| 60 to 64 Years | 53 (1.8%) | 187 (8.9%) |
| 65 to 69 Years | 116 (4.0%) | 199 (9.5%) |
| 70 to 74 Years | 124 (4.3%) | 100 (4.8%) |
| 75 to 79 Years | 45 (1.5%) | 123 (5.8%) |
| 80 to 84 Years | 36 (1.2%) | 60 (2.9%) |
| 85 Years and over | 24 (0.8%) | 31 (1.5%) |
| Total | 2,921 (100.0%) | 2,105 (100.0%) |
Families and Households in Sawmills
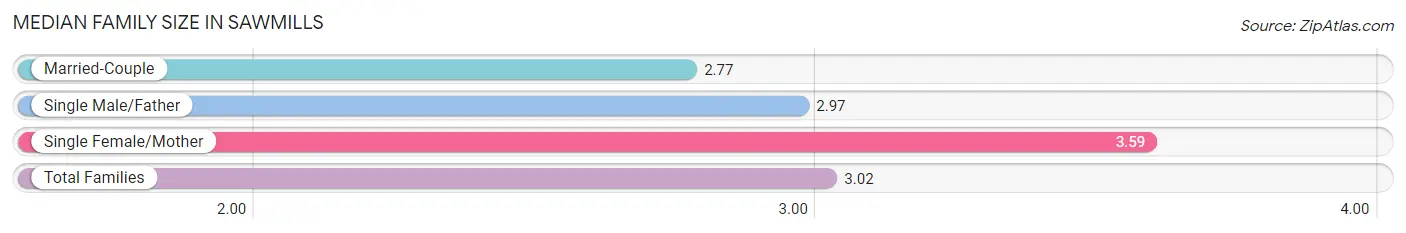
Median Family Size in Sawmills
The median family size in Sawmills is 3.02 persons per family, with single female/mother families (399 | 29.0%) accounting for the largest median family size of 3.59 persons per family. On the other hand, married-couple families (855 | 62.1%) represent the smallest median family size with 2.77 persons per family.
| Family Type | # Families | Family Size |
| Married-Couple | 855 (62.1%) | 2.77 |
| Single Male/Father | 122 (8.9%) | 2.97 |
| Single Female/Mother | 399 (29.0%) | 3.59 |
| Total Families | 1,376 (100.0%) | 3.02 |
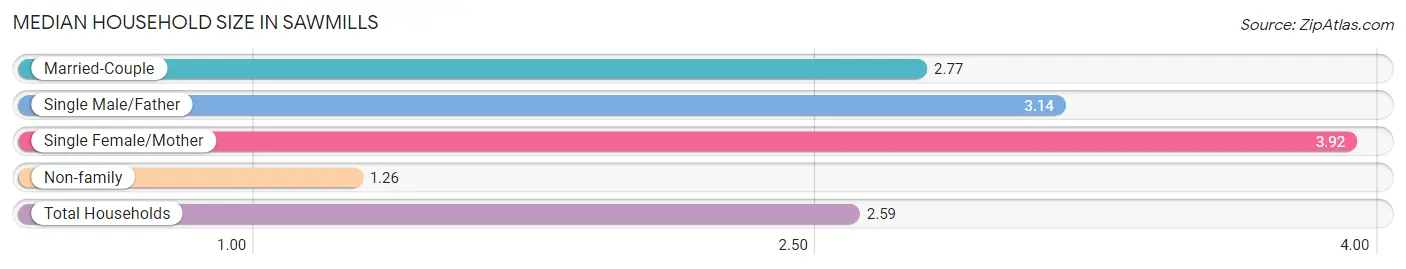
Median Household Size in Sawmills
The median household size in Sawmills is 2.59 persons per household, with single female/mother households (399 | 20.6%) accounting for the largest median household size of 3.92 persons per household. non-family households (565 | 29.1%) represent the smallest median household size with 1.26 persons per household.
| Household Type | # Households | Household Size |
| Married-Couple | 855 (44.1%) | 2.77 |
| Single Male/Father | 122 (6.3%) | 3.14 |
| Single Female/Mother | 399 (20.6%) | 3.92 |
| Non-family | 565 (29.1%) | 1.26 |
| Total Households | 1,941 (100.0%) | 2.59 |
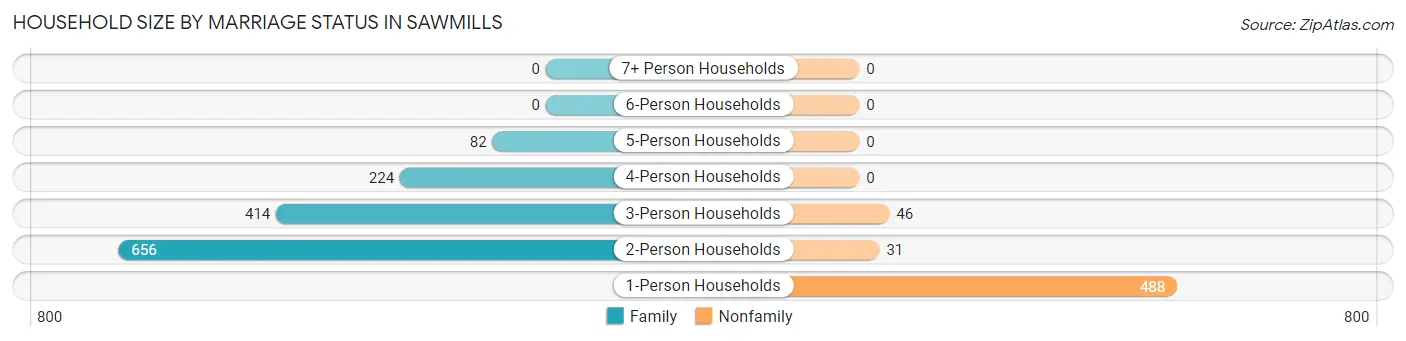
Household Size by Marriage Status in Sawmills
Out of a total of 1,941 households in Sawmills, 1,376 (70.9%) are family households, while 565 (29.1%) are nonfamily households. The most numerous type of family households are 2-person households, comprising 656, and the most common type of nonfamily households are 1-person households, comprising 488.
| Household Size | Family Households | Nonfamily Households |
| 1-Person Households | - | 488 (25.1%) |
| 2-Person Households | 656 (33.8%) | 31 (1.6%) |
| 3-Person Households | 414 (21.3%) | 46 (2.4%) |
| 4-Person Households | 224 (11.5%) | 0 (0.0%) |
| 5-Person Households | 82 (4.2%) | 0 (0.0%) |
| 6-Person Households | 0 (0.0%) | 0 (0.0%) |
| 7+ Person Households | 0 (0.0%) | 0 (0.0%) |
| Total | 1,376 (70.9%) | 565 (29.1%) |
Female Fertility in Sawmills
Fertility by Age in Sawmills
Average fertility rate in Sawmills is 11.0 births per 1,000 women. Women in the age bracket of 20 to 34 years have the highest fertility rate with 18.0 births per 1,000 women. Women in the age bracket of 20 to 34 years acount for 66.7% of all women with births.
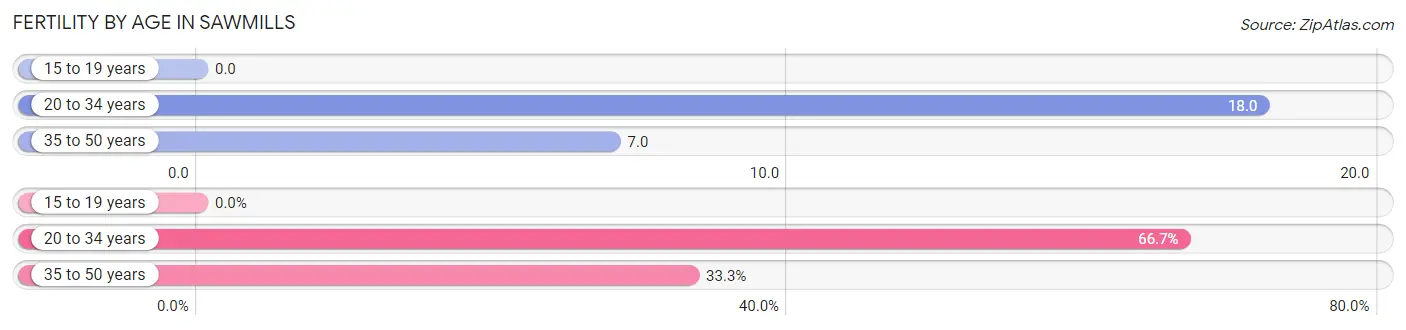
| Age Bracket | Women with Births | Births / 1,000 Women |
| 15 to 19 years | 0 (0.0%) | 0.0 |
| 20 to 34 years | 6 (66.7%) | 18.0 |
| 35 to 50 years | 3 (33.3%) | 7.0 |
| Total | 9 (100.0%) | 11.0 |
Fertility by Age by Marriage Status in Sawmills
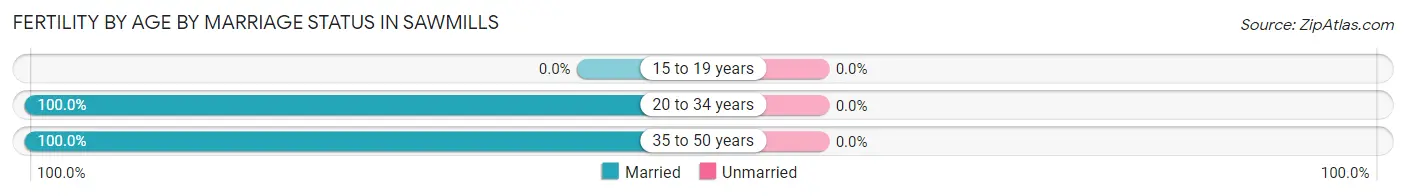
| Age Bracket | Married | Unmarried |
| 15 to 19 years | 0 (0.0%) | 0 (0.0%) |
| 20 to 34 years | 6 (100.0%) | 0 (0.0%) |
| 35 to 50 years | 3 (100.0%) | 0 (0.0%) |
| Total | 9 (100.0%) | 0 (0.0%) |
Fertility by Education in Sawmills
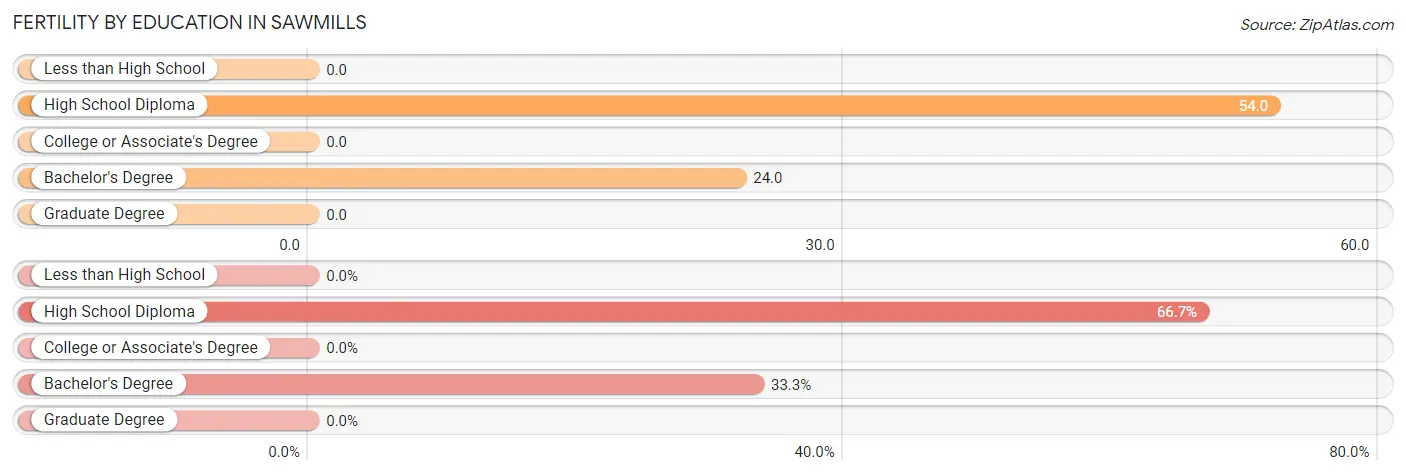
| Educational Attainment | Women with Births | Births / 1,000 Women |
| Less than High School | 0 (0.0%) | 0.0 |
| High School Diploma | 6 (66.7%) | 54.0 |
| College or Associate's Degree | 0 (0.0%) | 0.0 |
| Bachelor's Degree | 3 (33.3%) | 24.0 |
| Graduate Degree | 0 (0.0%) | 0.0 |
| Total | 9 (100.0%) | 11.0 |
Fertility by Education by Marriage Status in Sawmills
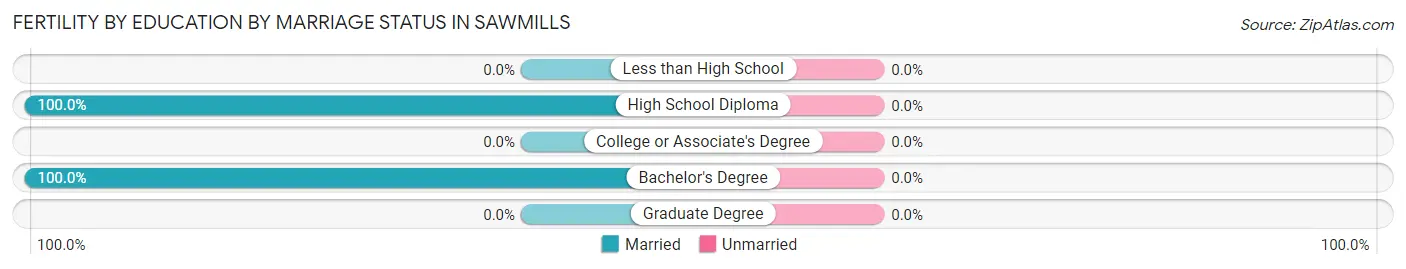
| Educational Attainment | Married | Unmarried |
| Less than High School | 0 (0.0%) | 0 (0.0%) |
| High School Diploma | 6 (100.0%) | 0 (0.0%) |
| College or Associate's Degree | 0 (0.0%) | 0 (0.0%) |
| Bachelor's Degree | 3 (100.0%) | 0 (0.0%) |
| Graduate Degree | 0 (0.0%) | 0 (0.0%) |
| Total | 9 (100.0%) | 0 (0.0%) |
Income in Sawmills
Income Overview in Sawmills
Per Capita Income in Sawmills is $28,858, while median incomes of families and households are $81,518 and $63,388 respectively.
| Characteristic | Number | Measure |
| Per Capita Income | 5,026 | $28,858 |
| Median Family Income | 1,376 | $81,518 |
| Mean Family Income | 1,376 | $81,318 |
| Median Household Income | 1,941 | $63,388 |
| Mean Household Income | 1,941 | $69,880 |
| Income Deficit | 1,376 | $11,458 |
| Wage / Income Gap (%) | 5,026 | 6.45% |
| Wage / Income Gap ($) | 5,026 | 93.55¢ per $1 |
| Gini / Inequality Index | 5,026 | 0.43 |
Earnings by Sex in Sawmills
Average Earnings in Sawmills are $35,427, $34,233 for men and $36,594 for women, a difference of 6.5%.
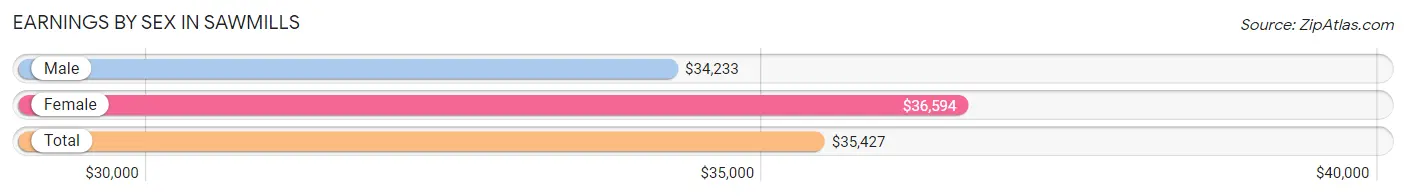
| Sex | Number | Average Earnings |
| Male | 1,598 (57.8%) | $34,233 |
| Female | 1,166 (42.2%) | $36,594 |
| Total | 2,764 (100.0%) | $35,427 |
Earnings by Sex by Income Bracket in Sawmills
The most common earnings brackets in Sawmills are $10,000 to $12,499 for men (269 | 16.8%) and $40,000 to $44,999 for women (148 | 12.7%).
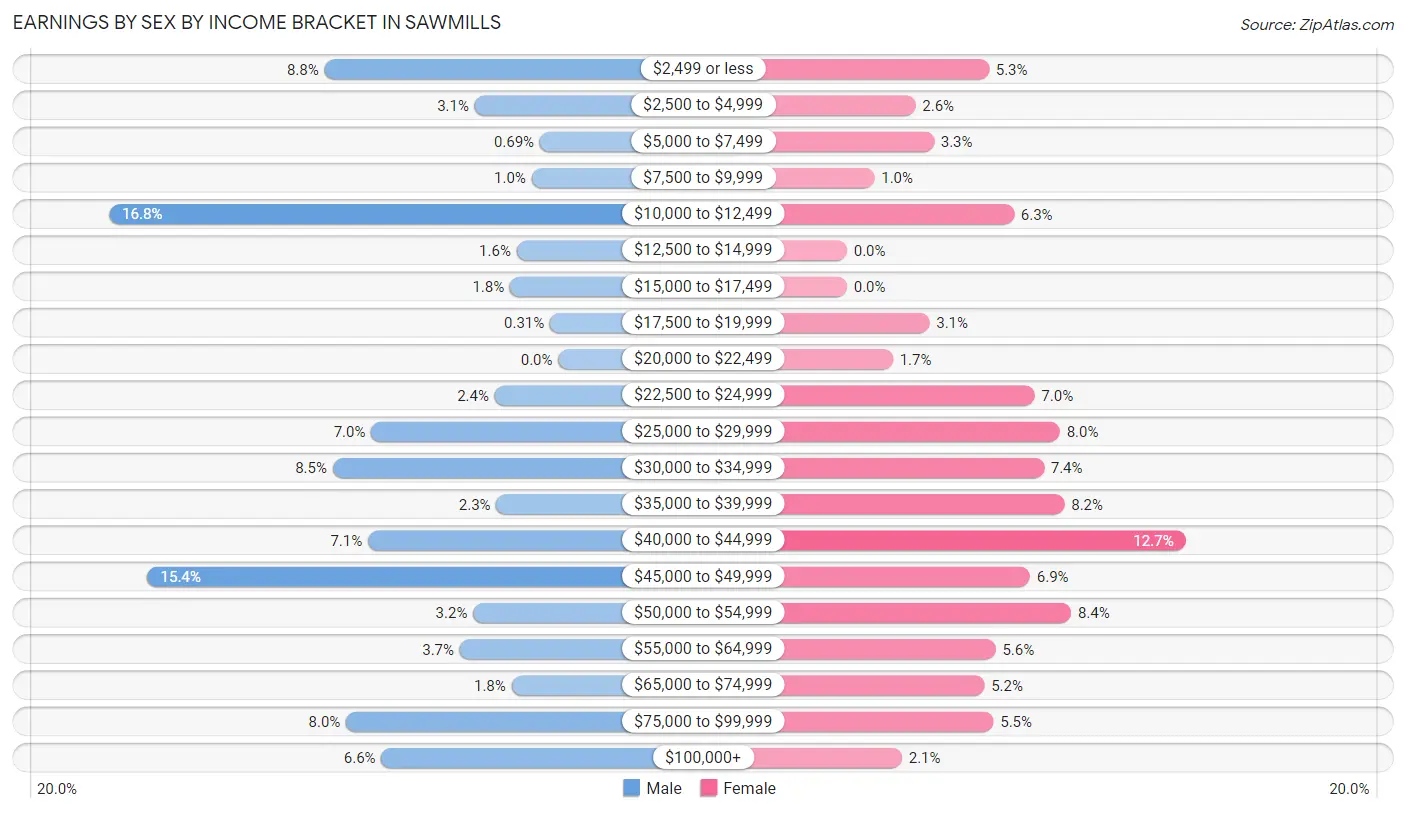
| Income | Male | Female |
| $2,499 or less | 140 (8.8%) | 62 (5.3%) |
| $2,500 to $4,999 | 50 (3.1%) | 30 (2.6%) |
| $5,000 to $7,499 | 11 (0.7%) | 38 (3.3%) |
| $7,500 to $9,999 | 16 (1.0%) | 12 (1.0%) |
| $10,000 to $12,499 | 269 (16.8%) | 73 (6.3%) |
| $12,500 to $14,999 | 25 (1.6%) | 0 (0.0%) |
| $15,000 to $17,499 | 29 (1.8%) | 0 (0.0%) |
| $17,500 to $19,999 | 5 (0.3%) | 36 (3.1%) |
| $20,000 to $22,499 | 0 (0.0%) | 20 (1.7%) |
| $22,500 to $24,999 | 38 (2.4%) | 82 (7.0%) |
| $25,000 to $29,999 | 112 (7.0%) | 93 (8.0%) |
| $30,000 to $34,999 | 135 (8.5%) | 86 (7.4%) |
| $35,000 to $39,999 | 37 (2.3%) | 95 (8.2%) |
| $40,000 to $44,999 | 114 (7.1%) | 148 (12.7%) |
| $45,000 to $49,999 | 246 (15.4%) | 80 (6.9%) |
| $50,000 to $54,999 | 51 (3.2%) | 98 (8.4%) |
| $55,000 to $64,999 | 59 (3.7%) | 65 (5.6%) |
| $65,000 to $74,999 | 28 (1.8%) | 60 (5.1%) |
| $75,000 to $99,999 | 127 (8.0%) | 64 (5.5%) |
| $100,000+ | 106 (6.6%) | 24 (2.1%) |
| Total | 1,598 (100.0%) | 1,166 (100.0%) |
Earnings by Sex by Educational Attainment in Sawmills
Average earnings in Sawmills are $43,910 for men and $40,598 for women, a difference of 7.5%. Men with an educational attainment of bachelor's degree enjoy the highest average annual earnings of $51,181, while those with high school diploma education earn the least with $24,554. Women with an educational attainment of graduate degree earn the most with the average annual earnings of $54,803, while those with high school diploma education have the smallest earnings of $35,036.
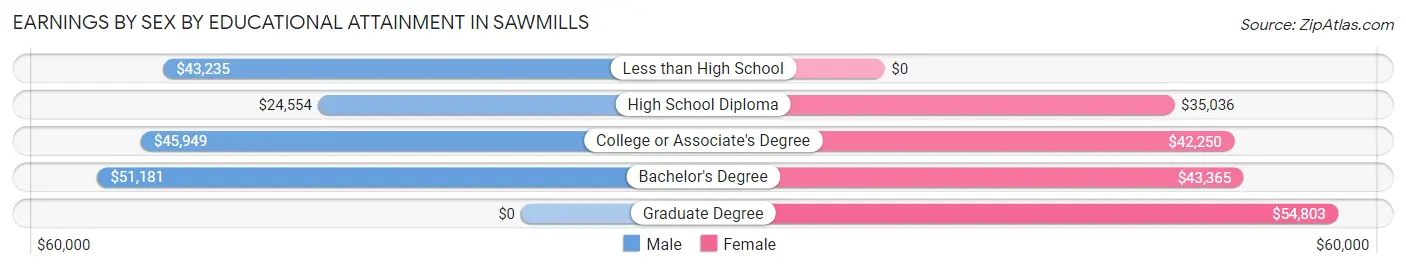
| Educational Attainment | Male Income | Female Income |
| Less than High School | $43,235 | $0 |
| High School Diploma | $24,554 | $35,036 |
| College or Associate's Degree | $45,949 | $42,250 |
| Bachelor's Degree | $51,181 | $43,365 |
| Graduate Degree | - | - |
| Total | $43,910 | $40,598 |
Family Income in Sawmills
Family Income Brackets in Sawmills
According to the Sawmills family income data, there are 325 families falling into the $100,000 to $149,999 income range, which is the most common income bracket and makes up 23.6% of all families. Conversely, the $200,000+ income bracket is the least frequent group with only 45 families (3.3%) belonging to this category.
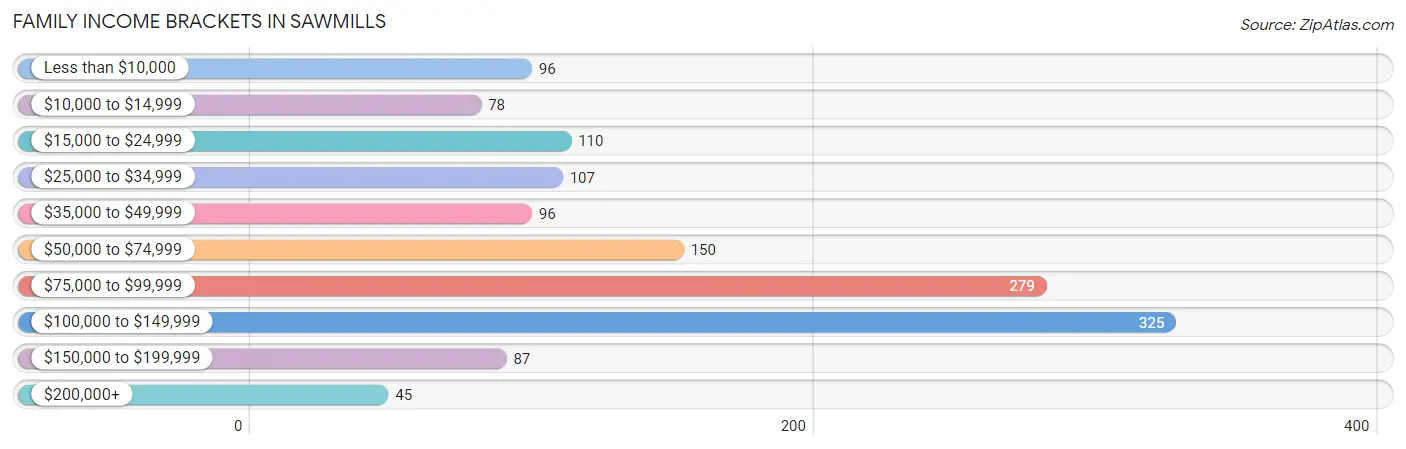
| Income Bracket | # Families | % Families |
| Less than $10,000 | 96 | 7.0% |
| $10,000 to $14,999 | 78 | 5.7% |
| $15,000 to $24,999 | 110 | 8.0% |
| $25,000 to $34,999 | 107 | 7.8% |
| $35,000 to $49,999 | 96 | 7.0% |
| $50,000 to $74,999 | 150 | 10.9% |
| $75,000 to $99,999 | 279 | 20.3% |
| $100,000 to $149,999 | 325 | 23.6% |
| $150,000 to $199,999 | 87 | 6.3% |
| $200,000+ | 45 | 3.3% |
Family Income by Famaliy Size in Sawmills
4-person families (137 | 10.0%) account for the highest median family income in Sawmills with $133,750 per family, while 3-person families (460 | 33.4%) have the highest median income of $33,452 per family member.
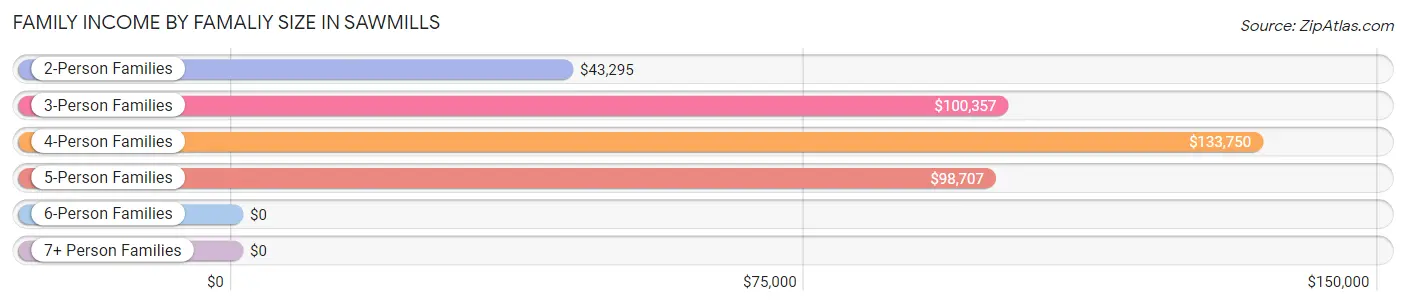
| Income Bracket | # Families | Median Income |
| 2-Person Families | 697 (50.6%) | $43,295 |
| 3-Person Families | 460 (33.4%) | $100,357 |
| 4-Person Families | 137 (10.0%) | $133,750 |
| 5-Person Families | 82 (6.0%) | $98,707 |
| 6-Person Families | 0 (0.0%) | $0 |
| 7+ Person Families | 0 (0.0%) | $0 |
| Total | 1,376 (100.0%) | $81,518 |
Family Income by Number of Earners in Sawmills
The median family income in Sawmills is $81,518, with families comprising 3+ earners (166) having the highest median family income of $99,957, while families with no earners (185) have the lowest median family income of $30,163, accounting for 12.1% and 13.4% of families, respectively.
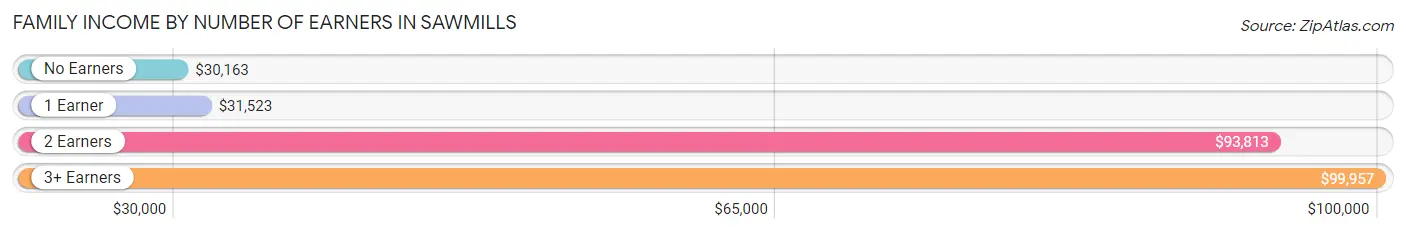
| Number of Earners | # Families | Median Income |
| No Earners | 185 (13.4%) | $30,163 |
| 1 Earner | 499 (36.3%) | $31,523 |
| 2 Earners | 526 (38.2%) | $93,813 |
| 3+ Earners | 166 (12.1%) | $99,957 |
| Total | 1,376 (100.0%) | $81,518 |
Household Income in Sawmills
Household Income Brackets in Sawmills
With 363 households falling in the category, the $75,000 to $99,999 income range is the most frequent in Sawmills, accounting for 18.7% of all households. In contrast, only 45 households (2.3%) fall into the $200,000+ income bracket, making it the least populous group.
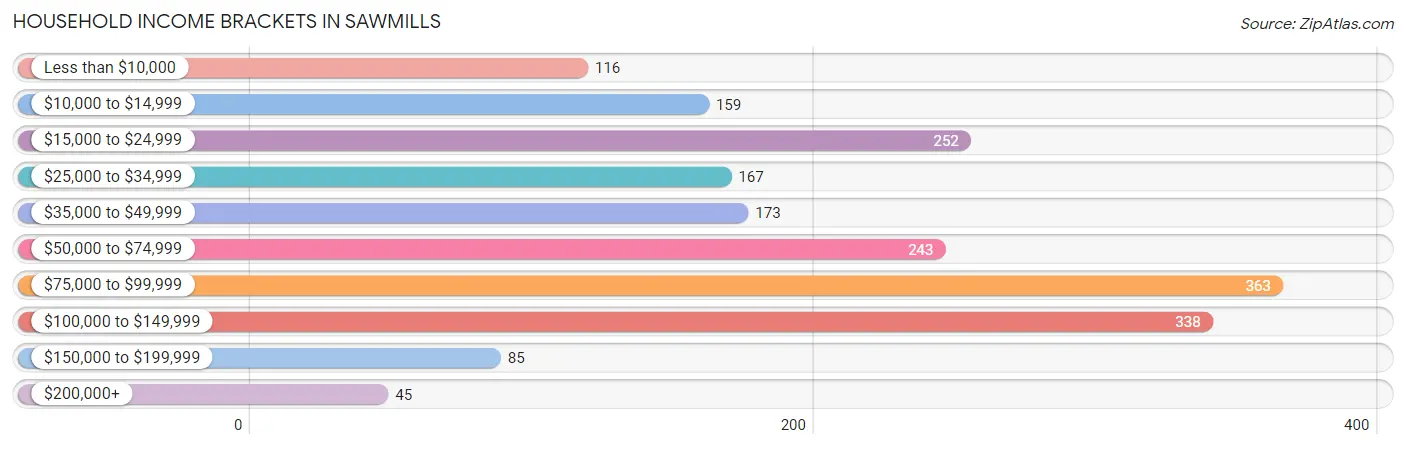
| Income Bracket | # Households | % Households |
| Less than $10,000 | 116 | 6.0% |
| $10,000 to $14,999 | 159 | 8.2% |
| $15,000 to $24,999 | 252 | 13.0% |
| $25,000 to $34,999 | 167 | 8.6% |
| $35,000 to $49,999 | 173 | 8.9% |
| $50,000 to $74,999 | 243 | 12.5% |
| $75,000 to $99,999 | 363 | 18.7% |
| $100,000 to $149,999 | 338 | 17.4% |
| $150,000 to $199,999 | 85 | 4.4% |
| $200,000+ | 45 | 2.3% |
Household Income by Householder Age in Sawmills
The median household income in Sawmills is $63,388, with the highest median household income of $80,000 found in the 45 to 64 years age bracket for the primary householder. A total of 1,008 households (51.9%) fall into this category. Meanwhile, the 15 to 24 years age bracket for the primary householder has the lowest median household income of $23,375, with 40 households (2.1%) in this group.
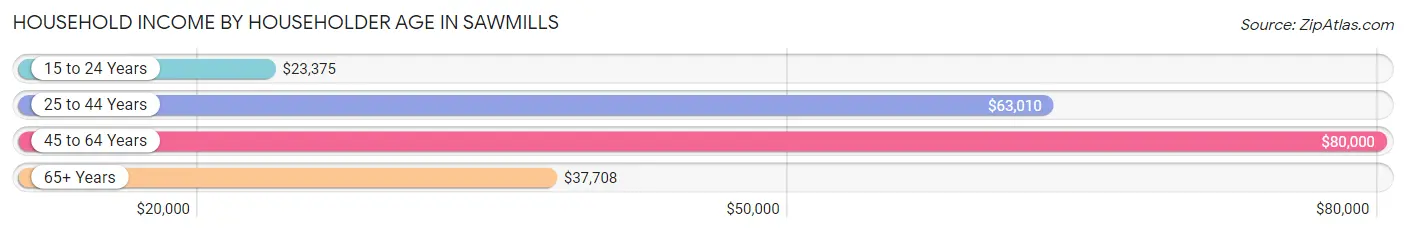
| Income Bracket | # Households | Median Income |
| 15 to 24 Years | 40 (2.1%) | $23,375 |
| 25 to 44 Years | 348 (17.9%) | $63,010 |
| 45 to 64 Years | 1,008 (51.9%) | $80,000 |
| 65+ Years | 545 (28.1%) | $37,708 |
| Total | 1,941 (100.0%) | $63,388 |
Poverty in Sawmills
Income Below Poverty by Sex and Age in Sawmills
With 12.0% poverty level for males and 18.3% for females among the residents of Sawmills, 15 year old males and 25 to 34 year old females are the most vulnerable to poverty, with 26 males (70.3%) and 99 females (37.8%) in their respective age groups living below the poverty level.
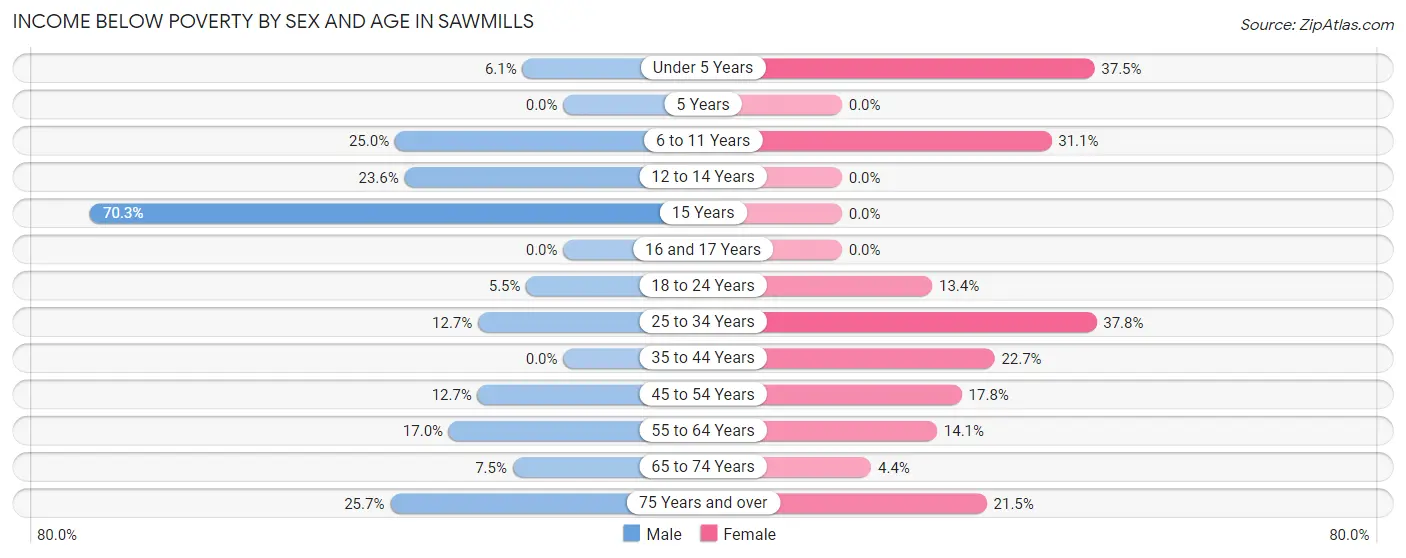
| Age Bracket | Male | Female |
| Under 5 Years | 4 (6.1%) | 12 (37.5%) |
| 5 Years | 0 (0.0%) | 0 (0.0%) |
| 6 to 11 Years | 35 (25.0%) | 42 (31.1%) |
| 12 to 14 Years | 29 (23.6%) | 0 (0.0%) |
| 15 Years | 26 (70.3%) | 0 (0.0%) |
| 16 and 17 Years | 0 (0.0%) | 0 (0.0%) |
| 18 to 24 Years | 14 (5.5%) | 13 (13.4%) |
| 25 to 34 Years | 58 (12.7%) | 99 (37.8%) |
| 35 to 44 Years | 0 (0.0%) | 39 (22.7%) |
| 45 to 54 Years | 88 (12.7%) | 60 (17.8%) |
| 55 to 64 Years | 53 (17.0%) | 62 (14.1%) |
| 65 to 74 Years | 18 (7.5%) | 13 (4.3%) |
| 75 Years and over | 27 (25.7%) | 46 (21.5%) |
| Total | 352 (12.0%) | 386 (18.3%) |
Income Above Poverty by Sex and Age in Sawmills
According to the poverty statistics in Sawmills, males aged 5 years and females aged 12 to 14 years are the age groups that are most secure financially, with 100.0% of males and 100.0% of females in these age groups living above the poverty line.
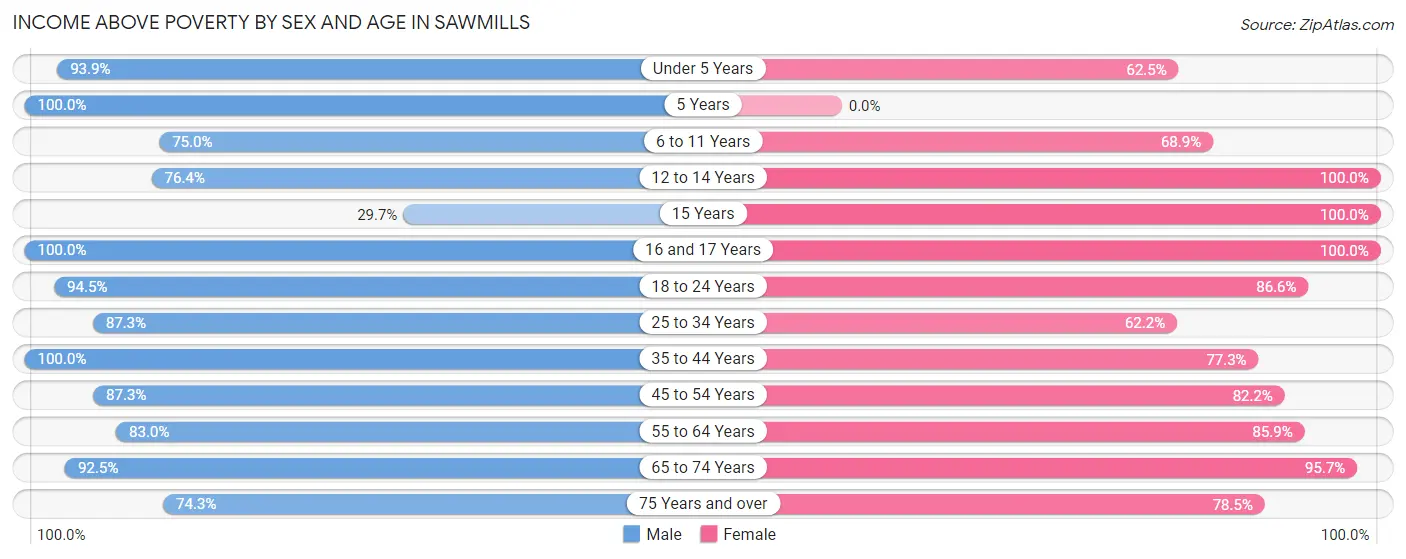
| Age Bracket | Male | Female |
| Under 5 Years | 62 (93.9%) | 20 (62.5%) |
| 5 Years | 18 (100.0%) | 0 (0.0%) |
| 6 to 11 Years | 105 (75.0%) | 93 (68.9%) |
| 12 to 14 Years | 94 (76.4%) | 58 (100.0%) |
| 15 Years | 11 (29.7%) | 10 (100.0%) |
| 16 and 17 Years | 264 (100.0%) | 50 (100.0%) |
| 18 to 24 Years | 241 (94.5%) | 84 (86.6%) |
| 25 to 34 Years | 400 (87.3%) | 163 (62.2%) |
| 35 to 44 Years | 211 (100.0%) | 133 (77.3%) |
| 45 to 54 Years | 604 (87.3%) | 277 (82.2%) |
| 55 to 64 Years | 259 (83.0%) | 377 (85.9%) |
| 65 to 74 Years | 222 (92.5%) | 286 (95.7%) |
| 75 Years and over | 78 (74.3%) | 168 (78.5%) |
| Total | 2,569 (87.9%) | 1,719 (81.7%) |
Income Below Poverty Among Married-Couple Families in Sawmills
The poverty statistics for married-couple families in Sawmills show that 12.5% or 107 of the total 855 families live below the poverty line. Families with no children have the highest poverty rate of 17.1%, comprising of 93 families. On the other hand, families with 3 or 4 children have the lowest poverty rate of 0.0%, which includes 0 families.
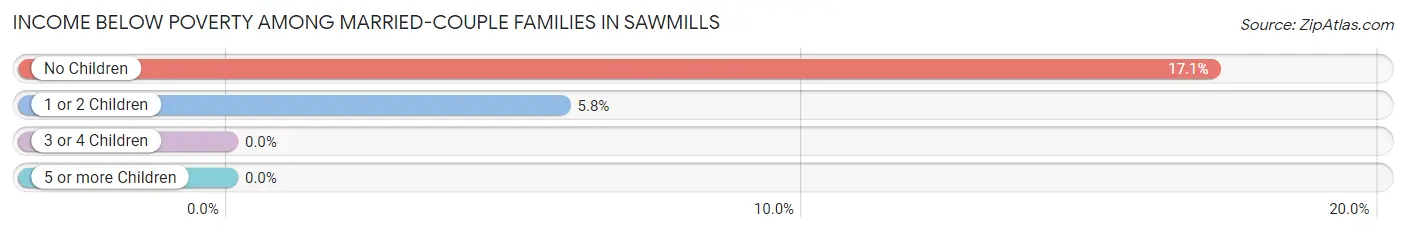
| Children | Above Poverty | Below Poverty |
| No Children | 451 (82.9%) | 93 (17.1%) |
| 1 or 2 Children | 228 (94.2%) | 14 (5.8%) |
| 3 or 4 Children | 69 (100.0%) | 0 (0.0%) |
| 5 or more Children | 0 (0.0%) | 0 (0.0%) |
| Total | 748 (87.5%) | 107 (12.5%) |
Income Below Poverty Among Single-Parent Households in Sawmills
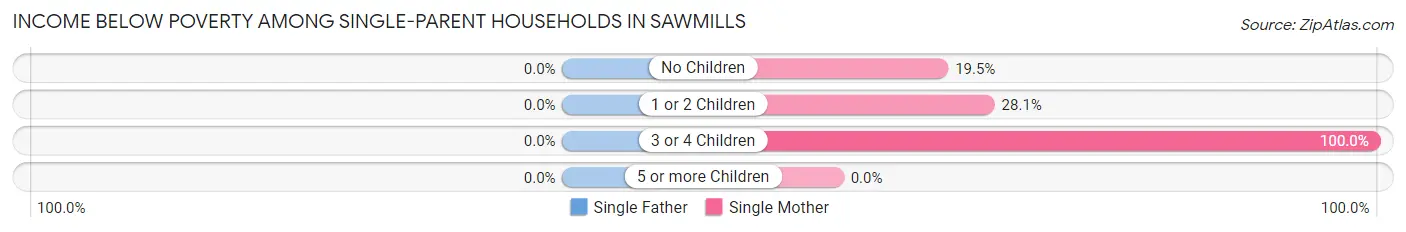
| Children | Single Father | Single Mother |
| No Children | 0 (0.0%) | 44 (19.5%) |
| 1 or 2 Children | 0 (0.0%) | 45 (28.1%) |
| 3 or 4 Children | 0 (0.0%) | 13 (100.0%) |
| 5 or more Children | 0 (0.0%) | 0 (0.0%) |
| Total | 0 (0.0%) | 102 (25.6%) |
Income Below Poverty Among Married-Couple vs Single-Parent Households in Sawmills
The poverty data for Sawmills shows that 107 of the married-couple family households (12.5%) and 102 of the single-parent households (19.6%) are living below the poverty level. Within the married-couple family households, those with no children have the highest poverty rate, with 93 households (17.1%) falling below the poverty line. Among the single-parent households, those with 3 or 4 children have the highest poverty rate, with 13 household (100.0%) living below poverty.
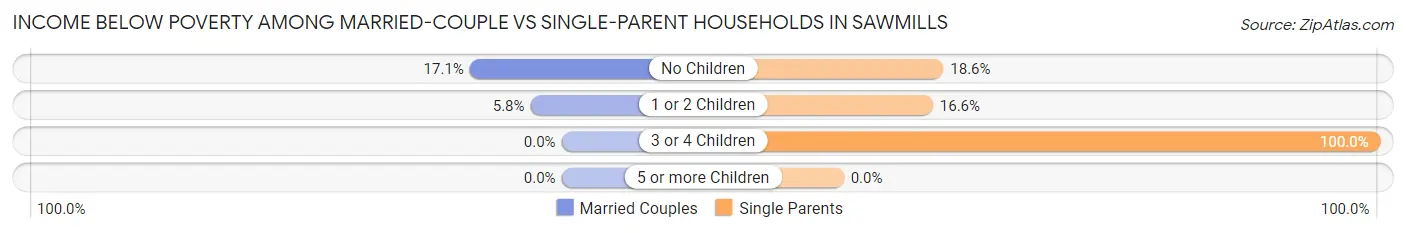
| Children | Married-Couple Families | Single-Parent Households |
| No Children | 93 (17.1%) | 44 (18.6%) |
| 1 or 2 Children | 14 (5.8%) | 45 (16.6%) |
| 3 or 4 Children | 0 (0.0%) | 13 (100.0%) |
| 5 or more Children | 0 (0.0%) | 0 (0.0%) |
| Total | 107 (12.5%) | 102 (19.6%) |
Employment Characteristics in Sawmills
Employment by Class of Employer in Sawmills
Among the 2,291 employed individuals in Sawmills, private company employees (1,725 | 75.3%), local government employees (199 | 8.7%), and state government employees (156 | 6.8%) make up the most common classes of employment.
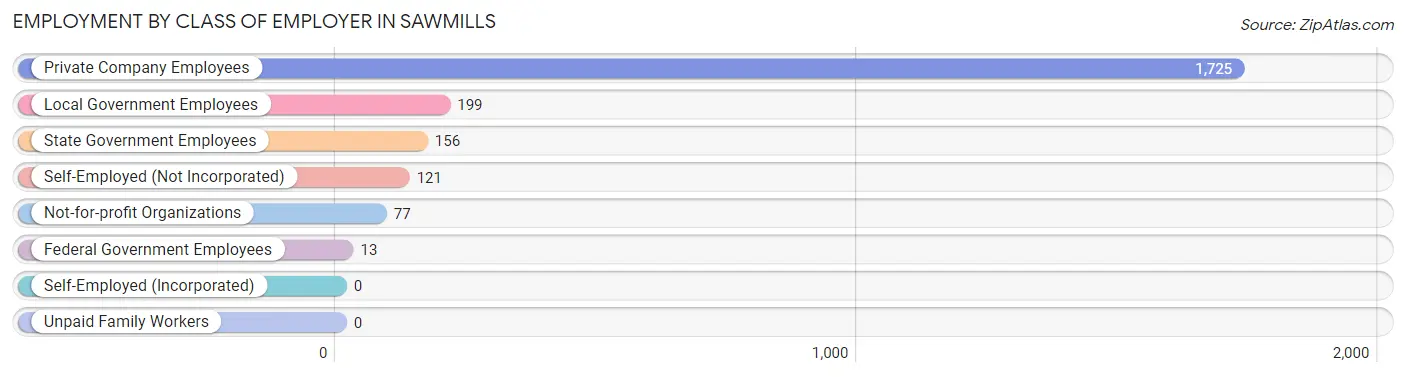
| Employer Class | # Employees | % Employees |
| Private Company Employees | 1,725 | 75.3% |
| Self-Employed (Incorporated) | 0 | 0.0% |
| Self-Employed (Not Incorporated) | 121 | 5.3% |
| Not-for-profit Organizations | 77 | 3.4% |
| Local Government Employees | 199 | 8.7% |
| State Government Employees | 156 | 6.8% |
| Federal Government Employees | 13 | 0.6% |
| Unpaid Family Workers | 0 | 0.0% |
| Total | 2,291 | 100.0% |
Employment Status by Age in Sawmills
According to the labor force statistics for Sawmills, out of the total population over 16 years of age (4,407), 58.3% or 2,569 individuals are in the labor force, with 8.0% or 206 of them unemployed. The age group with the highest labor force participation rate is 35 to 44 years, with 94.3% or 361 individuals in the labor force. Within the labor force, the 25 to 29 years age range has the highest percentage of unemployed individuals, with 47.7% or 168 of them being unemployed.
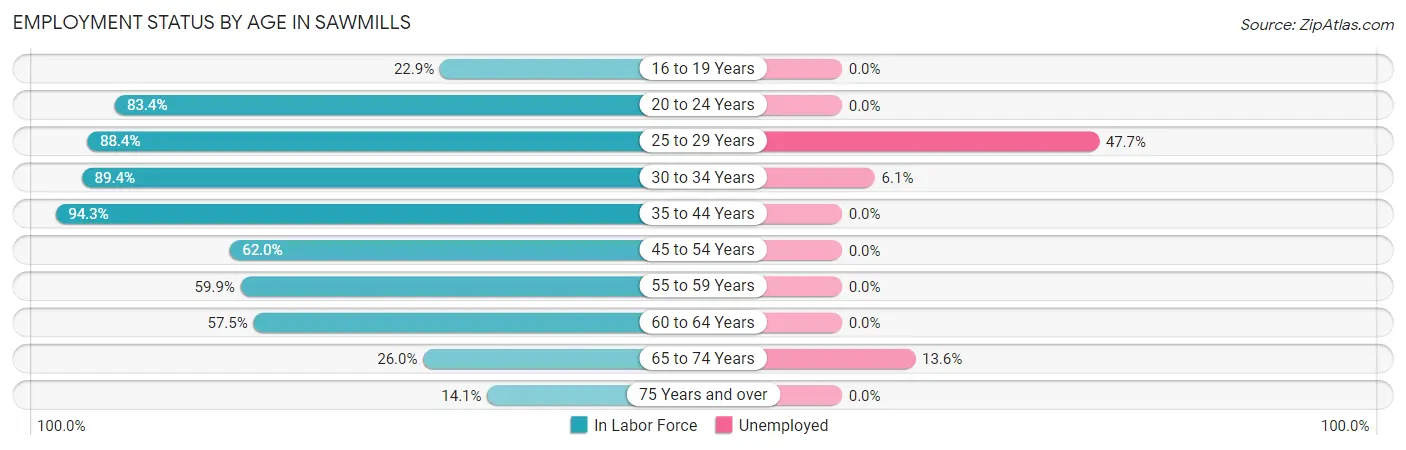
| Age Bracket | In Labor Force | Unemployed |
| 16 to 19 Years | 96 (22.9%) | 0 (0.0%) |
| 20 to 24 Years | 206 (83.4%) | 0 (0.0%) |
| 25 to 29 Years | 352 (88.4%) | 168 (47.7%) |
| 30 to 34 Years | 288 (89.4%) | 18 (6.1%) |
| 35 to 44 Years | 361 (94.3%) | 0 (0.0%) |
| 45 to 54 Years | 638 (62.0%) | 0 (0.0%) |
| 55 to 59 Years | 306 (59.9%) | 0 (0.0%) |
| 60 to 64 Years | 138 (57.5%) | 0 (0.0%) |
| 65 to 74 Years | 140 (26.0%) | 19 (13.6%) |
| 75 Years and over | 45 (14.1%) | 0 (0.0%) |
| Total | 2,569 (58.3%) | 206 (8.0%) |
Employment Status by Educational Attainment in Sawmills
According to labor force statistics for Sawmills, 72.3% of individuals (2,084) out of the total population between 25 and 64 years of age (2,883) are in the labor force, with 8.9% or 185 of them being unemployed. The group with the highest labor force participation rate are those with the educational attainment of bachelor's degree or higher, with 88.2% or 428 individuals in the labor force. Within the labor force, individuals with high school diploma education have the highest percentage of unemployment, with 24.6% or 163 of them being unemployed.
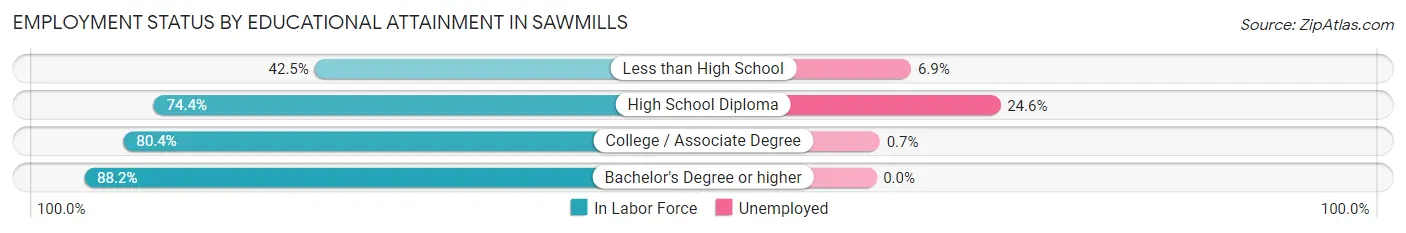
| Educational Attainment | In Labor Force | Unemployed |
| Less than High School | 246 (42.5%) | 40 (6.9%) |
| High School Diploma | 662 (74.4%) | 219 (24.6%) |
| College / Associate Degree | 747 (80.4%) | 7 (0.7%) |
| Bachelor's Degree or higher | 428 (88.2%) | 0 (0.0%) |
| Total | 2,084 (72.3%) | 257 (8.9%) |
Employment Occupations by Sex in Sawmills
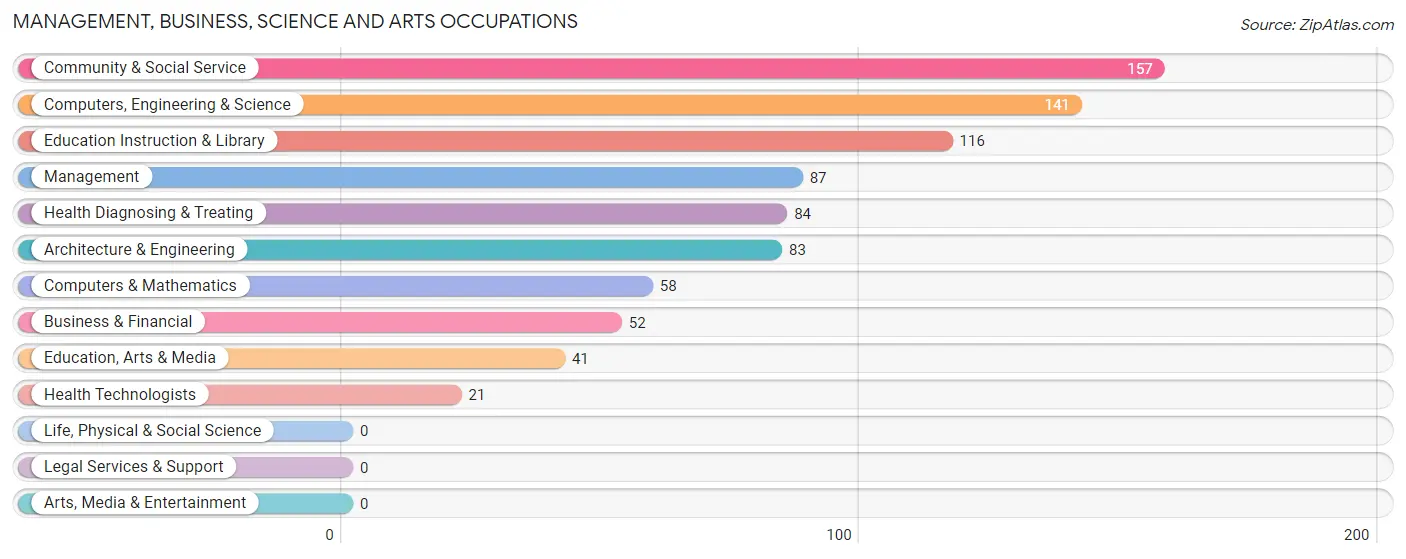
Management, Business, Science and Arts Occupations
The most common Management, Business, Science and Arts occupations in Sawmills are Community & Social Service (157 | 6.7%), Computers, Engineering & Science (141 | 6.0%), Education Instruction & Library (116 | 4.9%), Management (87 | 3.7%), and Health Diagnosing & Treating (84 | 3.6%).
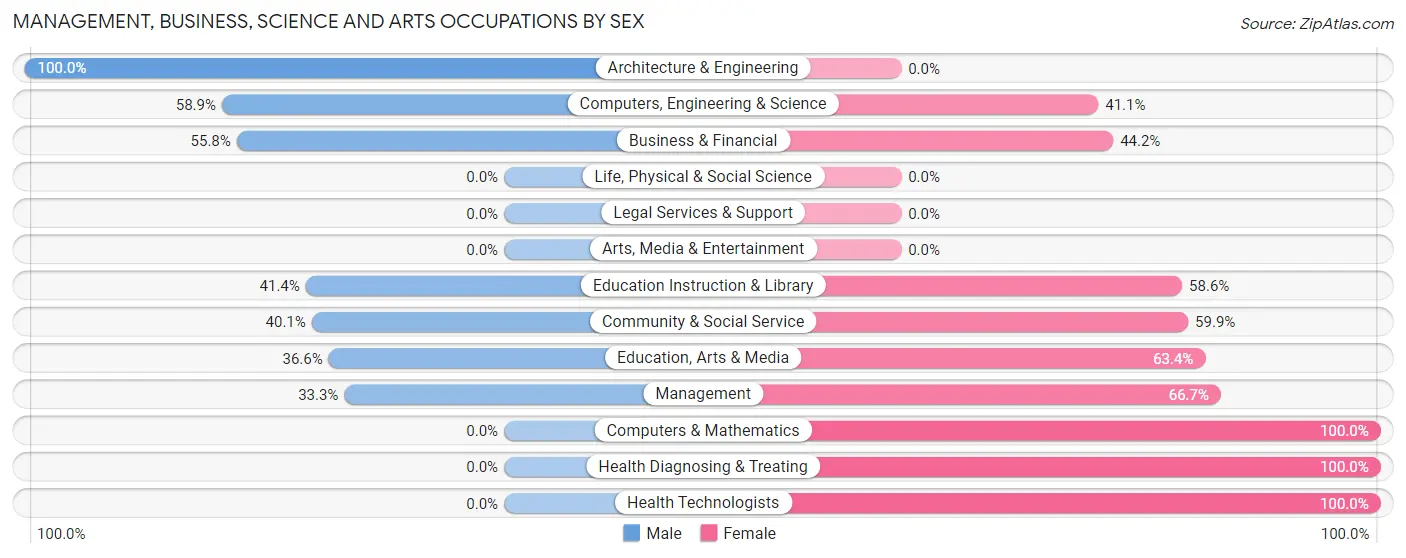
Management, Business, Science and Arts Occupations by Sex
Within the Management, Business, Science and Arts occupations in Sawmills, the most male-oriented occupations are Architecture & Engineering (100.0%), Computers, Engineering & Science (58.9%), and Business & Financial (55.8%), while the most female-oriented occupations are Computers & Mathematics (100.0%), Health Diagnosing & Treating (100.0%), and Health Technologists (100.0%).
| Occupation | Male | Female |
| Management | 29 (33.3%) | 58 (66.7%) |
| Business & Financial | 29 (55.8%) | 23 (44.2%) |
| Computers, Engineering & Science | 83 (58.9%) | 58 (41.1%) |
| Computers & Mathematics | 0 (0.0%) | 58 (100.0%) |
| Architecture & Engineering | 83 (100.0%) | 0 (0.0%) |
| Life, Physical & Social Science | 0 (0.0%) | 0 (0.0%) |
| Community & Social Service | 63 (40.1%) | 94 (59.9%) |
| Education, Arts & Media | 15 (36.6%) | 26 (63.4%) |
| Legal Services & Support | 0 (0.0%) | 0 (0.0%) |
| Education Instruction & Library | 48 (41.4%) | 68 (58.6%) |
| Arts, Media & Entertainment | 0 (0.0%) | 0 (0.0%) |
| Health Diagnosing & Treating | 0 (0.0%) | 84 (100.0%) |
| Health Technologists | 0 (0.0%) | 21 (100.0%) |
| Total (Category) | 204 (39.2%) | 317 (60.8%) |
| Total (Overall) | 1,229 (52.2%) | 1,124 (47.8%) |
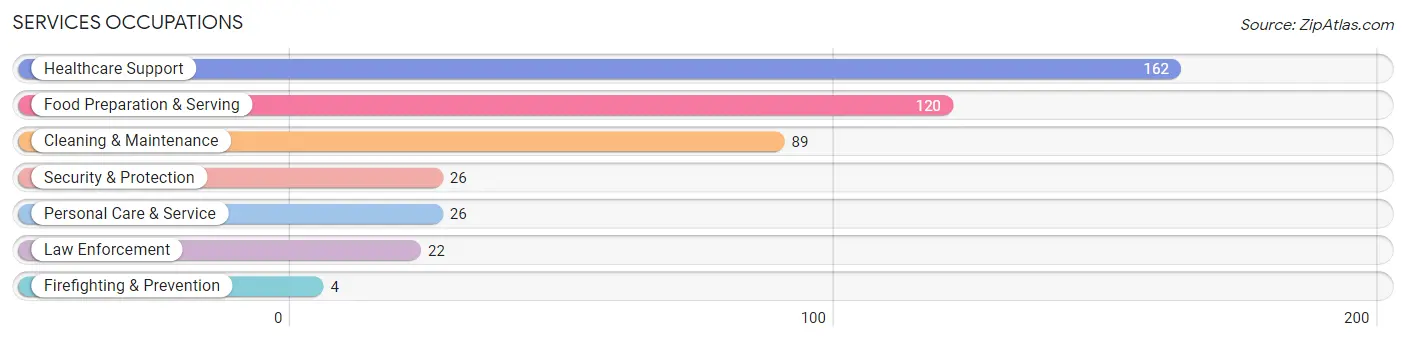
Services Occupations
The most common Services occupations in Sawmills are Healthcare Support (162 | 6.9%), Food Preparation & Serving (120 | 5.1%), Cleaning & Maintenance (89 | 3.8%), Security & Protection (26 | 1.1%), and Personal Care & Service (26 | 1.1%).
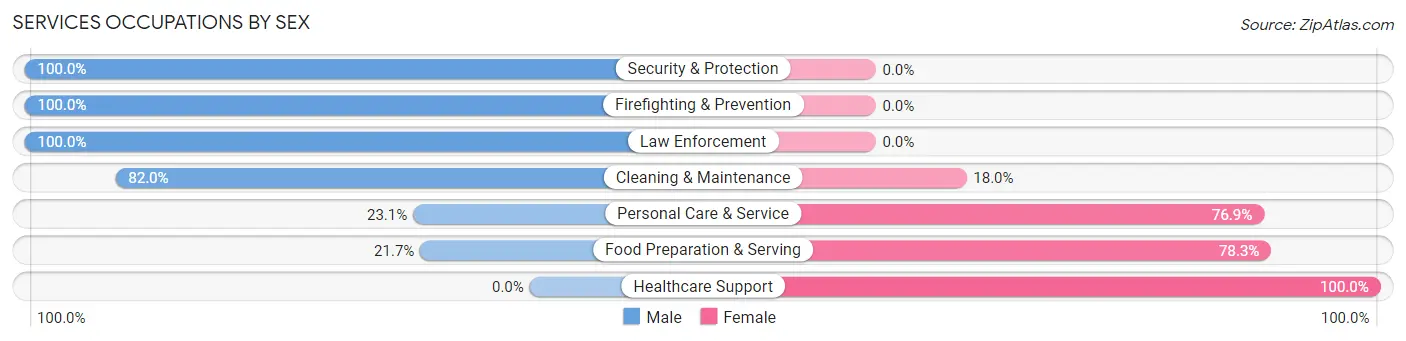
Services Occupations by Sex
Within the Services occupations in Sawmills, the most male-oriented occupations are Security & Protection (100.0%), Firefighting & Prevention (100.0%), and Law Enforcement (100.0%), while the most female-oriented occupations are Healthcare Support (100.0%), Food Preparation & Serving (78.3%), and Personal Care & Service (76.9%).
| Occupation | Male | Female |
| Healthcare Support | 0 (0.0%) | 162 (100.0%) |
| Security & Protection | 26 (100.0%) | 0 (0.0%) |
| Firefighting & Prevention | 4 (100.0%) | 0 (0.0%) |
| Law Enforcement | 22 (100.0%) | 0 (0.0%) |
| Food Preparation & Serving | 26 (21.7%) | 94 (78.3%) |
| Cleaning & Maintenance | 73 (82.0%) | 16 (18.0%) |
| Personal Care & Service | 6 (23.1%) | 20 (76.9%) |
| Total (Category) | 131 (31.0%) | 292 (69.0%) |
| Total (Overall) | 1,229 (52.2%) | 1,124 (47.8%) |
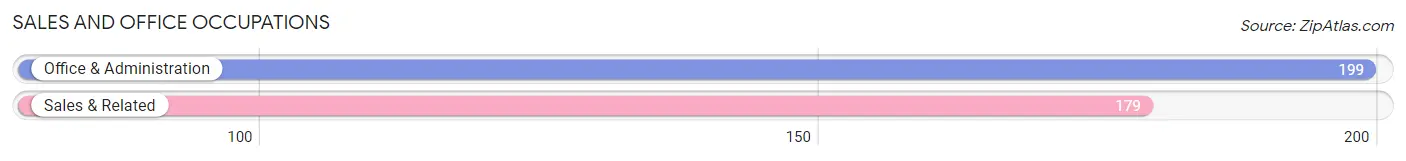
Sales and Office Occupations
The most common Sales and Office occupations in Sawmills are Office & Administration (199 | 8.5%), and Sales & Related (179 | 7.6%).
Sales and Office Occupations by Sex
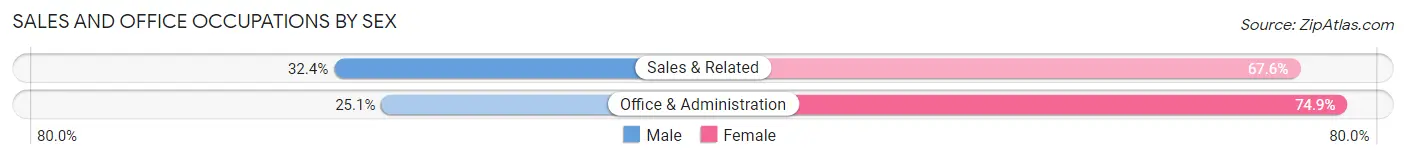
| Occupation | Male | Female |
| Sales & Related | 58 (32.4%) | 121 (67.6%) |
| Office & Administration | 50 (25.1%) | 149 (74.9%) |
| Total (Category) | 108 (28.6%) | 270 (71.4%) |
| Total (Overall) | 1,229 (52.2%) | 1,124 (47.8%) |
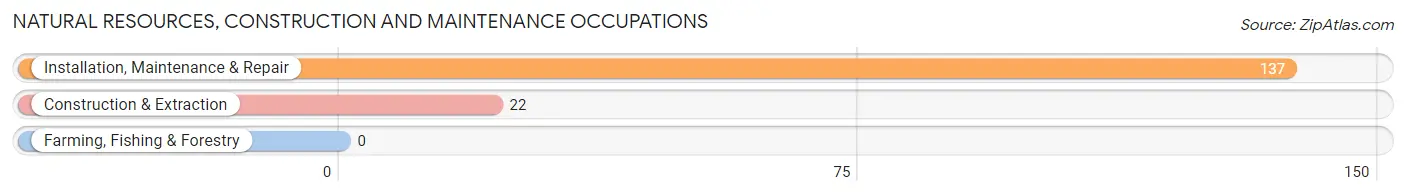
Natural Resources, Construction and Maintenance Occupations
The most common Natural Resources, Construction and Maintenance occupations in Sawmills are Installation, Maintenance & Repair (137 | 5.8%), and Construction & Extraction (22 | 0.9%).
Natural Resources, Construction and Maintenance Occupations by Sex
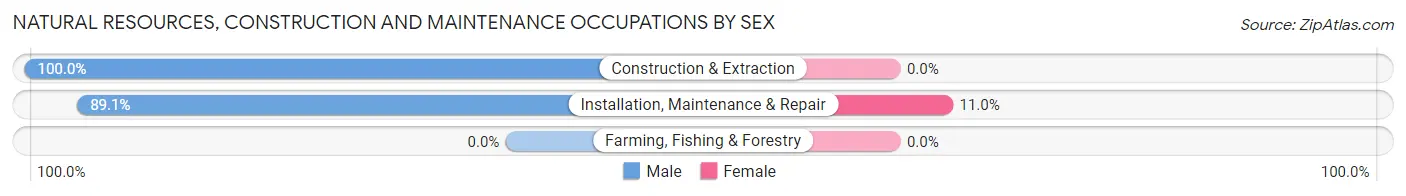
| Occupation | Male | Female |
| Farming, Fishing & Forestry | 0 (0.0%) | 0 (0.0%) |
| Construction & Extraction | 22 (100.0%) | 0 (0.0%) |
| Installation, Maintenance & Repair | 122 (89.0%) | 15 (11.0%) |
| Total (Category) | 144 (90.6%) | 15 (9.4%) |
| Total (Overall) | 1,229 (52.2%) | 1,124 (47.8%) |
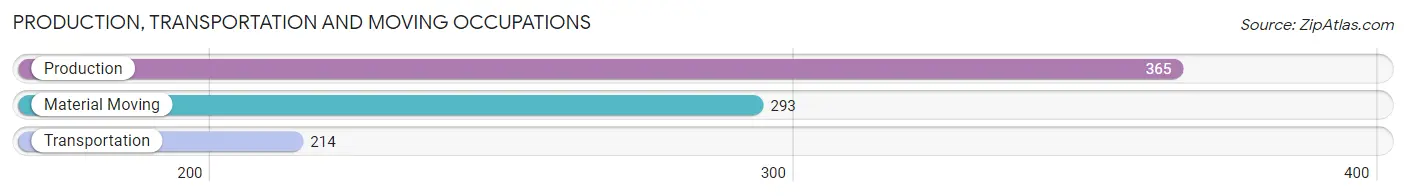
Production, Transportation and Moving Occupations
The most common Production, Transportation and Moving occupations in Sawmills are Production (365 | 15.5%), Material Moving (293 | 12.4%), and Transportation (214 | 9.1%).
Production, Transportation and Moving Occupations by Sex
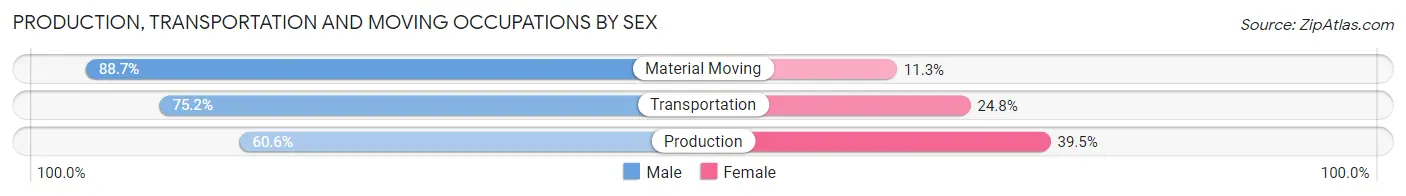
| Occupation | Male | Female |
| Production | 221 (60.6%) | 144 (39.5%) |
| Transportation | 161 (75.2%) | 53 (24.8%) |
| Material Moving | 260 (88.7%) | 33 (11.3%) |
| Total (Category) | 642 (73.6%) | 230 (26.4%) |
| Total (Overall) | 1,229 (52.2%) | 1,124 (47.8%) |
Employment Industries by Sex in Sawmills
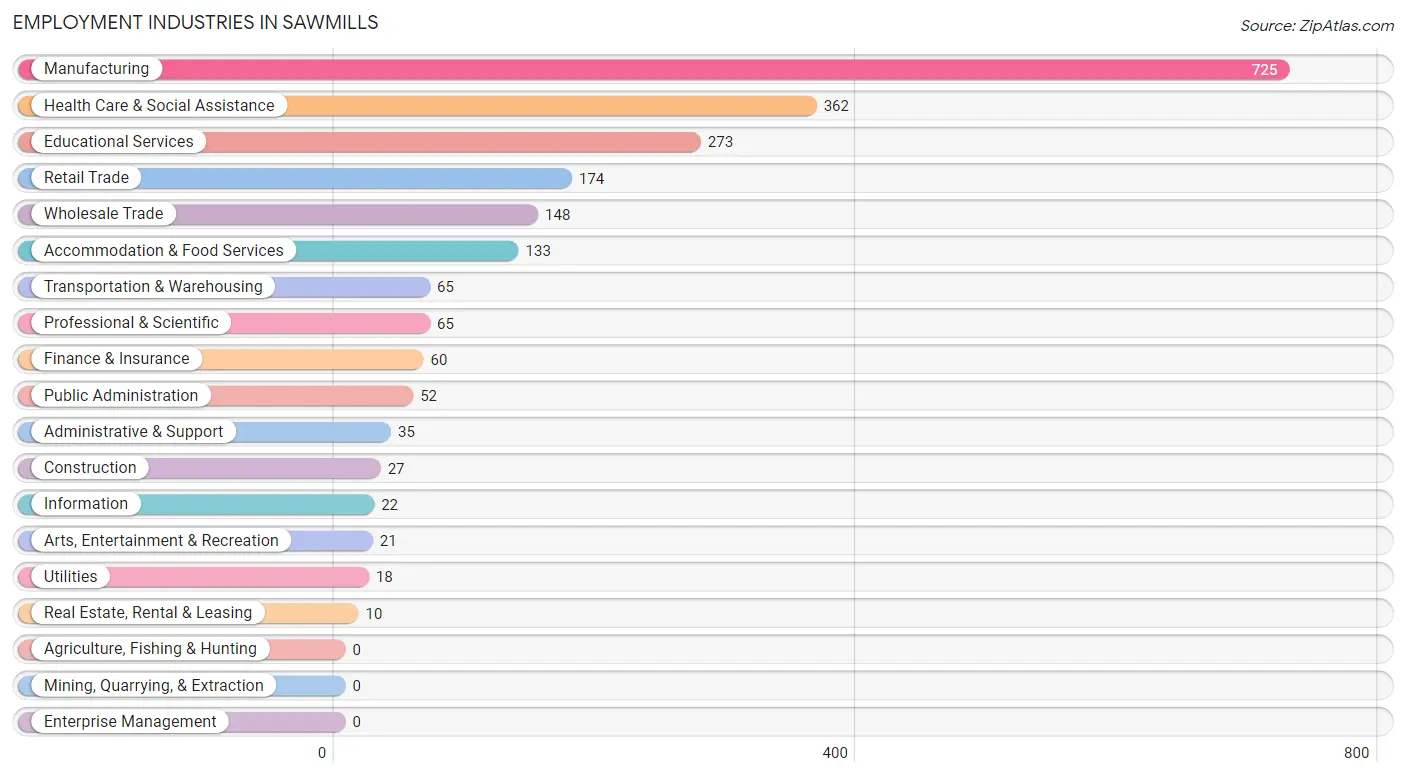
Employment Industries in Sawmills
The major employment industries in Sawmills include Manufacturing (725 | 30.8%), Health Care & Social Assistance (362 | 15.4%), Educational Services (273 | 11.6%), Retail Trade (174 | 7.4%), and Wholesale Trade (148 | 6.3%).
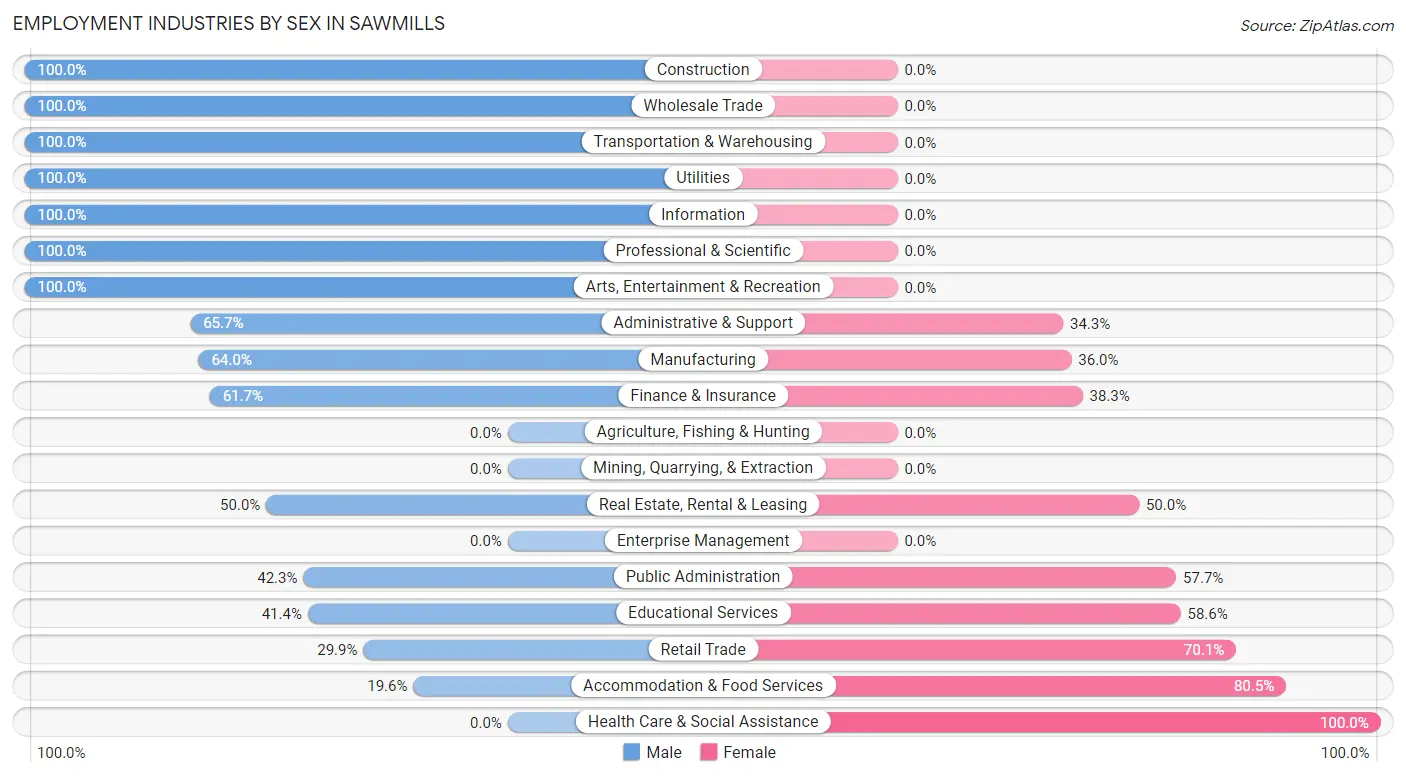
Employment Industries by Sex in Sawmills
The Sawmills industries that see more men than women are Construction (100.0%), Wholesale Trade (100.0%), and Transportation & Warehousing (100.0%), whereas the industries that tend to have a higher number of women are Health Care & Social Assistance (100.0%), Accommodation & Food Services (80.4%), and Retail Trade (70.1%).
| Industry | Male | Female |
| Agriculture, Fishing & Hunting | 0 (0.0%) | 0 (0.0%) |
| Mining, Quarrying, & Extraction | 0 (0.0%) | 0 (0.0%) |
| Construction | 27 (100.0%) | 0 (0.0%) |
| Manufacturing | 464 (64.0%) | 261 (36.0%) |
| Wholesale Trade | 148 (100.0%) | 0 (0.0%) |
| Retail Trade | 52 (29.9%) | 122 (70.1%) |
| Transportation & Warehousing | 65 (100.0%) | 0 (0.0%) |
| Utilities | 18 (100.0%) | 0 (0.0%) |
| Information | 22 (100.0%) | 0 (0.0%) |
| Finance & Insurance | 37 (61.7%) | 23 (38.3%) |
| Real Estate, Rental & Leasing | 5 (50.0%) | 5 (50.0%) |
| Professional & Scientific | 65 (100.0%) | 0 (0.0%) |
| Enterprise Management | 0 (0.0%) | 0 (0.0%) |
| Administrative & Support | 23 (65.7%) | 12 (34.3%) |
| Educational Services | 113 (41.4%) | 160 (58.6%) |
| Health Care & Social Assistance | 0 (0.0%) | 362 (100.0%) |
| Arts, Entertainment & Recreation | 21 (100.0%) | 0 (0.0%) |
| Accommodation & Food Services | 26 (19.6%) | 107 (80.4%) |
| Public Administration | 22 (42.3%) | 30 (57.7%) |
| Total | 1,229 (52.2%) | 1,124 (47.8%) |
Education in Sawmills
School Enrollment in Sawmills
The most common levels of schooling among the 981 students in Sawmills are high school (387 | 39.5%), middle school (251 | 25.6%), and elementary school (173 | 17.6%).
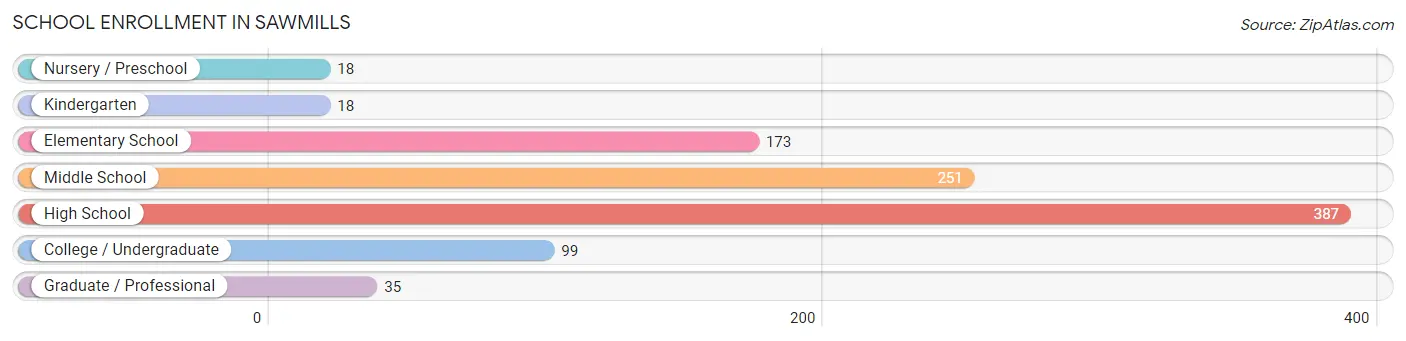
| School Level | # Students | % Students |
| Nursery / Preschool | 18 | 1.8% |
| Kindergarten | 18 | 1.8% |
| Elementary School | 173 | 17.6% |
| Middle School | 251 | 25.6% |
| High School | 387 | 39.5% |
| College / Undergraduate | 99 | 10.1% |
| Graduate / Professional | 35 | 3.6% |
| Total | 981 | 100.0% |
School Enrollment by Age by Funding Source in Sawmills
Out of a total of 981 students who are enrolled in schools in Sawmills, 36 (3.7%) attend a private institution, while the remaining 945 (96.3%) are enrolled in public schools. The age group of 20 to 24 year olds has the highest likelihood of being enrolled in private schools, with 18 (24.0% in the age bracket) enrolled. Conversely, the age group of 10 to 14 year olds has the lowest likelihood of being enrolled in a private school, with 275 (100.0% in the age bracket) attending a public institution.
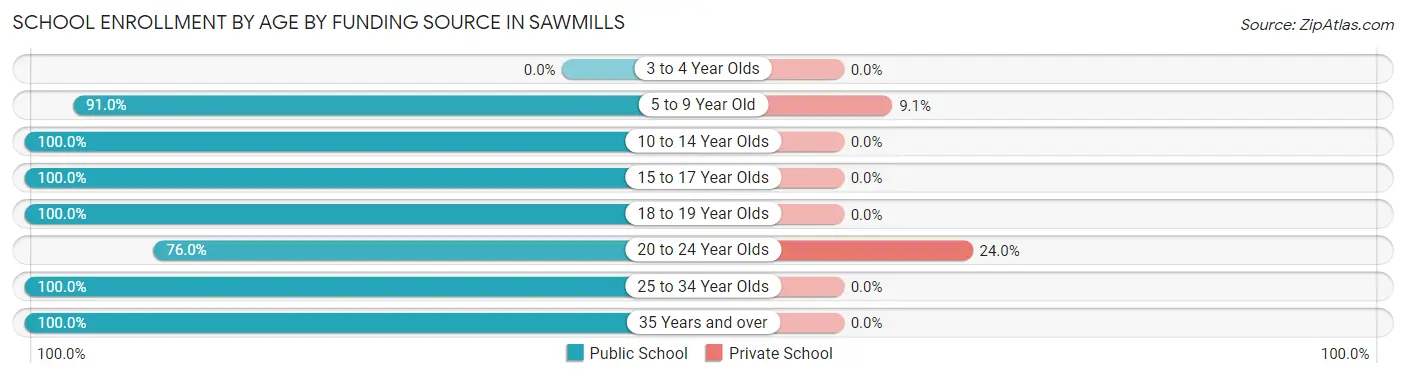
| Age Bracket | Public School | Private School |
| 3 to 4 Year Olds | 0 (0.0%) | 0 (0.0%) |
| 5 to 9 Year Old | 181 (90.9%) | 18 (9.0%) |
| 10 to 14 Year Olds | 275 (100.0%) | 0 (0.0%) |
| 15 to 17 Year Olds | 338 (100.0%) | 0 (0.0%) |
| 18 to 19 Year Olds | 39 (100.0%) | 0 (0.0%) |
| 20 to 24 Year Olds | 57 (76.0%) | 18 (24.0%) |
| 25 to 34 Year Olds | 27 (100.0%) | 0 (0.0%) |
| 35 Years and over | 28 (100.0%) | 0 (0.0%) |
| Total | 945 (96.3%) | 36 (3.7%) |
Educational Attainment by Field of Study in Sawmills
Education (155 | 24.1%), physical & health sciences (75 | 11.7%), arts & humanities (75 | 11.7%), business (74 | 11.5%), and science & technology (54 | 8.4%) are the most common fields of study among 642 individuals in Sawmills who have obtained a bachelor's degree or higher.
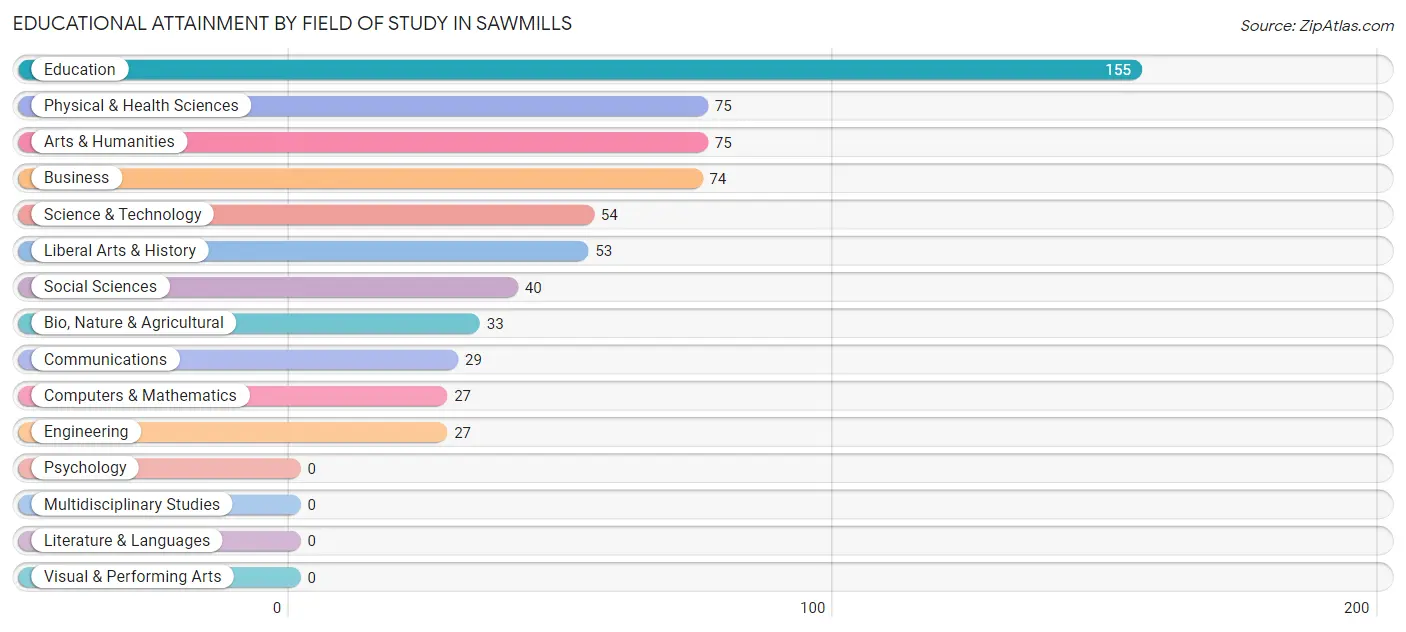
| Field of Study | # Graduates | % Graduates |
| Computers & Mathematics | 27 | 4.2% |
| Bio, Nature & Agricultural | 33 | 5.1% |
| Physical & Health Sciences | 75 | 11.7% |
| Psychology | 0 | 0.0% |
| Social Sciences | 40 | 6.2% |
| Engineering | 27 | 4.2% |
| Multidisciplinary Studies | 0 | 0.0% |
| Science & Technology | 54 | 8.4% |
| Business | 74 | 11.5% |
| Education | 155 | 24.1% |
| Literature & Languages | 0 | 0.0% |
| Liberal Arts & History | 53 | 8.3% |
| Visual & Performing Arts | 0 | 0.0% |
| Communications | 29 | 4.5% |
| Arts & Humanities | 75 | 11.7% |
| Total | 642 | 100.0% |
Transportation & Commute in Sawmills
Vehicle Availability by Sex in Sawmills
The most prevalent vehicle ownership categories in Sawmills are males with 2 vehicles (505, accounting for 40.8%) and females with 2 vehicles (345, making up 48.0%).
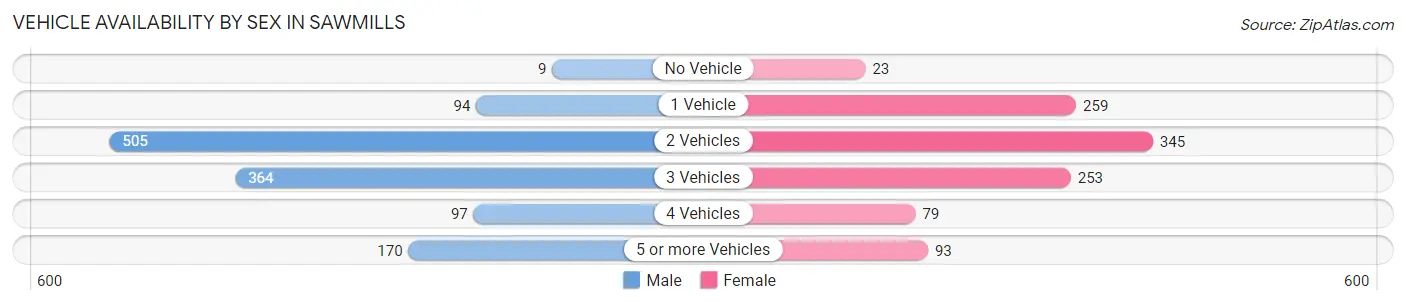
| Vehicles Available | Male | Female |
| No Vehicle | 9 (0.7%) | 23 (2.2%) |
| 1 Vehicle | 94 (7.6%) | 259 (24.6%) |
| 2 Vehicles | 505 (40.8%) | 345 (32.8%) |
| 3 Vehicles | 364 (29.4%) | 253 (24.0%) |
| 4 Vehicles | 97 (7.8%) | 79 (7.5%) |
| 5 or more Vehicles | 170 (13.7%) | 93 (8.8%) |
| Total | 1,239 (100.0%) | 1,052 (100.0%) |
Commute Time in Sawmills
The most frequently occuring commute durations in Sawmills are 20 to 24 minutes (497 commuters, 22.0%), 15 to 19 minutes (319 commuters, 14.1%), and 25 to 29 minutes (293 commuters, 13.0%).
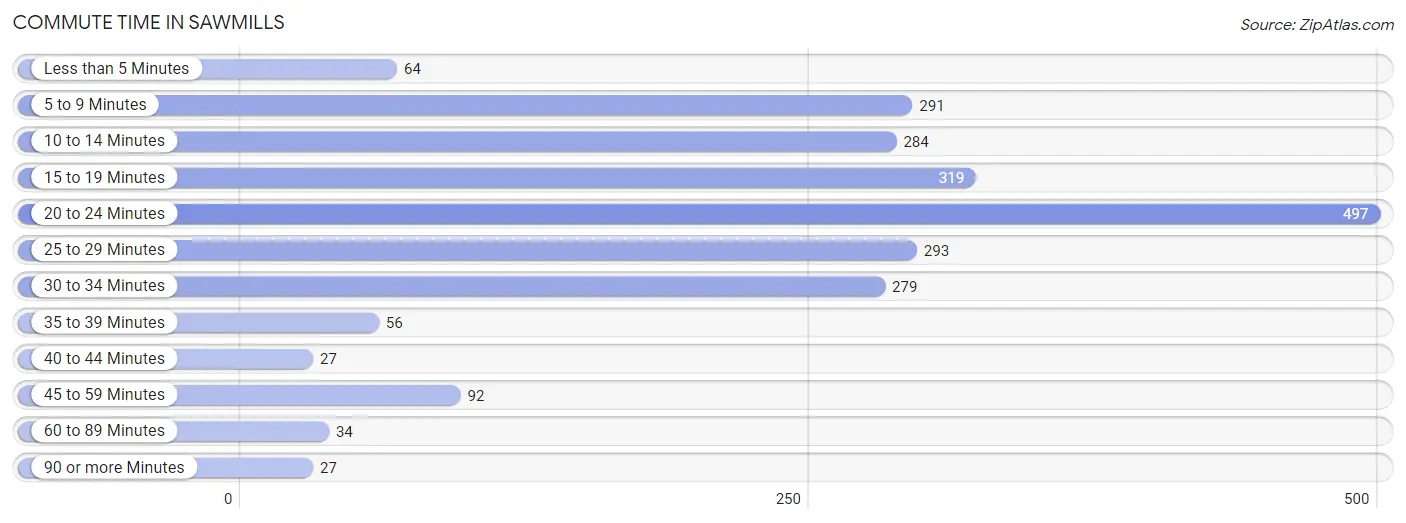
| Commute Time | # Commuters | % Commuters |
| Less than 5 Minutes | 64 | 2.8% |
| 5 to 9 Minutes | 291 | 12.9% |
| 10 to 14 Minutes | 284 | 12.6% |
| 15 to 19 Minutes | 319 | 14.1% |
| 20 to 24 Minutes | 497 | 22.0% |
| 25 to 29 Minutes | 293 | 13.0% |
| 30 to 34 Minutes | 279 | 12.3% |
| 35 to 39 Minutes | 56 | 2.5% |
| 40 to 44 Minutes | 27 | 1.2% |
| 45 to 59 Minutes | 92 | 4.1% |
| 60 to 89 Minutes | 34 | 1.5% |
| 90 or more Minutes | 27 | 1.2% |
Commute Time by Sex in Sawmills
The most common commute times in Sawmills are 20 to 24 minutes (331 commuters, 26.7%) for males and 30 to 34 minutes (170 commuters, 16.6%) for females.
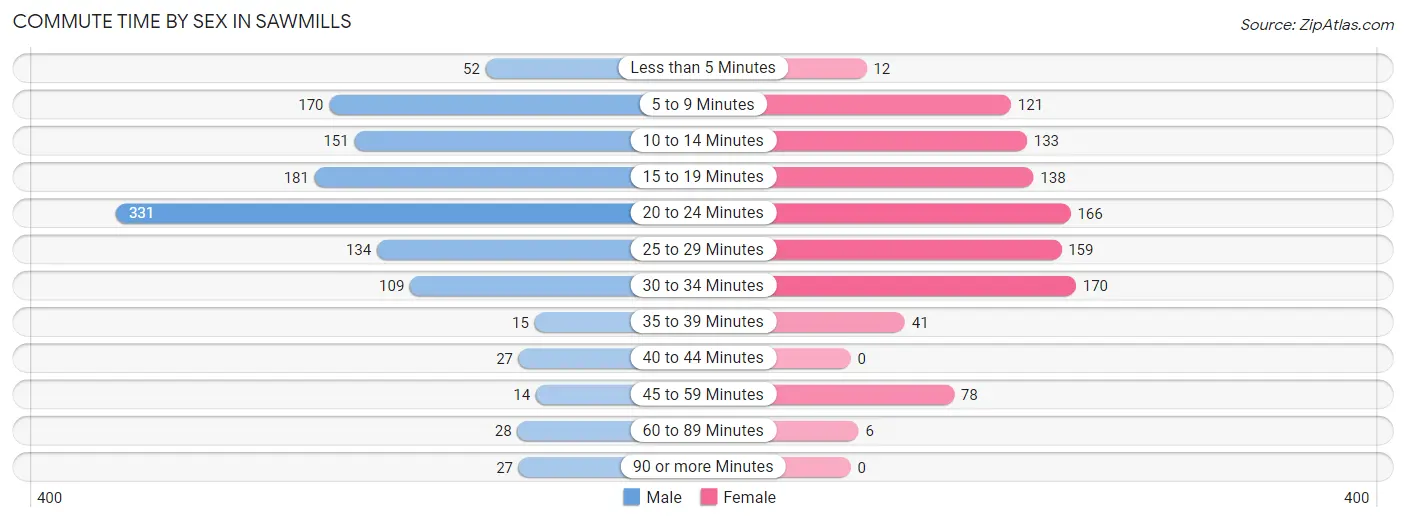
| Commute Time | Male | Female |
| Less than 5 Minutes | 52 (4.2%) | 12 (1.2%) |
| 5 to 9 Minutes | 170 (13.7%) | 121 (11.8%) |
| 10 to 14 Minutes | 151 (12.2%) | 133 (13.0%) |
| 15 to 19 Minutes | 181 (14.6%) | 138 (13.5%) |
| 20 to 24 Minutes | 331 (26.7%) | 166 (16.2%) |
| 25 to 29 Minutes | 134 (10.8%) | 159 (15.5%) |
| 30 to 34 Minutes | 109 (8.8%) | 170 (16.6%) |
| 35 to 39 Minutes | 15 (1.2%) | 41 (4.0%) |
| 40 to 44 Minutes | 27 (2.2%) | 0 (0.0%) |
| 45 to 59 Minutes | 14 (1.1%) | 78 (7.6%) |
| 60 to 89 Minutes | 28 (2.3%) | 6 (0.6%) |
| 90 or more Minutes | 27 (2.2%) | 0 (0.0%) |
Time of Departure to Work by Sex in Sawmills
The most frequent times of departure to work in Sawmills are 6:00 AM to 6:29 AM (315, 25.4%) for males and 7:30 AM to 7:59 AM (220, 21.5%) for females.
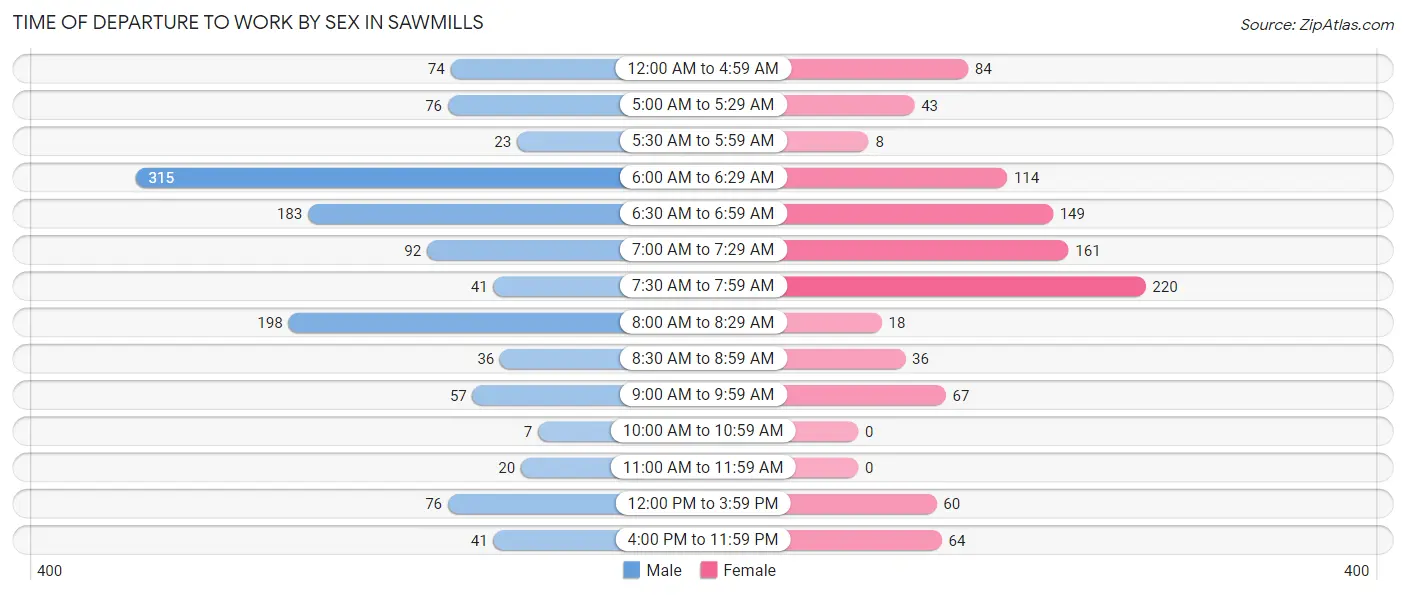
| Time of Departure | Male | Female |
| 12:00 AM to 4:59 AM | 74 (6.0%) | 84 (8.2%) |
| 5:00 AM to 5:29 AM | 76 (6.1%) | 43 (4.2%) |
| 5:30 AM to 5:59 AM | 23 (1.9%) | 8 (0.8%) |
| 6:00 AM to 6:29 AM | 315 (25.4%) | 114 (11.1%) |
| 6:30 AM to 6:59 AM | 183 (14.8%) | 149 (14.5%) |
| 7:00 AM to 7:29 AM | 92 (7.4%) | 161 (15.7%) |
| 7:30 AM to 7:59 AM | 41 (3.3%) | 220 (21.5%) |
| 8:00 AM to 8:29 AM | 198 (16.0%) | 18 (1.8%) |
| 8:30 AM to 8:59 AM | 36 (2.9%) | 36 (3.5%) |
| 9:00 AM to 9:59 AM | 57 (4.6%) | 67 (6.5%) |
| 10:00 AM to 10:59 AM | 7 (0.6%) | 0 (0.0%) |
| 11:00 AM to 11:59 AM | 20 (1.6%) | 0 (0.0%) |
| 12:00 PM to 3:59 PM | 76 (6.1%) | 60 (5.9%) |
| 4:00 PM to 11:59 PM | 41 (3.3%) | 64 (6.2%) |
| Total | 1,239 (100.0%) | 1,024 (100.0%) |
Housing Occupancy in Sawmills
Occupancy by Ownership in Sawmills
Of the total 1,941 dwellings in Sawmills, owner-occupied units account for 1,416 (73.0%), while renter-occupied units make up 525 (27.1%).
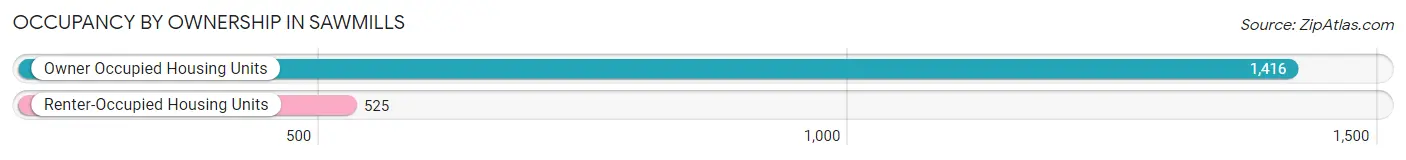
| Occupancy | # Housing Units | % Housing Units |
| Owner Occupied Housing Units | 1,416 | 73.0% |
| Renter-Occupied Housing Units | 525 | 27.1% |
| Total Occupied Housing Units | 1,941 | 100.0% |
Occupancy by Household Size in Sawmills
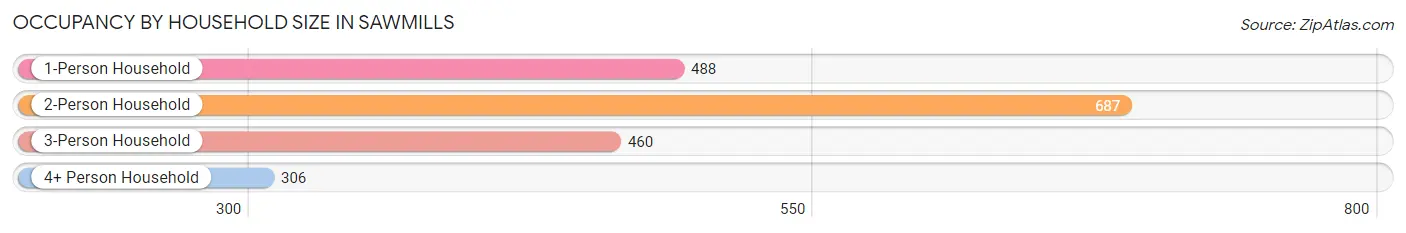
| Household Size | # Housing Units | % Housing Units |
| 1-Person Household | 488 | 25.1% |
| 2-Person Household | 687 | 35.4% |
| 3-Person Household | 460 | 23.7% |
| 4+ Person Household | 306 | 15.8% |
| Total Housing Units | 1,941 | 100.0% |
Occupancy by Ownership by Household Size in Sawmills
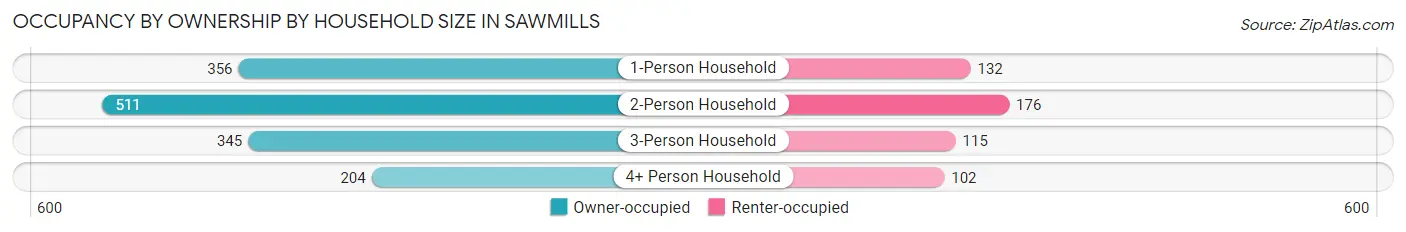
| Household Size | Owner-occupied | Renter-occupied |
| 1-Person Household | 356 (73.0%) | 132 (27.1%) |
| 2-Person Household | 511 (74.4%) | 176 (25.6%) |
| 3-Person Household | 345 (75.0%) | 115 (25.0%) |
| 4+ Person Household | 204 (66.7%) | 102 (33.3%) |
| Total Housing Units | 1,416 (73.0%) | 525 (27.1%) |
Occupancy by Educational Attainment in Sawmills
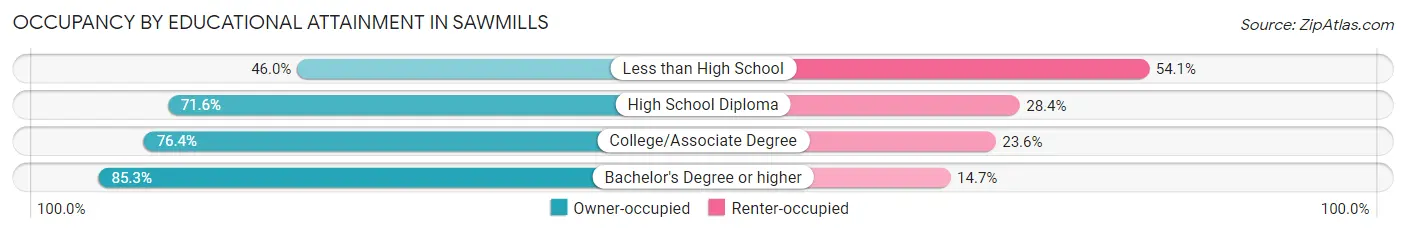
| Household Size | Owner-occupied | Renter-occupied |
| Less than High School | 119 (46.0%) | 140 (54.0%) |
| High School Diploma | 366 (71.6%) | 145 (28.4%) |
| College/Associate Degree | 582 (76.4%) | 180 (23.6%) |
| Bachelor's Degree or higher | 349 (85.3%) | 60 (14.7%) |
Occupancy by Age of Householder in Sawmills
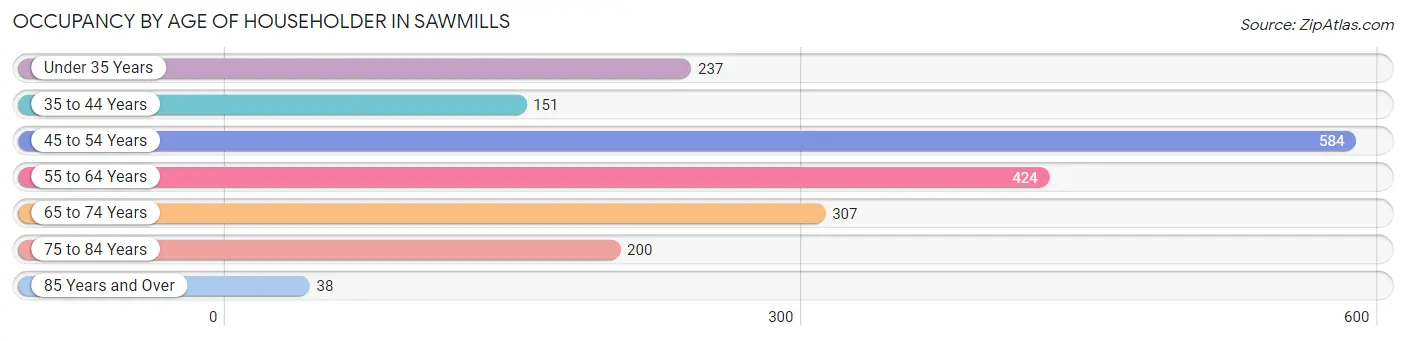
| Age Bracket | # Households | % Households |
| Under 35 Years | 237 | 12.2% |
| 35 to 44 Years | 151 | 7.8% |
| 45 to 54 Years | 584 | 30.1% |
| 55 to 64 Years | 424 | 21.8% |
| 65 to 74 Years | 307 | 15.8% |
| 75 to 84 Years | 200 | 10.3% |
| 85 Years and Over | 38 | 2.0% |
| Total | 1,941 | 100.0% |
Housing Finances in Sawmills
Median Income by Occupancy in Sawmills
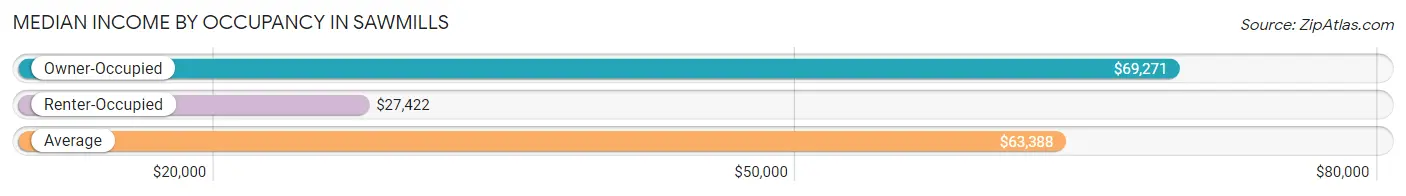
| Occupancy Type | # Households | Median Income |
| Owner-Occupied | 1,416 (73.0%) | $69,271 |
| Renter-Occupied | 525 (27.1%) | $27,422 |
| Average | 1,941 (100.0%) | $63,388 |
Occupancy by Householder Income Bracket in Sawmills
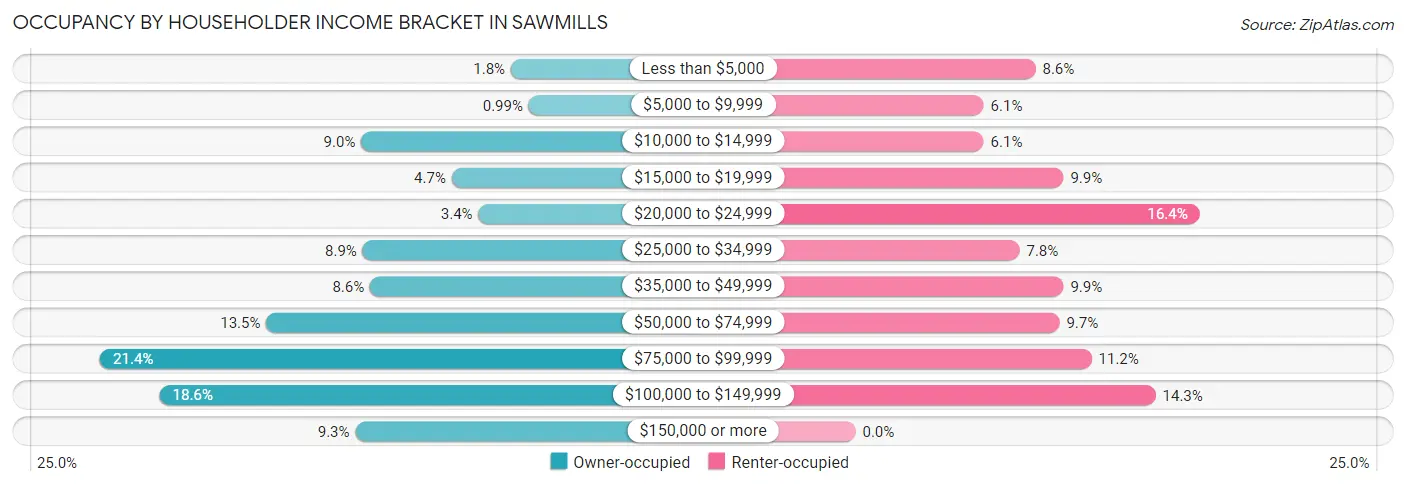
| Income Bracket | Owner-occupied | Renter-occupied |
| Less than $5,000 | 26 (1.8%) | 45 (8.6%) |
| $5,000 to $9,999 | 14 (1.0%) | 32 (6.1%) |
| $10,000 to $14,999 | 127 (9.0%) | 32 (6.1%) |
| $15,000 to $19,999 | 66 (4.7%) | 52 (9.9%) |
| $20,000 to $24,999 | 48 (3.4%) | 86 (16.4%) |
| $25,000 to $34,999 | 126 (8.9%) | 41 (7.8%) |
| $35,000 to $49,999 | 121 (8.6%) | 52 (9.9%) |
| $50,000 to $74,999 | 191 (13.5%) | 51 (9.7%) |
| $75,000 to $99,999 | 303 (21.4%) | 59 (11.2%) |
| $100,000 to $149,999 | 263 (18.6%) | 75 (14.3%) |
| $150,000 or more | 131 (9.2%) | 0 (0.0%) |
| Total | 1,416 (100.0%) | 525 (100.0%) |
Monthly Housing Cost Tiers in Sawmills
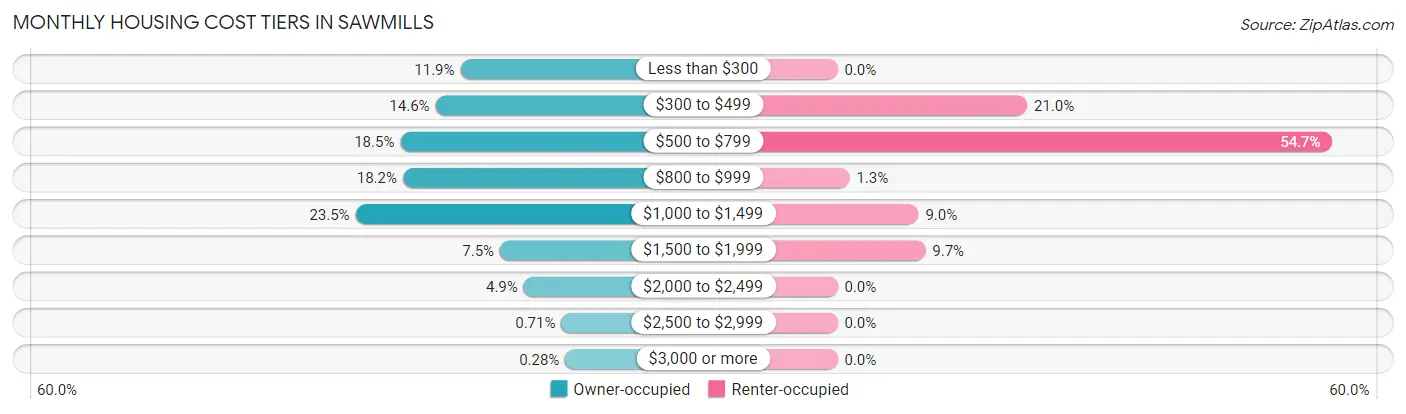
| Monthly Cost | Owner-occupied | Renter-occupied |
| Less than $300 | 168 (11.9%) | 0 (0.0%) |
| $300 to $499 | 207 (14.6%) | 110 (20.9%) |
| $500 to $799 | 262 (18.5%) | 287 (54.7%) |
| $800 to $999 | 258 (18.2%) | 7 (1.3%) |
| $1,000 to $1,499 | 332 (23.4%) | 47 (8.9%) |
| $1,500 to $1,999 | 106 (7.5%) | 51 (9.7%) |
| $2,000 to $2,499 | 69 (4.9%) | 0 (0.0%) |
| $2,500 to $2,999 | 10 (0.7%) | 0 (0.0%) |
| $3,000 or more | 4 (0.3%) | 0 (0.0%) |
| Total | 1,416 (100.0%) | 525 (100.0%) |
Physical Housing Characteristics in Sawmills
Housing Structures in Sawmills
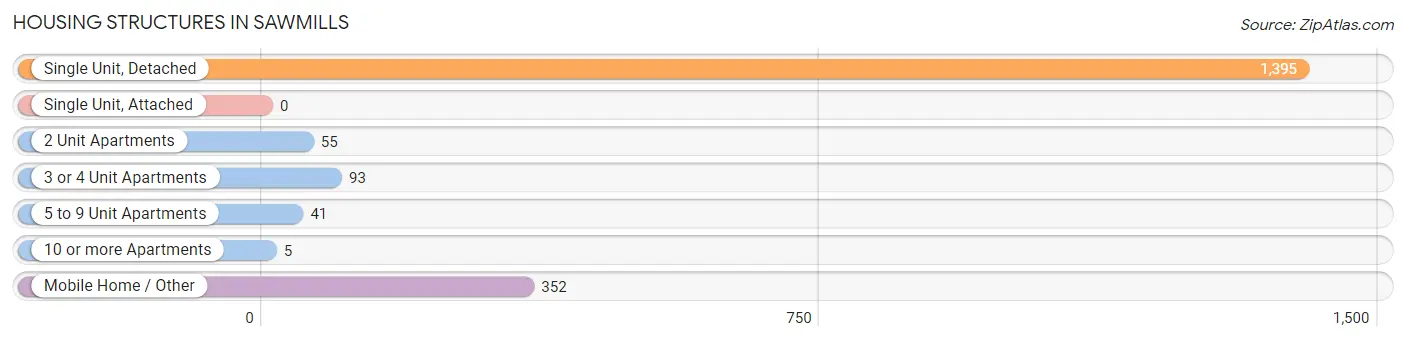
| Structure Type | # Housing Units | % Housing Units |
| Single Unit, Detached | 1,395 | 71.9% |
| Single Unit, Attached | 0 | 0.0% |
| 2 Unit Apartments | 55 | 2.8% |
| 3 or 4 Unit Apartments | 93 | 4.8% |
| 5 to 9 Unit Apartments | 41 | 2.1% |
| 10 or more Apartments | 5 | 0.3% |
| Mobile Home / Other | 352 | 18.1% |
| Total | 1,941 | 100.0% |
Housing Structures by Occupancy in Sawmills
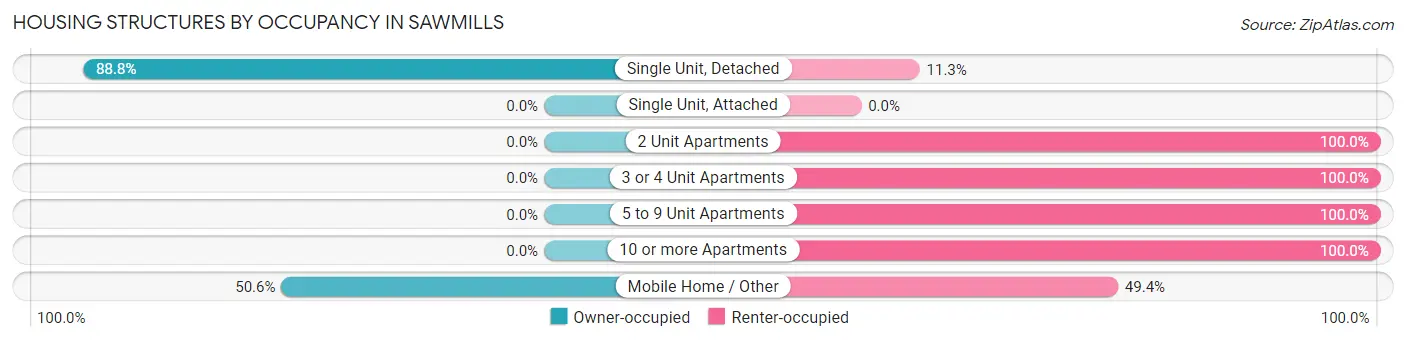
| Structure Type | Owner-occupied | Renter-occupied |
| Single Unit, Detached | 1,238 (88.7%) | 157 (11.3%) |
| Single Unit, Attached | 0 (0.0%) | 0 (0.0%) |
| 2 Unit Apartments | 0 (0.0%) | 55 (100.0%) |
| 3 or 4 Unit Apartments | 0 (0.0%) | 93 (100.0%) |
| 5 to 9 Unit Apartments | 0 (0.0%) | 41 (100.0%) |
| 10 or more Apartments | 0 (0.0%) | 5 (100.0%) |
| Mobile Home / Other | 178 (50.6%) | 174 (49.4%) |
| Total | 1,416 (73.0%) | 525 (27.1%) |
Housing Structures by Number of Rooms in Sawmills
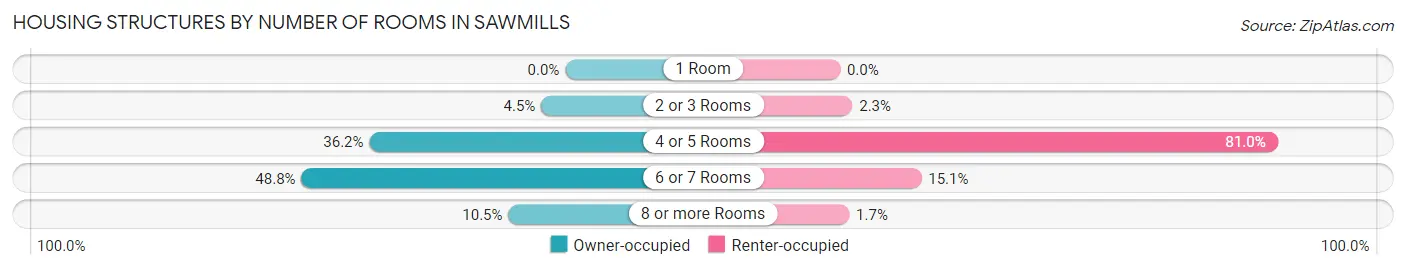
| Number of Rooms | Owner-occupied | Renter-occupied |
| 1 Room | 0 (0.0%) | 0 (0.0%) |
| 2 or 3 Rooms | 63 (4.4%) | 12 (2.3%) |
| 4 or 5 Rooms | 513 (36.2%) | 425 (80.9%) |
| 6 or 7 Rooms | 691 (48.8%) | 79 (15.0%) |
| 8 or more Rooms | 149 (10.5%) | 9 (1.7%) |
| Total | 1,416 (100.0%) | 525 (100.0%) |
Housing Structure by Heating Type in Sawmills
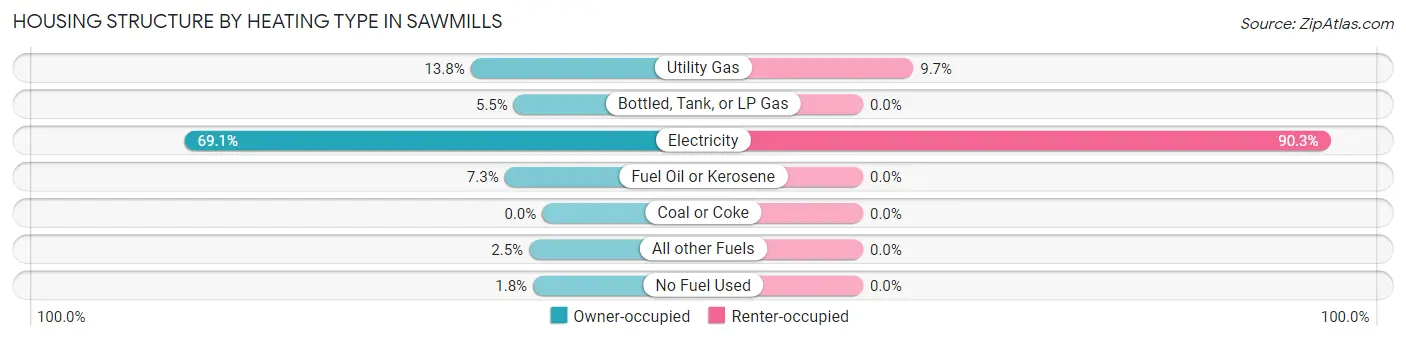
| Heating Type | Owner-occupied | Renter-occupied |
| Utility Gas | 196 (13.8%) | 51 (9.7%) |
| Bottled, Tank, or LP Gas | 78 (5.5%) | 0 (0.0%) |
| Electricity | 978 (69.1%) | 474 (90.3%) |
| Fuel Oil or Kerosene | 103 (7.3%) | 0 (0.0%) |
| Coal or Coke | 0 (0.0%) | 0 (0.0%) |
| All other Fuels | 36 (2.5%) | 0 (0.0%) |
| No Fuel Used | 25 (1.8%) | 0 (0.0%) |
| Total | 1,416 (100.0%) | 525 (100.0%) |
Household Vehicle Usage in Sawmills
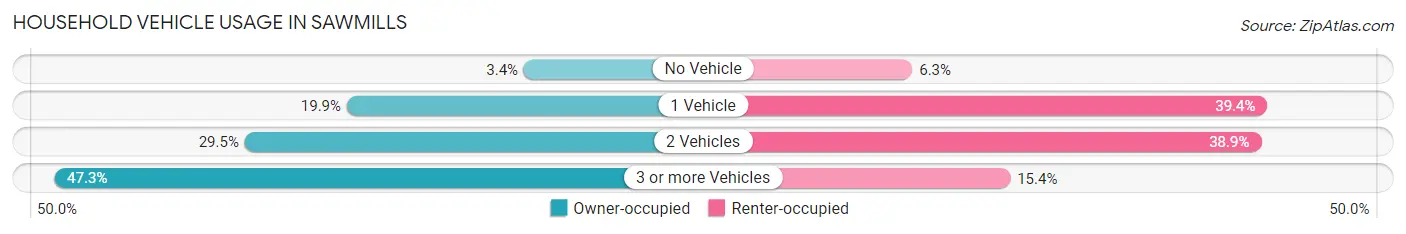
| Vehicles per Household | Owner-occupied | Renter-occupied |
| No Vehicle | 48 (3.4%) | 33 (6.3%) |
| 1 Vehicle | 282 (19.9%) | 207 (39.4%) |
| 2 Vehicles | 417 (29.4%) | 204 (38.9%) |
| 3 or more Vehicles | 669 (47.2%) | 81 (15.4%) |
| Total | 1,416 (100.0%) | 525 (100.0%) |
Real Estate & Mortgages in Sawmills
Real Estate and Mortgage Overview in Sawmills
| Characteristic | Without Mortgage | With Mortgage |
| Housing Units | 501 | 915 |
| Median Property Value | $121,300 | $178,200 |
| Median Household Income | $31,991 | $108 |
| Monthly Housing Costs | $340 | $0 |
| Real Estate Taxes | $1,036 | $0 |
Property Value by Mortgage Status in Sawmills
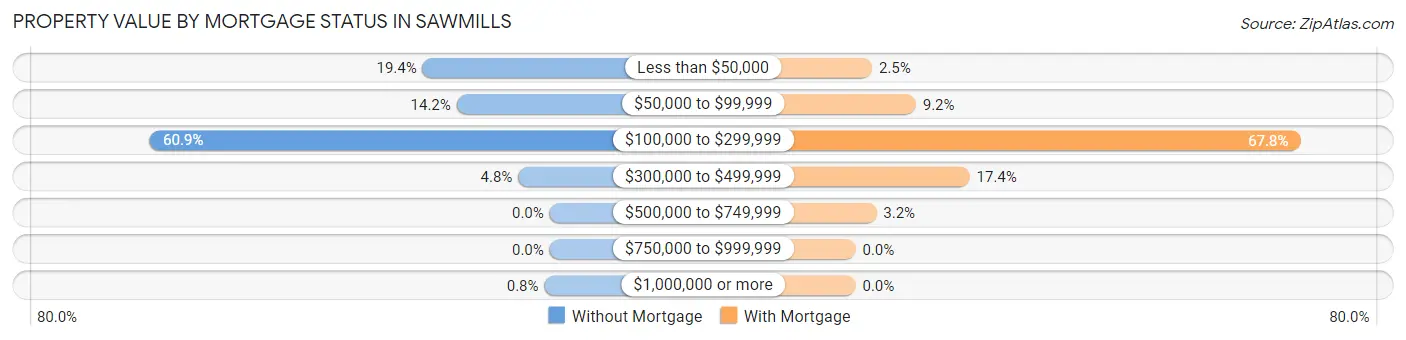
| Property Value | Without Mortgage | With Mortgage |
| Less than $50,000 | 97 (19.4%) | 23 (2.5%) |
| $50,000 to $99,999 | 71 (14.2%) | 84 (9.2%) |
| $100,000 to $299,999 | 305 (60.9%) | 620 (67.8%) |
| $300,000 to $499,999 | 24 (4.8%) | 159 (17.4%) |
| $500,000 to $749,999 | 0 (0.0%) | 29 (3.2%) |
| $750,000 to $999,999 | 0 (0.0%) | 0 (0.0%) |
| $1,000,000 or more | 4 (0.8%) | 0 (0.0%) |
| Total | 501 (100.0%) | 915 (100.0%) |
Household Income by Mortgage Status in Sawmills
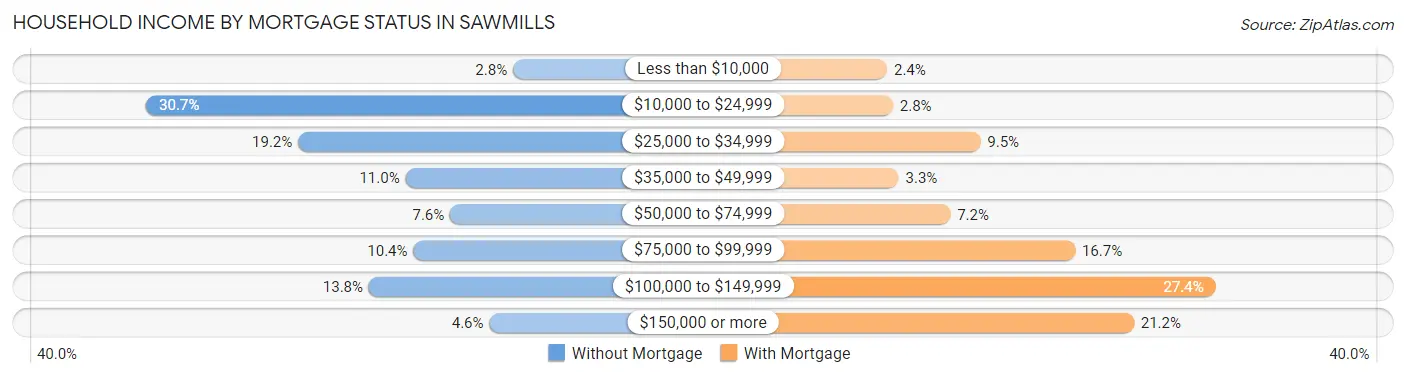
| Household Income | Without Mortgage | With Mortgage |
| Less than $10,000 | 14 (2.8%) | 22 (2.4%) |
| $10,000 to $24,999 | 154 (30.7%) | 26 (2.8%) |
| $25,000 to $34,999 | 96 (19.2%) | 87 (9.5%) |
| $35,000 to $49,999 | 55 (11.0%) | 30 (3.3%) |
| $50,000 to $74,999 | 38 (7.6%) | 66 (7.2%) |
| $75,000 to $99,999 | 52 (10.4%) | 153 (16.7%) |
| $100,000 to $149,999 | 69 (13.8%) | 251 (27.4%) |
| $150,000 or more | 23 (4.6%) | 194 (21.2%) |
| Total | 501 (100.0%) | 915 (100.0%) |
Property Value to Household Income Ratio in Sawmills
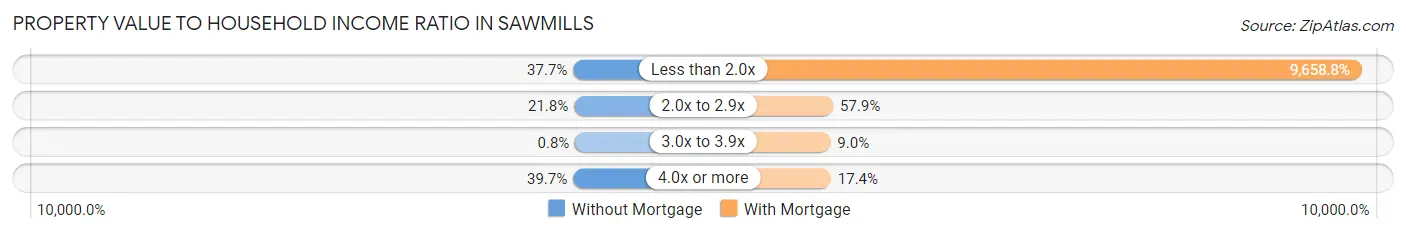
| Value-to-Income Ratio | Without Mortgage | With Mortgage |
| Less than 2.0x | 189 (37.7%) | 88,378 (9,658.8%) |
| 2.0x to 2.9x | 109 (21.8%) | 530 (57.9%) |
| 3.0x to 3.9x | 4 (0.8%) | 82 (9.0%) |
| 4.0x or more | 199 (39.7%) | 159 (17.4%) |
| Total | 501 (100.0%) | 915 (100.0%) |
Real Estate Taxes by Mortgage Status in Sawmills
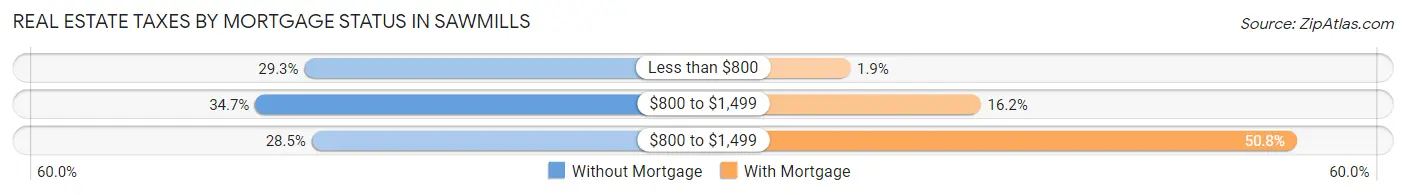
| Property Taxes | Without Mortgage | With Mortgage |
| Less than $800 | 147 (29.3%) | 17 (1.9%) |
| $800 to $1,499 | 174 (34.7%) | 148 (16.2%) |
| $800 to $1,499 | 143 (28.5%) | 465 (50.8%) |
| Total | 501 (100.0%) | 915 (100.0%) |
Health & Disability in Sawmills
Health Insurance Coverage by Age in Sawmills
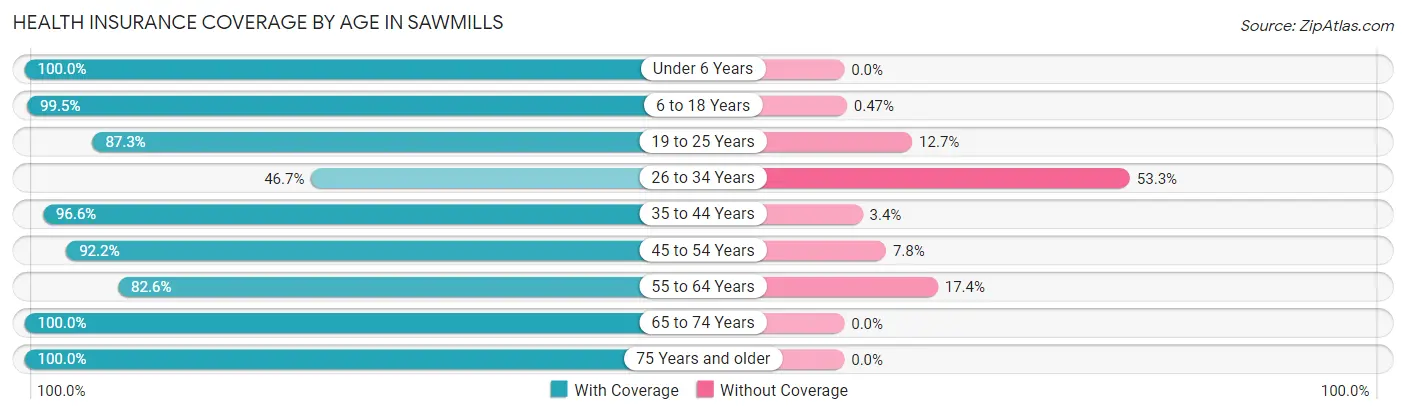
| Age Bracket | With Coverage | Without Coverage |
| Under 6 Years | 116 (100.0%) | 0 (0.0%) |
| 6 to 18 Years | 843 (99.5%) | 4 (0.5%) |
| 19 to 25 Years | 352 (87.3%) | 51 (12.7%) |
| 26 to 34 Years | 294 (46.7%) | 335 (53.3%) |
| 35 to 44 Years | 367 (96.6%) | 13 (3.4%) |
| 45 to 54 Years | 949 (92.2%) | 80 (7.8%) |
| 55 to 64 Years | 620 (82.6%) | 131 (17.4%) |
| 65 to 74 Years | 539 (100.0%) | 0 (0.0%) |
| 75 Years and older | 319 (100.0%) | 0 (0.0%) |
| Total | 4,399 (87.7%) | 614 (12.2%) |
Health Insurance Coverage by Citizenship Status in Sawmills
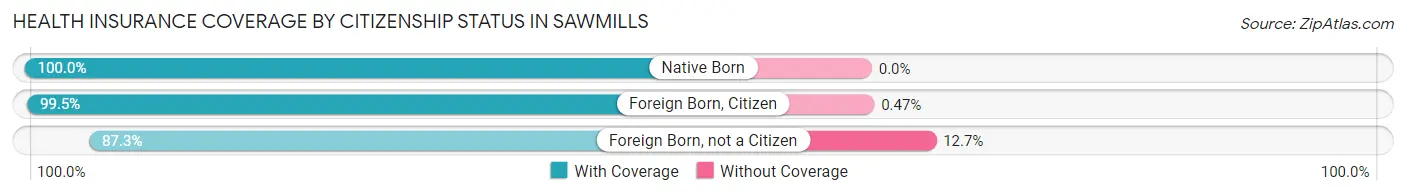
| Citizenship Status | With Coverage | Without Coverage |
| Native Born | 116 (100.0%) | 0 (0.0%) |
| Foreign Born, Citizen | 843 (99.5%) | 4 (0.5%) |
| Foreign Born, not a Citizen | 352 (87.3%) | 51 (12.7%) |
Health Insurance Coverage by Household Income in Sawmills
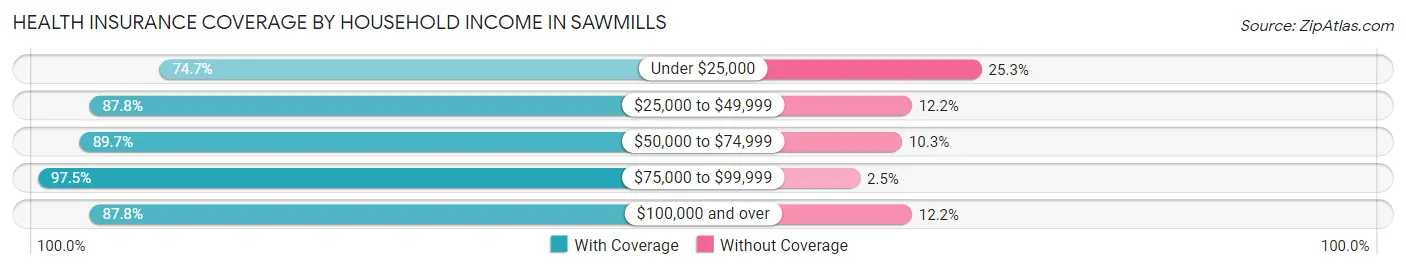
| Household Income | With Coverage | Without Coverage |
| Under $25,000 | 701 (74.7%) | 237 (25.3%) |
| $25,000 to $49,999 | 621 (87.8%) | 86 (12.2%) |
| $50,000 to $74,999 | 503 (89.7%) | 58 (10.3%) |
| $75,000 to $99,999 | 1,097 (97.5%) | 28 (2.5%) |
| $100,000 and over | 1,477 (87.8%) | 205 (12.2%) |
Public vs Private Health Insurance Coverage by Age in Sawmills
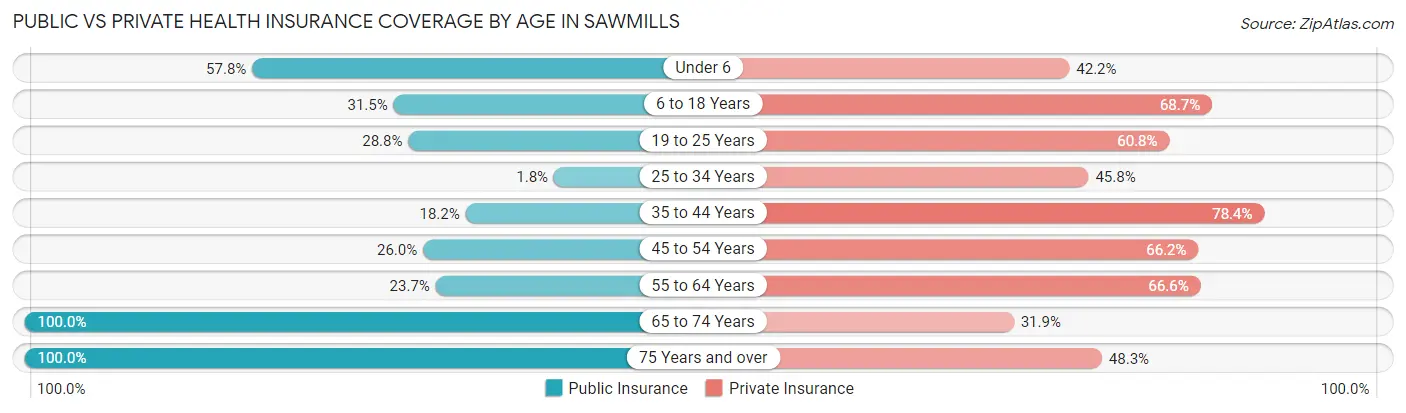
| Age Bracket | Public Insurance | Private Insurance |
| Under 6 | 67 (57.8%) | 49 (42.2%) |
| 6 to 18 Years | 267 (31.5%) | 582 (68.7%) |
| 19 to 25 Years | 116 (28.8%) | 245 (60.8%) |
| 25 to 34 Years | 11 (1.8%) | 288 (45.8%) |
| 35 to 44 Years | 69 (18.2%) | 298 (78.4%) |
| 45 to 54 Years | 268 (26.0%) | 681 (66.2%) |
| 55 to 64 Years | 178 (23.7%) | 500 (66.6%) |
| 65 to 74 Years | 539 (100.0%) | 172 (31.9%) |
| 75 Years and over | 319 (100.0%) | 154 (48.3%) |
| Total | 1,834 (36.6%) | 2,969 (59.2%) |
Disability Status by Sex by Age in Sawmills
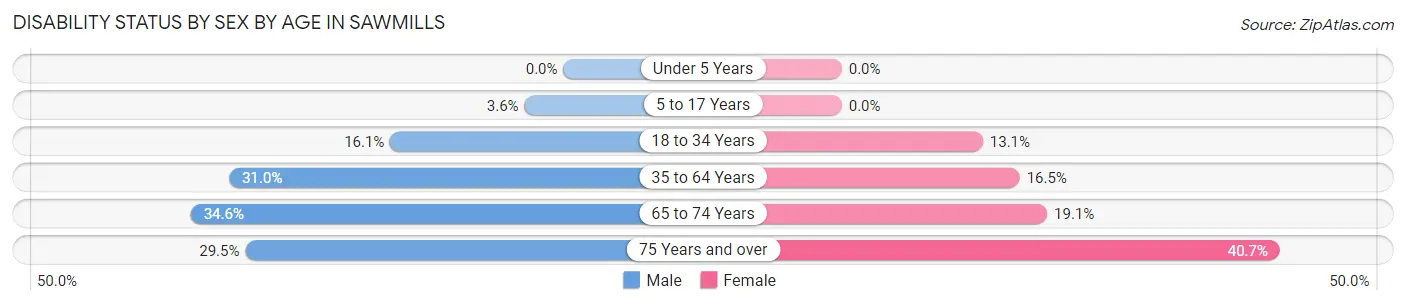
| Age Bracket | Male | Female |
| Under 5 Years | 0 (0.0%) | 0 (0.0%) |
| 5 to 17 Years | 21 (3.6%) | 0 (0.0%) |
| 18 to 34 Years | 113 (16.1%) | 47 (13.1%) |
| 35 to 64 Years | 377 (31.0%) | 156 (16.5%) |
| 65 to 74 Years | 83 (34.6%) | 57 (19.1%) |
| 75 Years and over | 31 (29.5%) | 87 (40.6%) |
Disability Class by Sex by Age in Sawmills
Disability Class: Hearing Difficulty
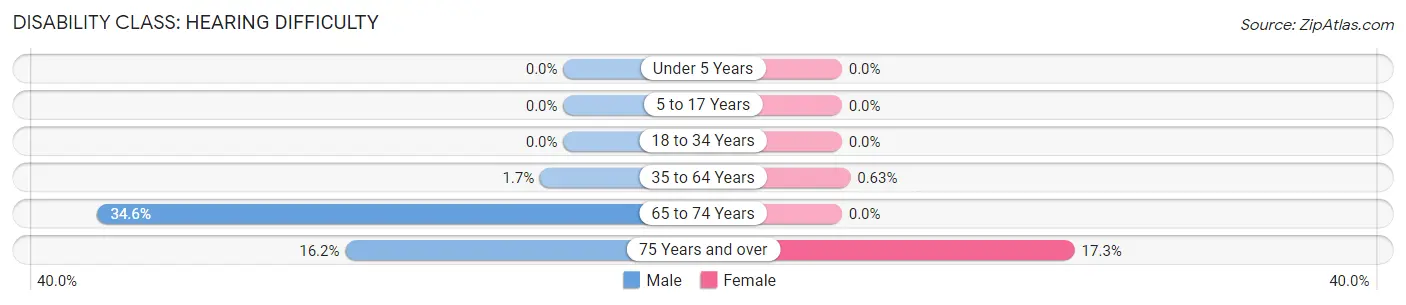
| Age Bracket | Male | Female |
| Under 5 Years | 0 (0.0%) | 0 (0.0%) |
| 5 to 17 Years | 0 (0.0%) | 0 (0.0%) |
| 18 to 34 Years | 0 (0.0%) | 0 (0.0%) |
| 35 to 64 Years | 21 (1.7%) | 6 (0.6%) |
| 65 to 74 Years | 83 (34.6%) | 0 (0.0%) |
| 75 Years and over | 17 (16.2%) | 37 (17.3%) |
Disability Class: Vision Difficulty
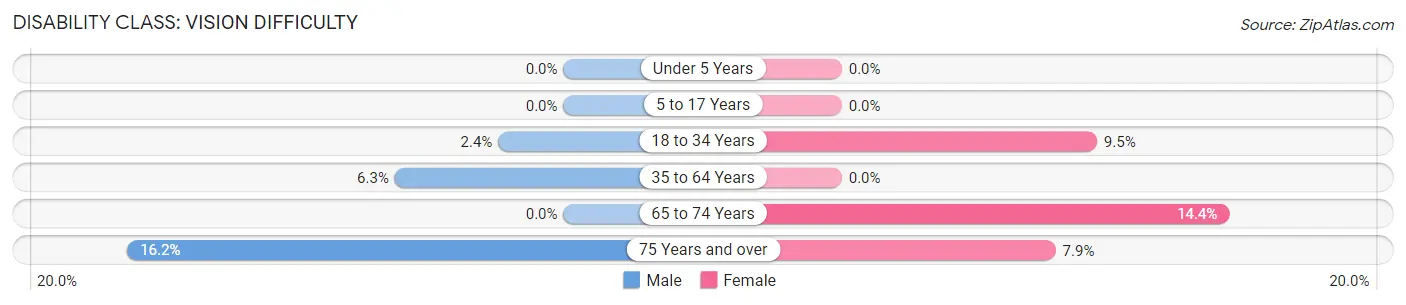
| Age Bracket | Male | Female |
| Under 5 Years | 0 (0.0%) | 0 (0.0%) |
| 5 to 17 Years | 0 (0.0%) | 0 (0.0%) |
| 18 to 34 Years | 17 (2.4%) | 34 (9.5%) |
| 35 to 64 Years | 76 (6.3%) | 0 (0.0%) |
| 65 to 74 Years | 0 (0.0%) | 43 (14.4%) |
| 75 Years and over | 17 (16.2%) | 17 (7.9%) |
Disability Class: Cognitive Difficulty
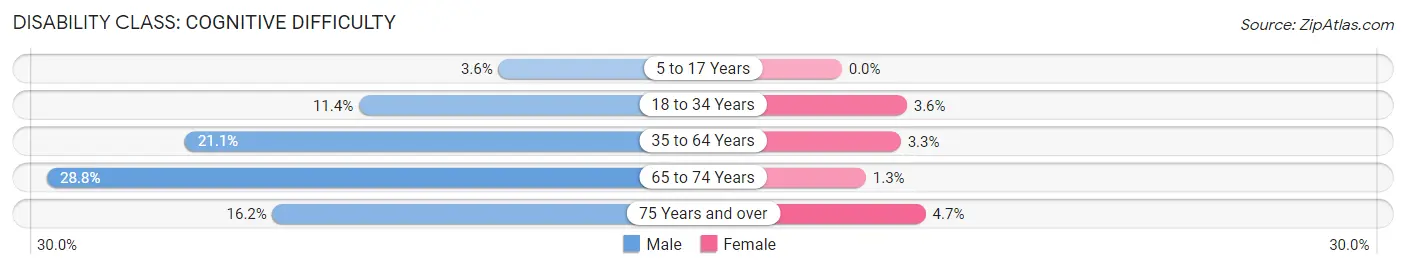
| Age Bracket | Male | Female |
| 5 to 17 Years | 21 (3.6%) | 0 (0.0%) |
| 18 to 34 Years | 80 (11.4%) | 13 (3.6%) |
| 35 to 64 Years | 256 (21.1%) | 31 (3.3%) |
| 65 to 74 Years | 69 (28.7%) | 4 (1.3%) |
| 75 Years and over | 17 (16.2%) | 10 (4.7%) |
Disability Class: Ambulatory Difficulty
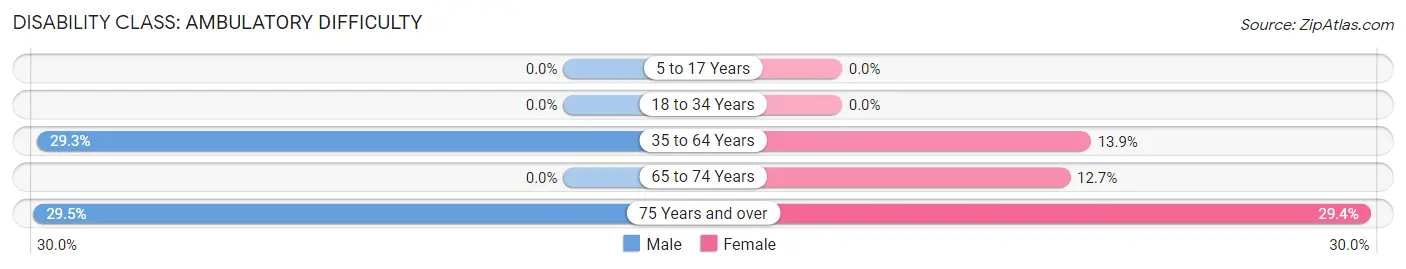
| Age Bracket | Male | Female |
| 5 to 17 Years | 0 (0.0%) | 0 (0.0%) |
| 18 to 34 Years | 0 (0.0%) | 0 (0.0%) |
| 35 to 64 Years | 356 (29.3%) | 131 (13.9%) |
| 65 to 74 Years | 0 (0.0%) | 38 (12.7%) |
| 75 Years and over | 31 (29.5%) | 63 (29.4%) |
Disability Class: Self-Care Difficulty
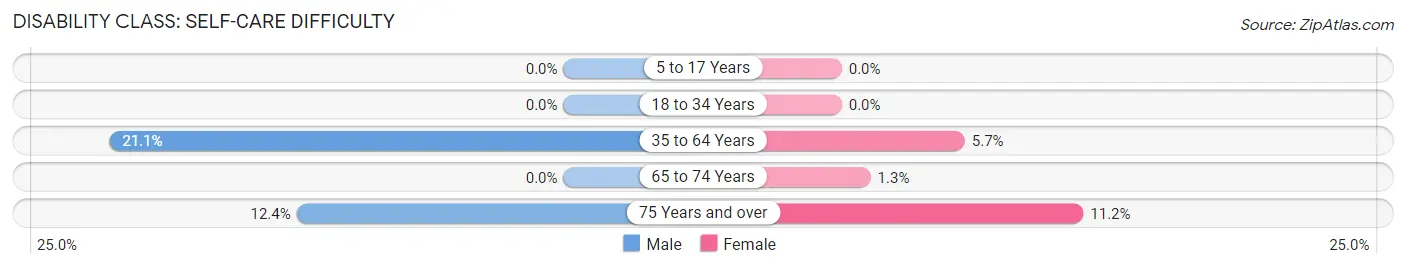
| Age Bracket | Male | Female |
| 5 to 17 Years | 0 (0.0%) | 0 (0.0%) |
| 18 to 34 Years | 0 (0.0%) | 0 (0.0%) |
| 35 to 64 Years | 256 (21.1%) | 54 (5.7%) |
| 65 to 74 Years | 0 (0.0%) | 4 (1.3%) |
| 75 Years and over | 13 (12.4%) | 24 (11.2%) |
Technology Access in Sawmills
Computing Device Access in Sawmills
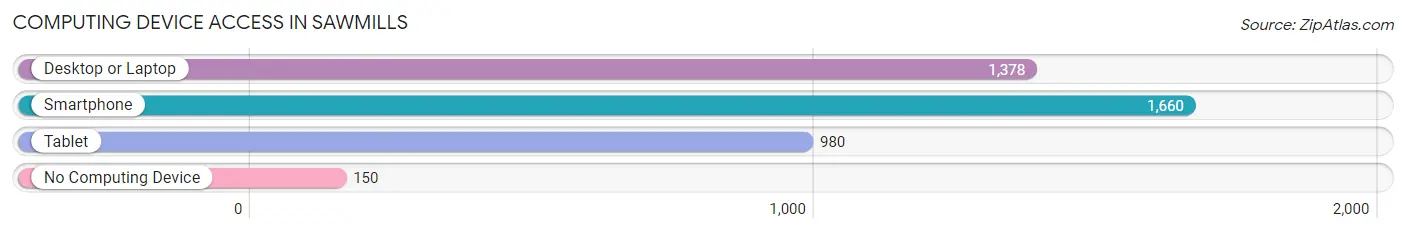
| Device Type | # Households | % Households |
| Desktop or Laptop | 1,378 | 71.0% |
| Smartphone | 1,660 | 85.5% |
| Tablet | 980 | 50.5% |
| No Computing Device | 150 | 7.7% |
| Total | 1,941 | 100.0% |
Internet Access in Sawmills
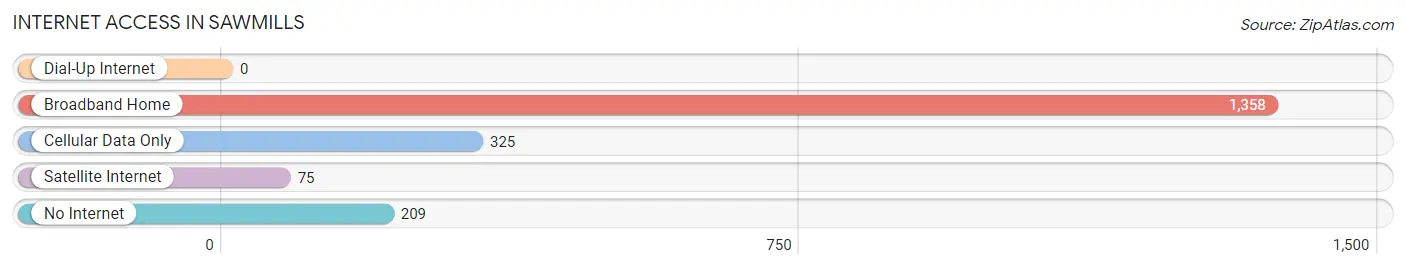
| Internet Type | # Households | % Households |
| Dial-Up Internet | 0 | 0.0% |
| Broadband Home | 1,358 | 70.0% |
| Cellular Data Only | 325 | 16.7% |
| Satellite Internet | 75 | 3.9% |
| No Internet | 209 | 10.8% |
| Total | 1,941 | 100.0% |
Sawmills Summary
Sawmills is an unincorporated community located in Caldwell County, North Carolina. It is situated in the foothills of the Blue Ridge Mountains, approximately 20 miles northwest of Hickory and 25 miles northeast of Asheville. The community is named for the numerous sawmills that were once located in the area.
History
The area that is now Sawmills was first settled in the late 1700s by German and Scots-Irish immigrants. The first sawmill was built in the area in 1820, and the community was officially established in 1845. The sawmills provided lumber for the construction of homes and businesses in the area, as well as for the railroad that was built in the late 1800s.
In the early 1900s, the community began to grow and prosper. The sawmills provided employment for many of the residents, and the railroad provided transportation for goods and people. The community also had a post office, a general store, a blacksmith shop, and a school.
In the 1950s, the sawmills began to close due to the increasing cost of lumber and the availability of cheaper lumber from other sources. This caused the population of Sawmills to decline, and by the 1970s, the community was largely abandoned.
Geography
Sawmills is located in the foothills of the Blue Ridge Mountains, approximately 20 miles northwest of Hickory and 25 miles northeast of Asheville. The community is situated at an elevation of 1,400 feet and is surrounded by rolling hills and forests. The Catawba River runs through the area, providing a source of water for the community.
Economy
The economy of Sawmills is largely based on tourism. The area is home to several campgrounds, hiking trails, and other outdoor recreational activities. The community also has several restaurants, antique stores, and other small businesses.
Demographics
As of the 2010 census, the population of Sawmills was 1,845. The racial makeup of the community was 97.3% White, 0.7% African American, 0.3% Native American, 0.2% Asian, and 1.5% from other races. The median household income was $37,917, and the median age was 44.
Conclusion
Sawmills is an unincorporated community located in Caldwell County, North Carolina. It is situated in the foothills of the Blue Ridge Mountains, approximately 20 miles northwest of Hickory and 25 miles northeast of Asheville. The community is named for the numerous sawmills that were once located in the area. The economy of Sawmills is largely based on tourism, and the population of the community was 1,845 as of the 2010 census.
Common Questions
What is the Total Population of Sawmills?
Total Population of Sawmills is 5,026.
What is the Total Male Population of Sawmills?
Total Male Population of Sawmills is 2,921.
What is the Total Female Population of Sawmills?
Total Female Population of Sawmills is 2,105.
What is the Ratio of Males per 100 Females in Sawmills?
There are 138.76 Males per 100 Females in Sawmills.
What is the Ratio of Females per 100 Males in Sawmills?
There are 72.06 Females per 100 Males in Sawmills.
What is the Median Population Age in Sawmills?
Median Population Age in Sawmills is 47.5 Years.
What is the Average Family Size in Sawmills
Average Family Size in Sawmills is 3.0 People.
What is the Average Household Size in Sawmills
Average Household Size in Sawmills is 2.6 People.
What is Per Capita Income in Sawmills?
Per Capita income in Sawmills is $28,858.
What is the Median Family Income in Sawmills?
Median Family Income in Sawmills is $81,518.
What is the Median Household income in Sawmills?
Median Household Income in Sawmills is $63,388.
What is Income or Wage Gap in Sawmills?
Income or Wage Gap in Sawmills is 6.5%.
Women in Sawmills earn 93.5 cents for every dollar earned by a man.
What is Family Income Deficit in Sawmills?
Family Income Deficit in Sawmills is $11,458.
Families that are below poverty line in Sawmills earn $11,458 less on average than the poverty threshold level.
What is Inequality or Gini Index in Sawmills?
Inequality or Gini Index in Sawmills is 0.43.
How Large is the Labor Force in Sawmills?
There are 2,569 People in the Labor Forcein in Sawmills.
What is the Percentage of People in the Labor Force in Sawmills?
58.3% of People are in the Labor Force in Sawmills.
What is the Unemployment Rate in Sawmills?
Unemployment Rate in Sawmills is 8.0%.