Lowesville, NC
Lowesville Map
Lowesville Overview
3,567
TOTAL POPULATION
1,888
MALE POPULATION
1,679
FEMALE POPULATION
112.45
MALES / 100 FEMALES
88.93
FEMALES / 100 MALES
43.4
MEDIAN AGE
2.9
AVG FAMILY SIZE
2.6
AVG HOUSEHOLD SIZE
$50,409
PER CAPITA INCOME
$114,738
AVG FAMILY INCOME
$113,086
AVG HOUSEHOLD INCOME
24.3%
WAGE / INCOME GAP [ % ]
75.7¢/ $1
WAGE / INCOME GAP [ $ ]
0.37
INEQUALITY / GINI INDEX
2,056
LABOR FORCE [ PEOPLE ]
72.2%
PERCENT IN LABOR FORCE
2.2%
UNEMPLOYMENT RATE
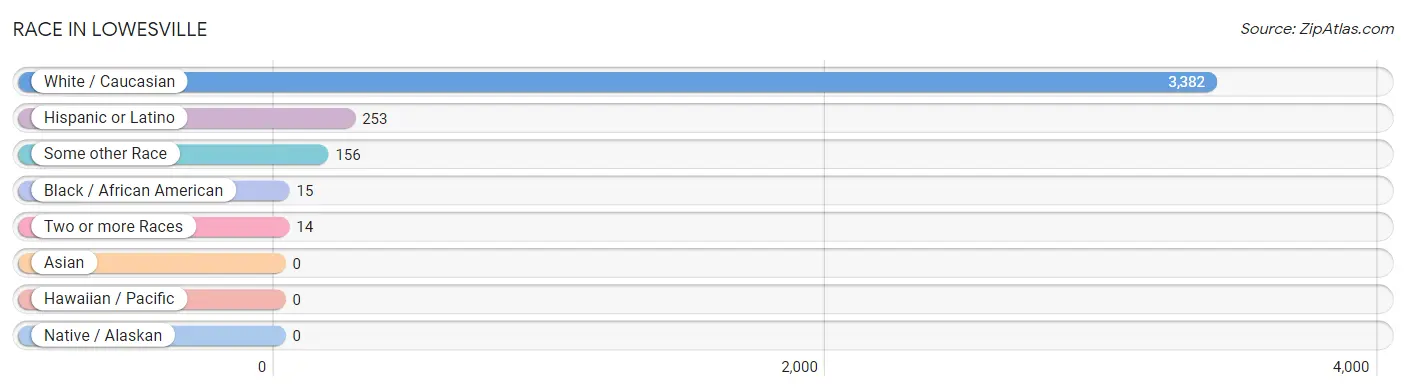
Race in Lowesville
The most populous races in Lowesville are White / Caucasian (3,382 | 94.8%), Hispanic or Latino (253 | 7.1%), and Some other Race (156 | 4.4%).
| Race | # Population | % Population |
| Asian | 0 | 0.0% |
| Black / African American | 15 | 0.4% |
| Hawaiian / Pacific | 0 | 0.0% |
| Hispanic or Latino | 253 | 7.1% |
| Native / Alaskan | 0 | 0.0% |
| White / Caucasian | 3,382 | 94.8% |
| Two or more Races | 14 | 0.4% |
| Some other Race | 156 | 4.4% |
| Total | 3,567 | 100.0% |
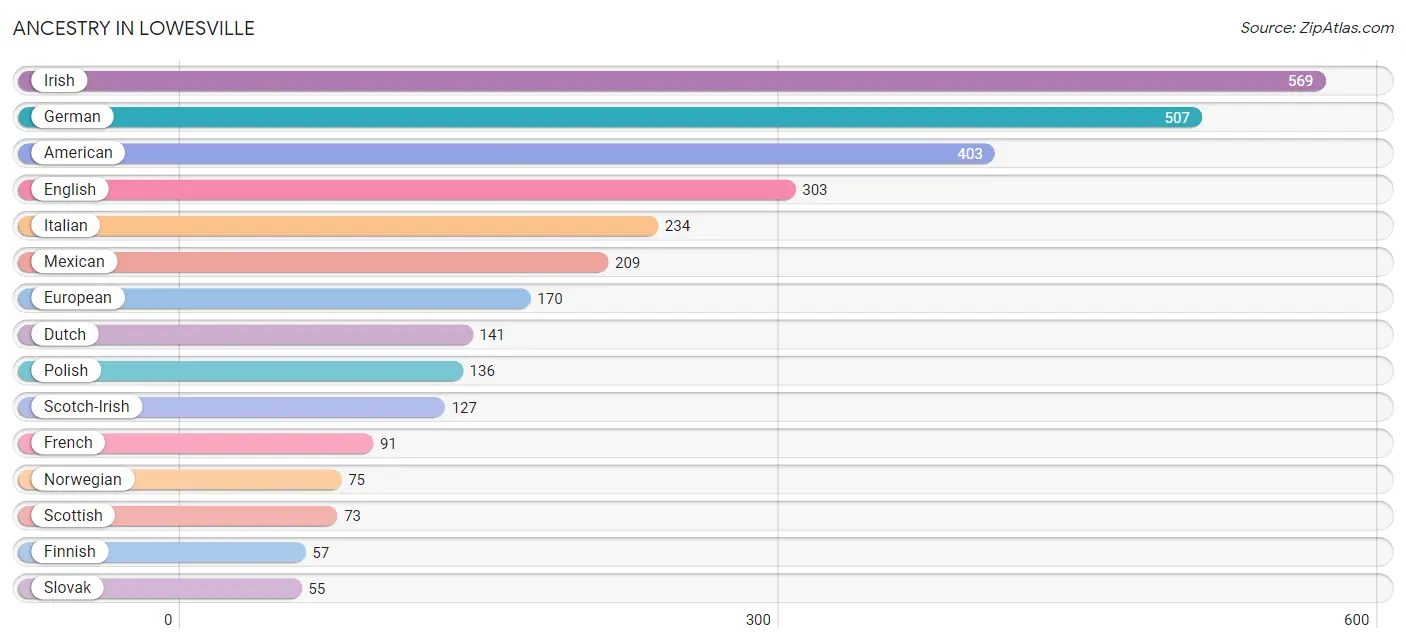
Ancestry in Lowesville
The most populous ancestries reported in Lowesville are Irish (569 | 16.0%), German (507 | 14.2%), American (403 | 11.3%), English (303 | 8.5%), and Italian (234 | 6.6%), together accounting for 56.5% of all Lowesville residents.
| Ancestry | # Population | % Population |
| American | 403 | 11.3% |
| British | 16 | 0.4% |
| Canadian | 10 | 0.3% |
| Czech | 13 | 0.4% |
| Dominican | 30 | 0.8% |
| Dutch | 141 | 4.0% |
| English | 303 | 8.5% |
| European | 170 | 4.8% |
| Finnish | 57 | 1.6% |
| French | 91 | 2.5% |
| German | 507 | 14.2% |
| Greek | 22 | 0.6% |
| Irish | 569 | 16.0% |
| Italian | 234 | 6.6% |
| Mexican | 209 | 5.9% |
| Norwegian | 75 | 2.1% |
| Pennsylvania German | 6 | 0.2% |
| Polish | 136 | 3.8% |
| Portuguese | 6 | 0.2% |
| Puerto Rican | 14 | 0.4% |
| Russian | 7 | 0.2% |
| Scotch-Irish | 127 | 3.6% |
| Scottish | 73 | 2.1% |
| Slovak | 55 | 1.5% |
| Swedish | 44 | 1.2% |
| Welsh | 11 | 0.3% | View All 26 Rows |
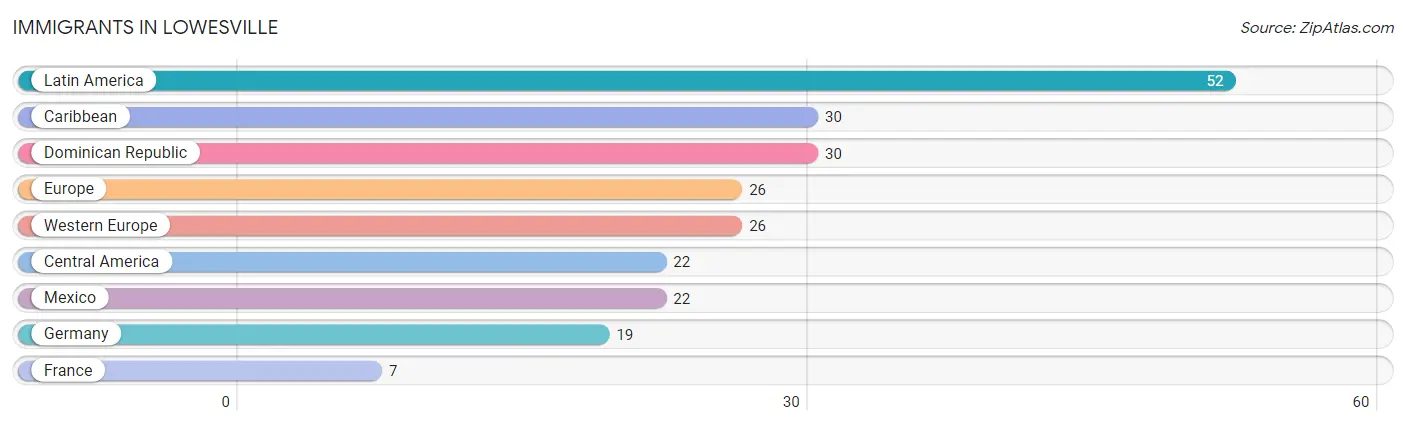
Immigrants in Lowesville
The most numerous immigrant groups reported in Lowesville came from Latin America (52 | 1.5%), Caribbean (30 | 0.8%), Dominican Republic (30 | 0.8%), Europe (26 | 0.7%), and Western Europe (26 | 0.7%), together accounting for 4.6% of all Lowesville residents.
| Immigration Origin | # Population | % Population |
| Caribbean | 30 | 0.8% |
| Central America | 22 | 0.6% |
| Dominican Republic | 30 | 0.8% |
| Europe | 26 | 0.7% |
| France | 7 | 0.2% |
| Germany | 19 | 0.5% |
| Latin America | 52 | 1.5% |
| Mexico | 22 | 0.6% |
| Western Europe | 26 | 0.7% | View All 9 Rows |
Sex and Age in Lowesville
Sex and Age in Lowesville
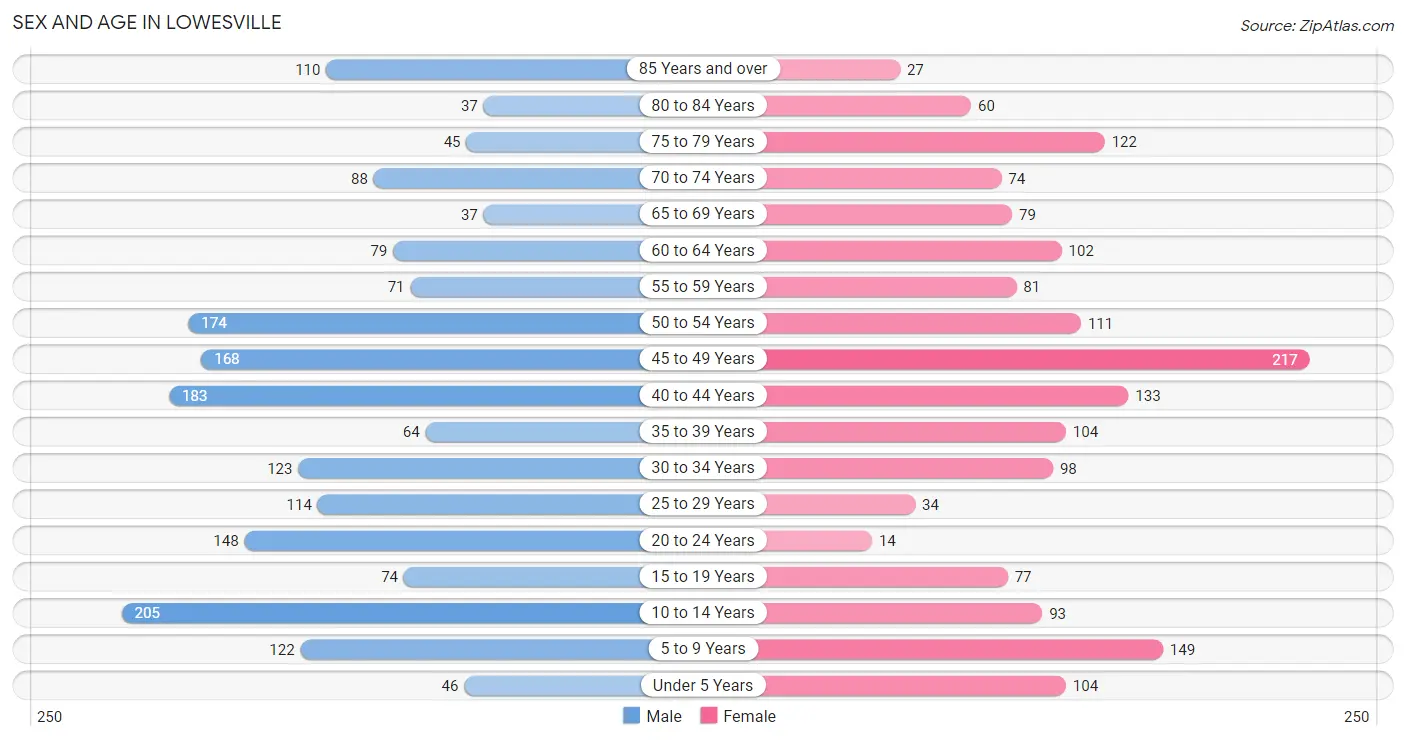
The most populous age groups in Lowesville are 10 to 14 Years (205 | 10.9%) for men and 45 to 49 Years (217 | 12.9%) for women.
| Age Bracket | Male | Female |
| Under 5 Years | 46 (2.4%) | 104 (6.2%) |
| 5 to 9 Years | 122 (6.5%) | 149 (8.9%) |
| 10 to 14 Years | 205 (10.9%) | 93 (5.5%) |
| 15 to 19 Years | 74 (3.9%) | 77 (4.6%) |
| 20 to 24 Years | 148 (7.8%) | 14 (0.8%) |
| 25 to 29 Years | 114 (6.0%) | 34 (2.0%) |
| 30 to 34 Years | 123 (6.5%) | 98 (5.8%) |
| 35 to 39 Years | 64 (3.4%) | 104 (6.2%) |
| 40 to 44 Years | 183 (9.7%) | 133 (7.9%) |
| 45 to 49 Years | 168 (8.9%) | 217 (12.9%) |
| 50 to 54 Years | 174 (9.2%) | 111 (6.6%) |
| 55 to 59 Years | 71 (3.8%) | 81 (4.8%) |
| 60 to 64 Years | 79 (4.2%) | 102 (6.1%) |
| 65 to 69 Years | 37 (2.0%) | 79 (4.7%) |
| 70 to 74 Years | 88 (4.7%) | 74 (4.4%) |
| 75 to 79 Years | 45 (2.4%) | 122 (7.3%) |
| 80 to 84 Years | 37 (2.0%) | 60 (3.6%) |
| 85 Years and over | 110 (5.8%) | 27 (1.6%) |
| Total | 1,888 (100.0%) | 1,679 (100.0%) |
Families and Households in Lowesville
Median Family Size in Lowesville
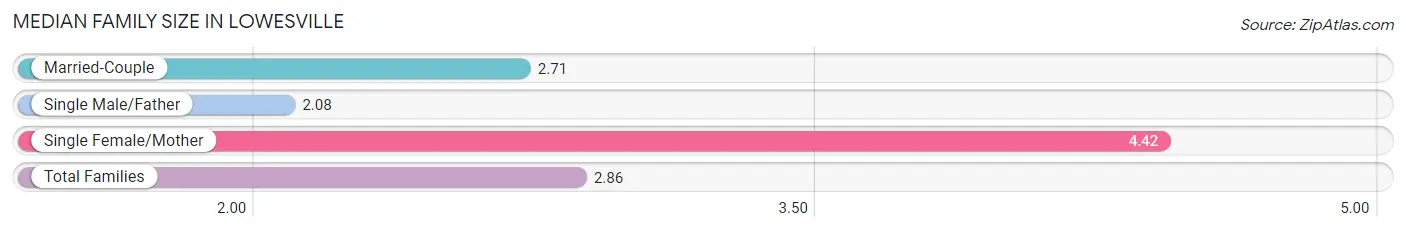
The median family size in Lowesville is 2.86 persons per family, with single female/mother families (123 | 10.8%) accounting for the largest median family size of 4.42 persons per family. On the other hand, single male/father families (62 | 5.4%) represent the smallest median family size with 2.08 persons per family.
| Family Type | # Families | Family Size |
| Married-Couple | 956 (83.8%) | 2.71 |
| Single Male/Father | 62 (5.4%) | 2.08 |
| Single Female/Mother | 123 (10.8%) | 4.42 |
| Total Families | 1,141 (100.0%) | 2.86 |
Median Household Size in Lowesville
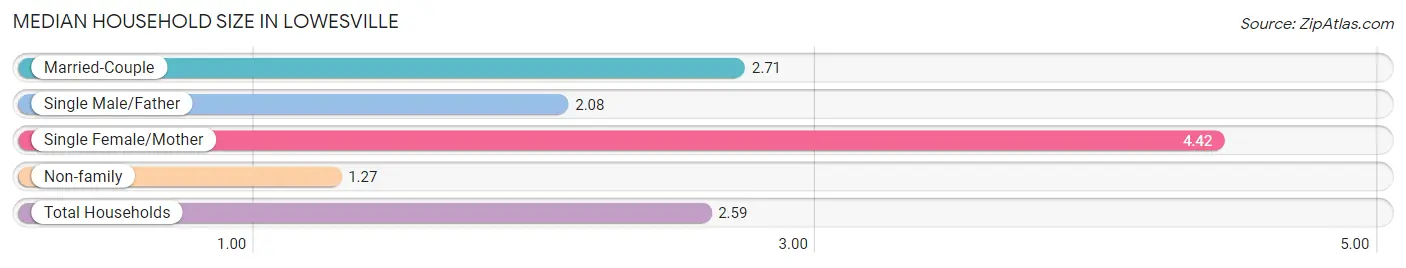
The median household size in Lowesville is 2.59 persons per household, with single female/mother households (123 | 8.9%) accounting for the largest median household size of 4.42 persons per household. non-family households (237 | 17.2%) represent the smallest median household size with 1.27 persons per household.
| Household Type | # Households | Household Size |
| Married-Couple | 956 (69.4%) | 2.71 |
| Single Male/Father | 62 (4.5%) | 2.08 |
| Single Female/Mother | 123 (8.9%) | 4.42 |
| Non-family | 237 (17.2%) | 1.27 |
| Total Households | 1,378 (100.0%) | 2.59 |
Household Size by Marriage Status in Lowesville
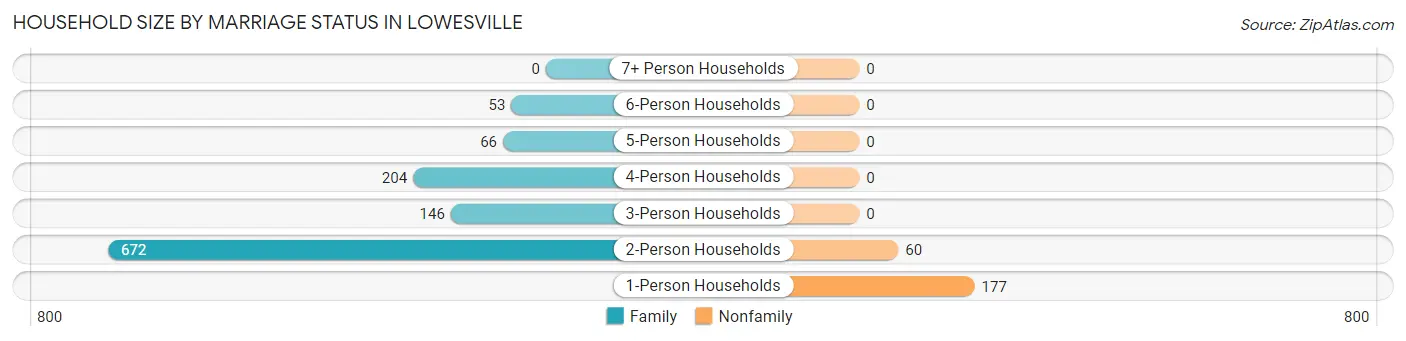
Out of a total of 1,378 households in Lowesville, 1,141 (82.8%) are family households, while 237 (17.2%) are nonfamily households. The most numerous type of family households are 2-person households, comprising 672, and the most common type of nonfamily households are 1-person households, comprising 177.
| Household Size | Family Households | Nonfamily Households |
| 1-Person Households | - | 177 (12.8%) |
| 2-Person Households | 672 (48.8%) | 60 (4.3%) |
| 3-Person Households | 146 (10.6%) | 0 (0.0%) |
| 4-Person Households | 204 (14.8%) | 0 (0.0%) |
| 5-Person Households | 66 (4.8%) | 0 (0.0%) |
| 6-Person Households | 53 (3.8%) | 0 (0.0%) |
| 7+ Person Households | 0 (0.0%) | 0 (0.0%) |
| Total | 1,141 (82.8%) | 237 (17.2%) |
Female Fertility in Lowesville
Fertility by Age in Lowesville
Average fertility rate in Lowesville is 56.0 births per 1,000 women. Women in the age bracket of 20 to 34 years have the highest fertility rate with 260.0 births per 1,000 women. Women in the age bracket of 20 to 34 years acount for 100.0% of all women with births.
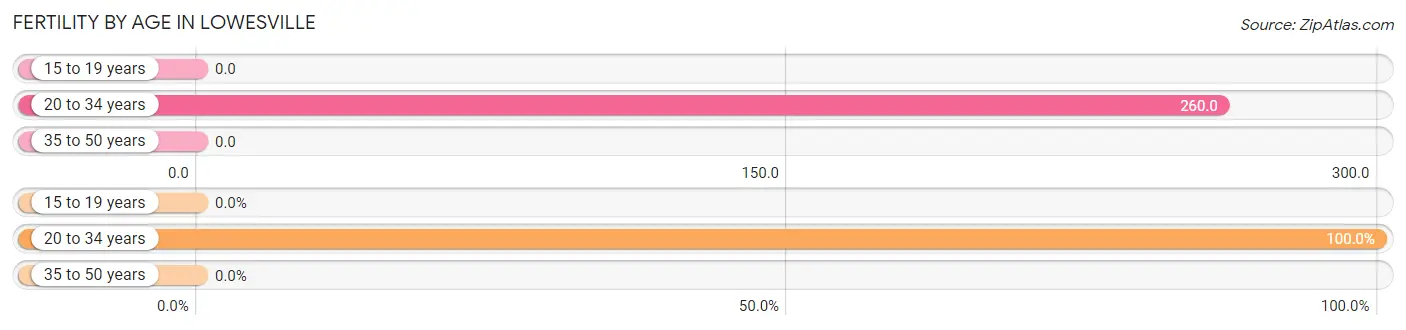
| Age Bracket | Women with Births | Births / 1,000 Women |
| 15 to 19 years | 0 (0.0%) | 0.0 |
| 20 to 34 years | 38 (100.0%) | 260.0 |
| 35 to 50 years | 0 (0.0%) | 0.0 |
| Total | 38 (100.0%) | 56.0 |
Fertility by Age by Marriage Status in Lowesville
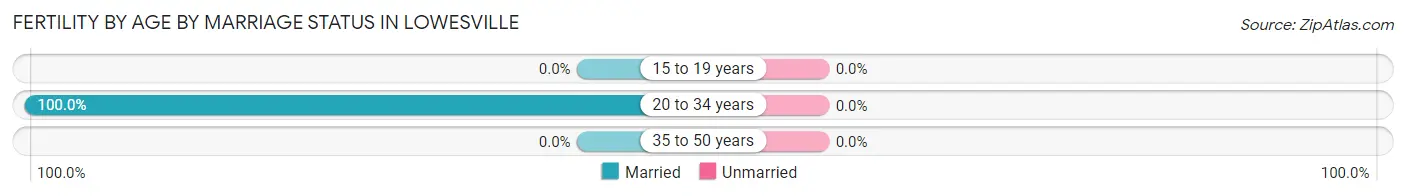
| Age Bracket | Married | Unmarried |
| 15 to 19 years | 0 (0.0%) | 0 (0.0%) |
| 20 to 34 years | 38 (100.0%) | 0 (0.0%) |
| 35 to 50 years | 0 (0.0%) | 0 (0.0%) |
| Total | 38 (100.0%) | 0 (0.0%) |
Fertility by Education in Lowesville
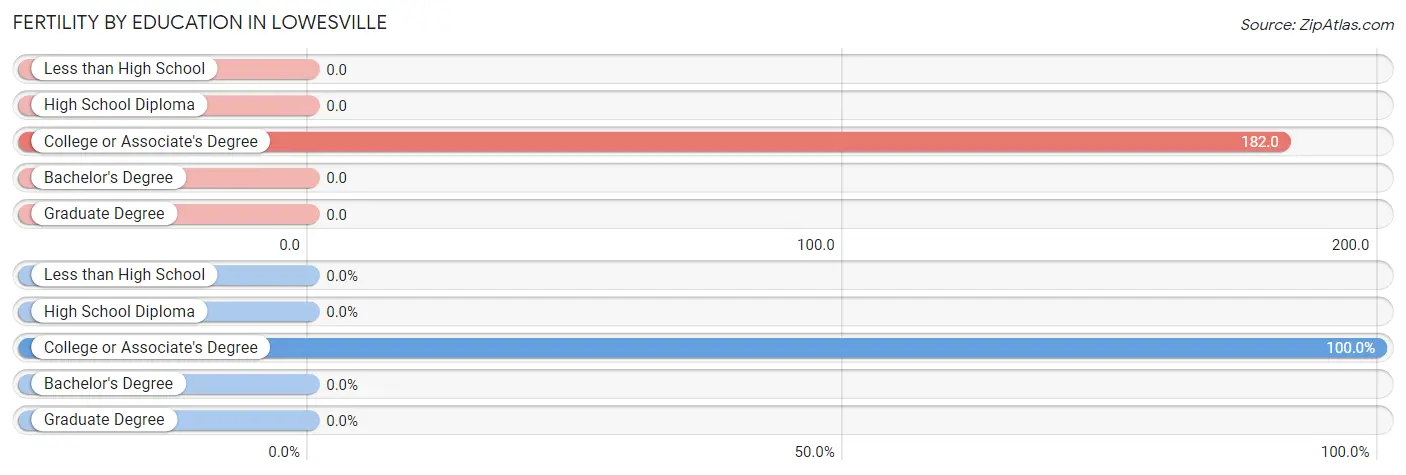
| Educational Attainment | Women with Births | Births / 1,000 Women |
| Less than High School | 0 (0.0%) | 0.0 |
| High School Diploma | 0 (0.0%) | 0.0 |
| College or Associate's Degree | 38 (100.0%) | 182.0 |
| Bachelor's Degree | 0 (0.0%) | 0.0 |
| Graduate Degree | 0 (0.0%) | 0.0 |
| Total | 38 (100.0%) | 56.0 |
Fertility by Education by Marriage Status in Lowesville
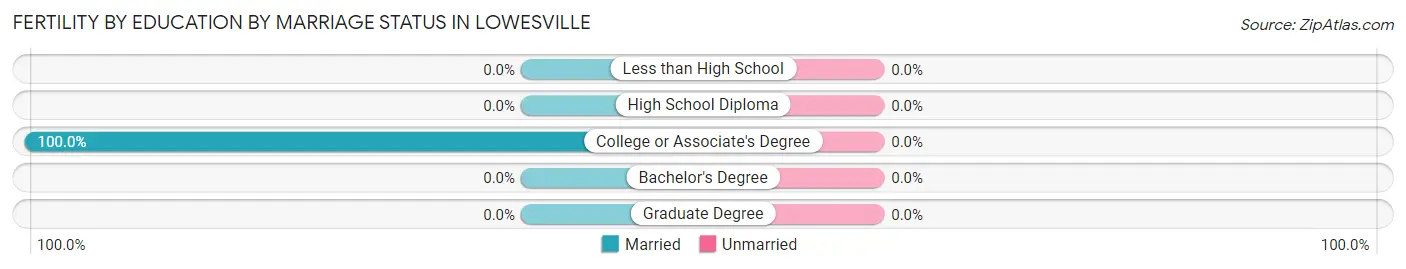
| Educational Attainment | Married | Unmarried |
| Less than High School | 0 (0.0%) | 0 (0.0%) |
| High School Diploma | 0 (0.0%) | 0 (0.0%) |
| College or Associate's Degree | 38 (100.0%) | 0 (0.0%) |
| Bachelor's Degree | 0 (0.0%) | 0 (0.0%) |
| Graduate Degree | 0 (0.0%) | 0 (0.0%) |
| Total | 38 (100.0%) | 0 (0.0%) |
Income in Lowesville
Income Overview in Lowesville
Per Capita Income in Lowesville is $50,409, while median incomes of families and households are $114,738 and $113,086 respectively.
| Characteristic | Number | Measure |
| Per Capita Income | 3,567 | $50,409 |
| Median Family Income | 1,141 | $114,738 |
| Mean Family Income | 1,141 | $130,818 |
| Median Household Income | 1,378 | $113,086 |
| Mean Household Income | 1,378 | $131,399 |
| Income Deficit | 1,141 | $0 |
| Wage / Income Gap (%) | 3,567 | 24.34% |
| Wage / Income Gap ($) | 3,567 | 75.66¢ per $1 |
| Gini / Inequality Index | 3,567 | 0.37 |
Earnings by Sex in Lowesville
Average Earnings in Lowesville are $53,515, $59,969 for men and $45,375 for women, a difference of 24.3%.
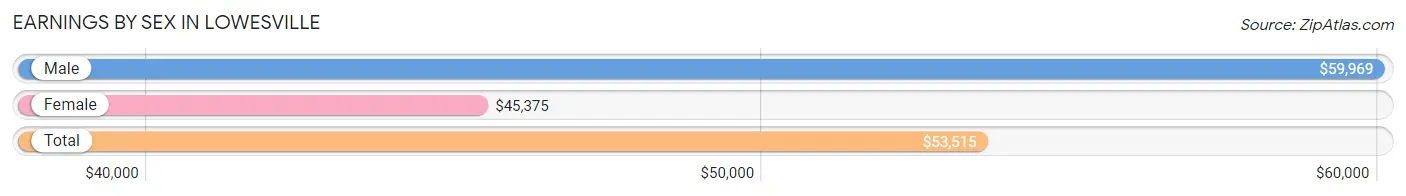
| Sex | Number | Average Earnings |
| Male | 1,207 (57.4%) | $59,969 |
| Female | 896 (42.6%) | $45,375 |
| Total | 2,103 (100.0%) | $53,515 |
Earnings by Sex by Income Bracket in Lowesville
The most common earnings brackets in Lowesville are $100,000+ for men (329 | 27.3%) and $100,000+ for women (186 | 20.8%).
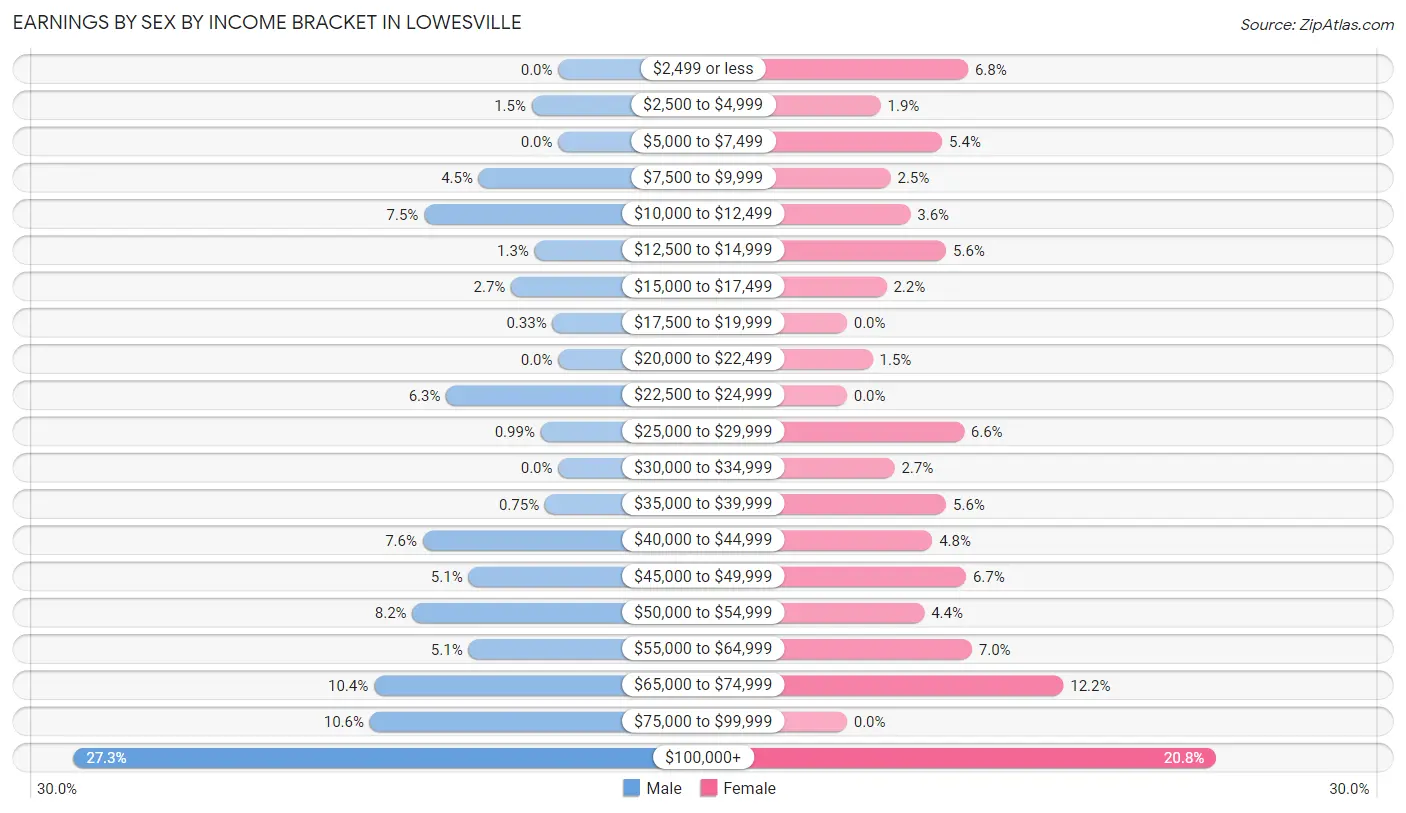
| Income | Male | Female |
| $2,499 or less | 0 (0.0%) | 61 (6.8%) |
| $2,500 to $4,999 | 18 (1.5%) | 17 (1.9%) |
| $5,000 to $7,499 | 0 (0.0%) | 48 (5.4%) |
| $7,500 to $9,999 | 54 (4.5%) | 22 (2.5%) |
| $10,000 to $12,499 | 91 (7.5%) | 32 (3.6%) |
| $12,500 to $14,999 | 16 (1.3%) | 50 (5.6%) |
| $15,000 to $17,499 | 32 (2.6%) | 20 (2.2%) |
| $17,500 to $19,999 | 4 (0.3%) | 0 (0.0%) |
| $20,000 to $22,499 | 0 (0.0%) | 13 (1.5%) |
| $22,500 to $24,999 | 76 (6.3%) | 0 (0.0%) |
| $25,000 to $29,999 | 12 (1.0%) | 59 (6.6%) |
| $30,000 to $34,999 | 0 (0.0%) | 24 (2.7%) |
| $35,000 to $39,999 | 9 (0.7%) | 50 (5.6%) |
| $40,000 to $44,999 | 92 (7.6%) | 43 (4.8%) |
| $45,000 to $49,999 | 61 (5.1%) | 60 (6.7%) |
| $50,000 to $54,999 | 99 (8.2%) | 39 (4.3%) |
| $55,000 to $64,999 | 61 (5.1%) | 63 (7.0%) |
| $65,000 to $74,999 | 125 (10.4%) | 109 (12.2%) |
| $75,000 to $99,999 | 128 (10.6%) | 0 (0.0%) |
| $100,000+ | 329 (27.3%) | 186 (20.8%) |
| Total | 1,207 (100.0%) | 896 (100.0%) |
Earnings by Sex by Educational Attainment in Lowesville
Average earnings in Lowesville are $73,151 for men and $47,271 for women, a difference of 35.4%. Men with an educational attainment of graduate degree enjoy the highest average annual earnings of $162,750, while those with college or associate's degree education earn the least with $73,559. Women with an educational attainment of high school diploma earn the most with the average annual earnings of $46,705, while those with college or associate's degree education have the smallest earnings of $45,759.
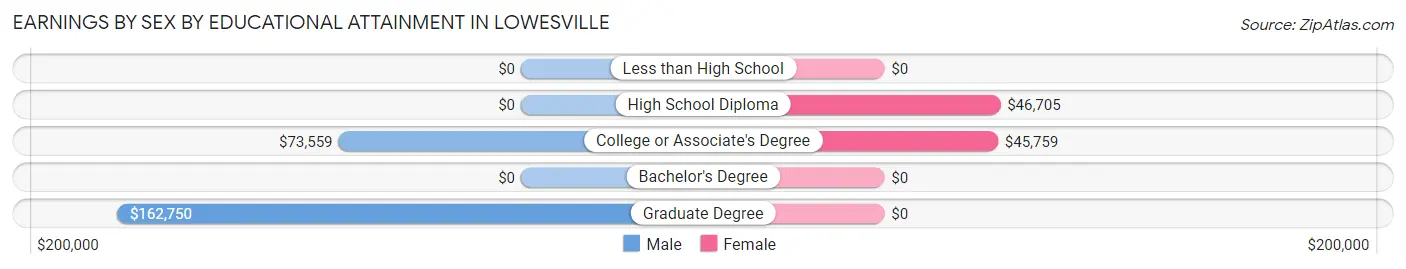
| Educational Attainment | Male Income | Female Income |
| Less than High School | - | - |
| High School Diploma | - | - |
| College or Associate's Degree | $73,559 | $45,759 |
| Bachelor's Degree | - | - |
| Graduate Degree | $162,750 | $0 |
| Total | $73,151 | $47,271 |
Family Income in Lowesville
Family Income Brackets in Lowesville
According to the Lowesville family income data, there are 388 families falling into the $100,000 to $149,999 income range, which is the most common income bracket and makes up 34.0% of all families.
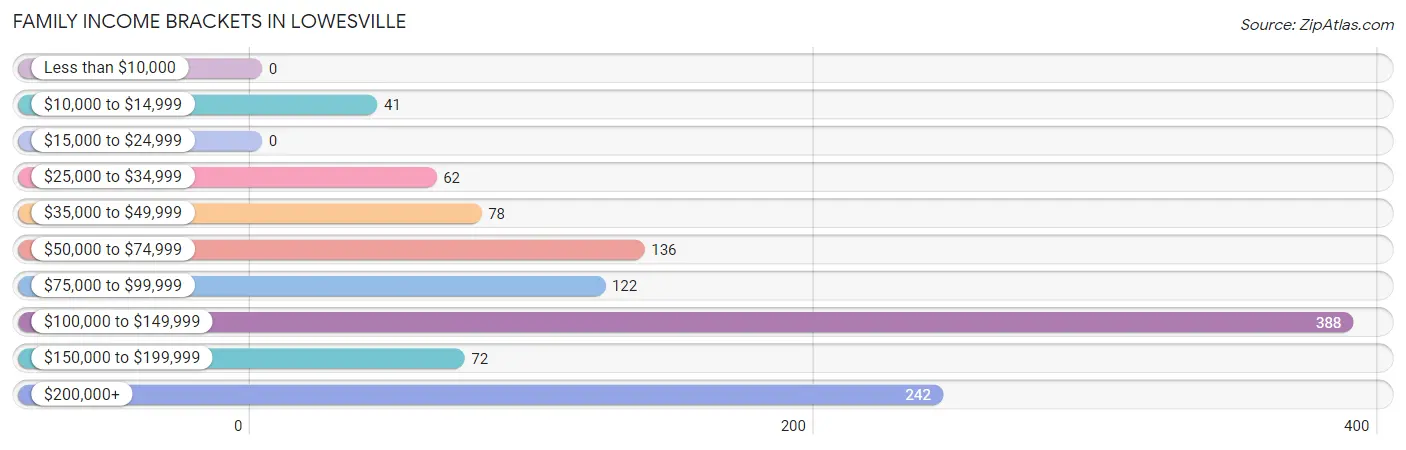
| Income Bracket | # Families | % Families |
| Less than $10,000 | 0 | 0.0% |
| $10,000 to $14,999 | 41 | 3.6% |
| $15,000 to $24,999 | 0 | 0.0% |
| $25,000 to $34,999 | 62 | 5.4% |
| $35,000 to $49,999 | 78 | 6.8% |
| $50,000 to $74,999 | 136 | 11.9% |
| $75,000 to $99,999 | 122 | 10.7% |
| $100,000 to $149,999 | 388 | 34.0% |
| $150,000 to $199,999 | 72 | 6.3% |
| $200,000+ | 242 | 21.2% |
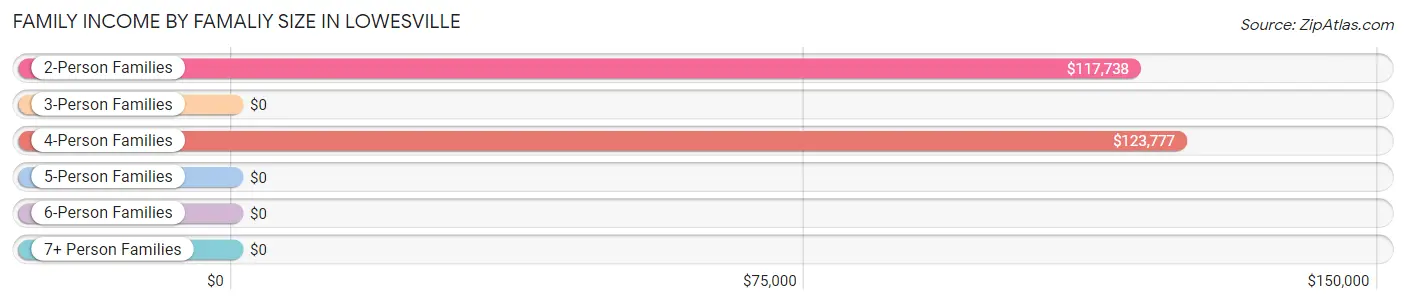
Family Income by Famaliy Size in Lowesville
4-person families (204 | 17.9%) account for the highest median family income in Lowesville with $123,777 per family, while 2-person families (676 | 59.3%) have the highest median income of $58,869 per family member.
| Income Bracket | # Families | Median Income |
| 2-Person Families | 676 (59.3%) | $117,738 |
| 3-Person Families | 142 (12.4%) | $0 |
| 4-Person Families | 204 (17.9%) | $123,777 |
| 5-Person Families | 66 (5.8%) | $0 |
| 6-Person Families | 53 (4.6%) | $0 |
| 7+ Person Families | 0 (0.0%) | $0 |
| Total | 1,141 (100.0%) | $114,738 |
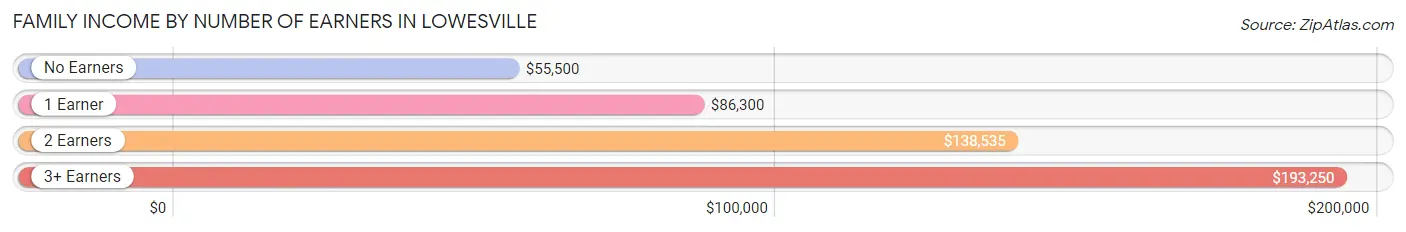
Family Income by Number of Earners in Lowesville
The median family income in Lowesville is $114,738, with families comprising 3+ earners (84) having the highest median family income of $193,250, while families with no earners (166) have the lowest median family income of $55,500, accounting for 7.4% and 14.5% of families, respectively.
| Number of Earners | # Families | Median Income |
| No Earners | 166 (14.5%) | $55,500 |
| 1 Earner | 168 (14.7%) | $86,300 |
| 2 Earners | 723 (63.4%) | $138,535 |
| 3+ Earners | 84 (7.4%) | $193,250 |
| Total | 1,141 (100.0%) | $114,738 |
Household Income in Lowesville
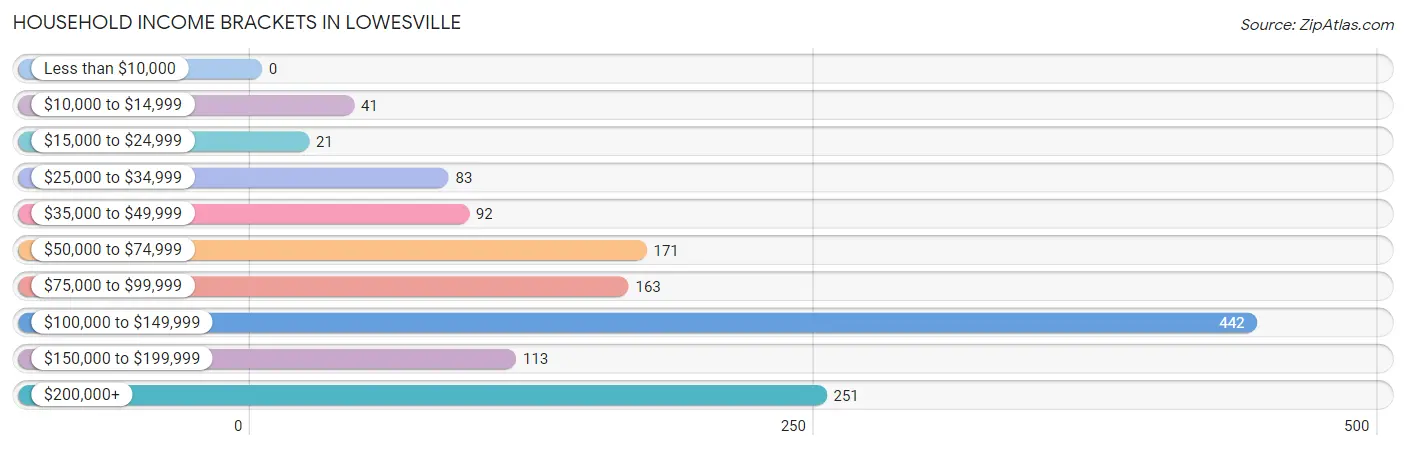
Household Income Brackets in Lowesville
With 442 households falling in the category, the $100,000 to $149,999 income range is the most frequent in Lowesville, accounting for 32.1% of all households.
| Income Bracket | # Households | % Households |
| Less than $10,000 | 0 | 0.0% |
| $10,000 to $14,999 | 41 | 3.0% |
| $15,000 to $24,999 | 21 | 1.5% |
| $25,000 to $34,999 | 83 | 6.0% |
| $35,000 to $49,999 | 92 | 6.7% |
| $50,000 to $74,999 | 171 | 12.4% |
| $75,000 to $99,999 | 163 | 11.8% |
| $100,000 to $149,999 | 442 | 32.1% |
| $150,000 to $199,999 | 113 | 8.2% |
| $200,000+ | 251 | 18.2% |
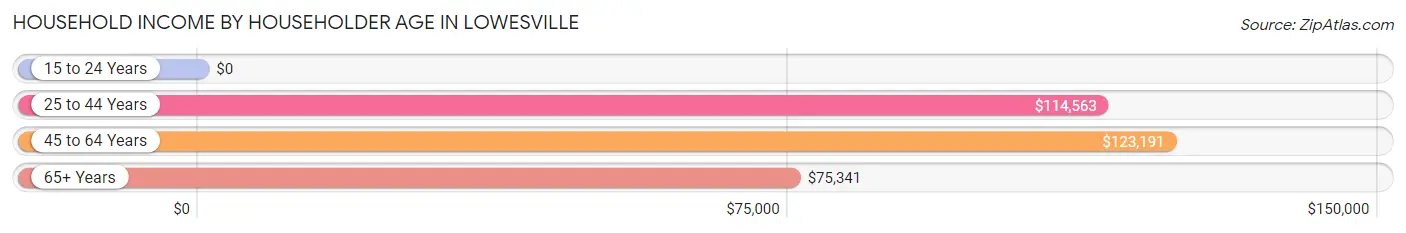
Household Income by Householder Age in Lowesville
The median household income in Lowesville is $113,086, with the highest median household income of $123,191 found in the 45 to 64 years age bracket for the primary householder. A total of 654 households (47.5%) fall into this category. Meanwhile, the 15 to 24 years age bracket for the primary householder has the lowest median household income of $0, with 14 households (1.0%) in this group.
| Income Bracket | # Households | Median Income |
| 15 to 24 Years | 14 (1.0%) | $0 |
| 25 to 44 Years | 359 (26.1%) | $114,563 |
| 45 to 64 Years | 654 (47.5%) | $123,191 |
| 65+ Years | 351 (25.5%) | $75,341 |
| Total | 1,378 (100.0%) | $113,086 |
Poverty in Lowesville
Income Below Poverty by Sex and Age in Lowesville
With 1.7% poverty level for males and 2.4% for females among the residents of Lowesville, 12 to 14 year old males and 25 to 34 year old females are the most vulnerable to poverty, with 16 males (7.8%) and 41 females (31.1%) in their respective age groups living below the poverty level.
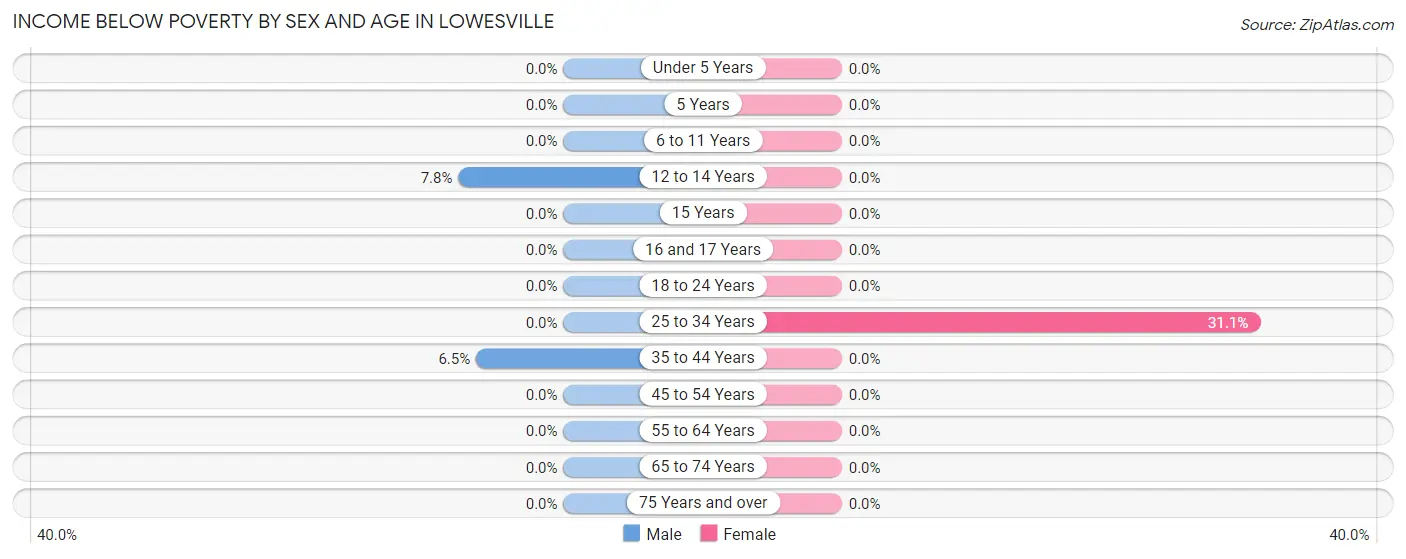
| Age Bracket | Male | Female |
| Under 5 Years | 0 (0.0%) | 0 (0.0%) |
| 5 Years | 0 (0.0%) | 0 (0.0%) |
| 6 to 11 Years | 0 (0.0%) | 0 (0.0%) |
| 12 to 14 Years | 16 (7.8%) | 0 (0.0%) |
| 15 Years | 0 (0.0%) | 0 (0.0%) |
| 16 and 17 Years | 0 (0.0%) | 0 (0.0%) |
| 18 to 24 Years | 0 (0.0%) | 0 (0.0%) |
| 25 to 34 Years | 0 (0.0%) | 41 (31.1%) |
| 35 to 44 Years | 16 (6.5%) | 0 (0.0%) |
| 45 to 54 Years | 0 (0.0%) | 0 (0.0%) |
| 55 to 64 Years | 0 (0.0%) | 0 (0.0%) |
| 65 to 74 Years | 0 (0.0%) | 0 (0.0%) |
| 75 Years and over | 0 (0.0%) | 0 (0.0%) |
| Total | 32 (1.7%) | 41 (2.4%) |
Income Above Poverty by Sex and Age in Lowesville
According to the poverty statistics in Lowesville, males aged under 5 years and females aged under 5 years are the age groups that are most secure financially, with 100.0% of males and 100.0% of females in these age groups living above the poverty line.
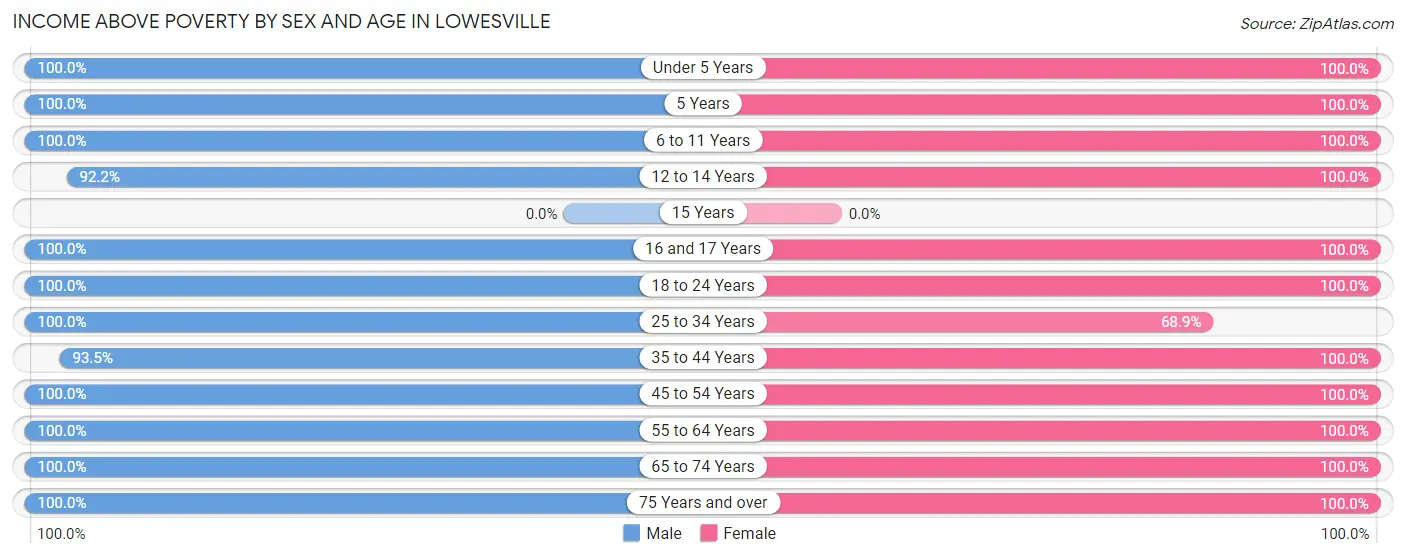
| Age Bracket | Male | Female |
| Under 5 Years | 46 (100.0%) | 104 (100.0%) |
| 5 Years | 13 (100.0%) | 68 (100.0%) |
| 6 to 11 Years | 109 (100.0%) | 132 (100.0%) |
| 12 to 14 Years | 189 (92.2%) | 42 (100.0%) |
| 15 Years | 0 (0.0%) | 0 (0.0%) |
| 16 and 17 Years | 74 (100.0%) | 60 (100.0%) |
| 18 to 24 Years | 148 (100.0%) | 31 (100.0%) |
| 25 to 34 Years | 237 (100.0%) | 91 (68.9%) |
| 35 to 44 Years | 231 (93.5%) | 237 (100.0%) |
| 45 to 54 Years | 342 (100.0%) | 328 (100.0%) |
| 55 to 64 Years | 150 (100.0%) | 183 (100.0%) |
| 65 to 74 Years | 125 (100.0%) | 153 (100.0%) |
| 75 Years and over | 192 (100.0%) | 209 (100.0%) |
| Total | 1,856 (98.3%) | 1,638 (97.6%) |
Income Below Poverty Among Married-Couple Families in Lowesville
The poverty statistics for married-couple families in Lowesville show that 4.3% or 41 of the total 956 families live below the poverty line. Families with 1 or 2 children have the highest poverty rate of 14.6%, comprising of 41 families. On the other hand, families with no children have the lowest poverty rate of 0.0%, which includes 0 families.
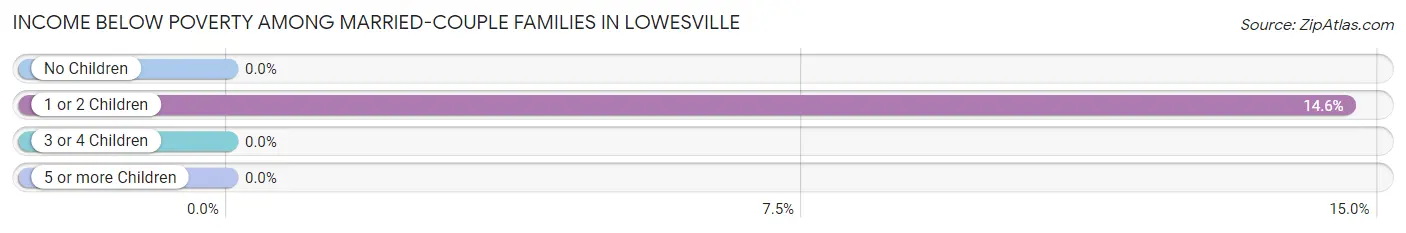
| Children | Above Poverty | Below Poverty |
| No Children | 628 (100.0%) | 0 (0.0%) |
| 1 or 2 Children | 240 (85.4%) | 41 (14.6%) |
| 3 or 4 Children | 47 (100.0%) | 0 (0.0%) |
| 5 or more Children | 0 (0.0%) | 0 (0.0%) |
| Total | 915 (95.7%) | 41 (4.3%) |
Income Below Poverty Among Single-Parent Households in Lowesville
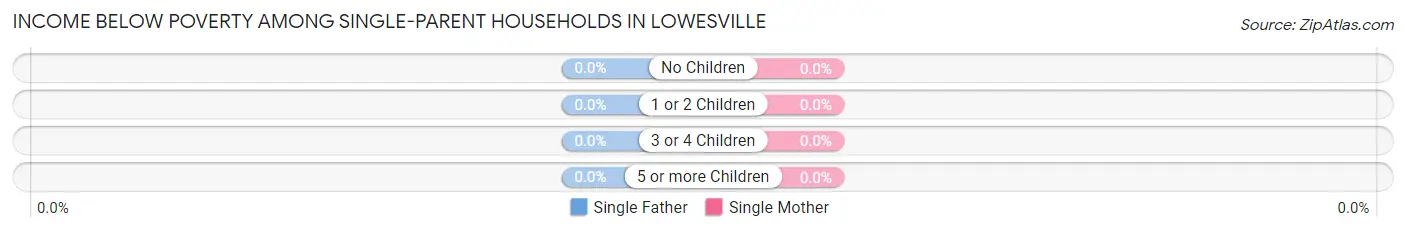
| Children | Single Father | Single Mother |
| No Children | 0 (0.0%) | 0 (0.0%) |
| 1 or 2 Children | 0 (0.0%) | 0 (0.0%) |
| 3 or 4 Children | 0 (0.0%) | 0 (0.0%) |
| 5 or more Children | 0 (0.0%) | 0 (0.0%) |
| Total | 0 (0.0%) | 0 (0.0%) |
Income Below Poverty Among Married-Couple vs Single-Parent Households in Lowesville
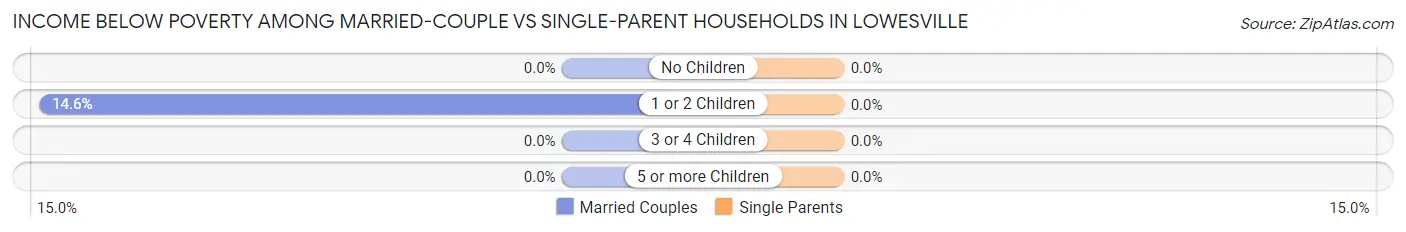
| Children | Married-Couple Families | Single-Parent Households |
| No Children | 0 (0.0%) | 0 (0.0%) |
| 1 or 2 Children | 41 (14.6%) | 0 (0.0%) |
| 3 or 4 Children | 0 (0.0%) | 0 (0.0%) |
| 5 or more Children | 0 (0.0%) | 0 (0.0%) |
| Total | 41 (4.3%) | 0 (0.0%) |
Employment Characteristics in Lowesville
Employment by Class of Employer in Lowesville
Among the 2,010 employed individuals in Lowesville, private company employees (1,619 | 80.5%), self-employed (not incorporated) (164 | 8.2%), and not-for-profit organizations (123 | 6.1%) make up the most common classes of employment.
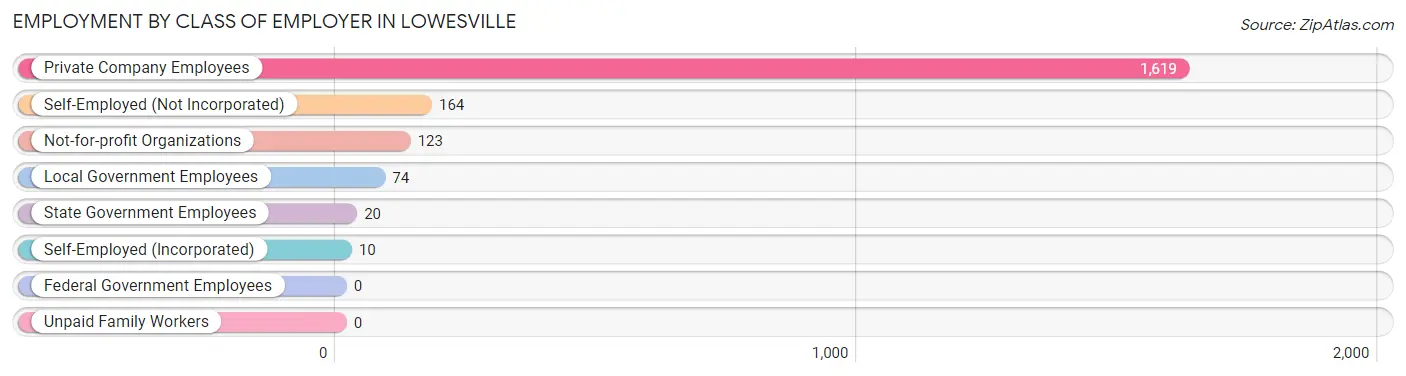
| Employer Class | # Employees | % Employees |
| Private Company Employees | 1,619 | 80.5% |
| Self-Employed (Incorporated) | 10 | 0.5% |
| Self-Employed (Not Incorporated) | 164 | 8.2% |
| Not-for-profit Organizations | 123 | 6.1% |
| Local Government Employees | 74 | 3.7% |
| State Government Employees | 20 | 1.0% |
| Federal Government Employees | 0 | 0.0% |
| Unpaid Family Workers | 0 | 0.0% |
| Total | 2,010 | 100.0% |
Employment Status by Age in Lowesville
According to the labor force statistics for Lowesville, out of the total population over 16 years of age (2,848), 72.2% or 2,056 individuals are in the labor force, with 2.2% or 45 of them unemployed. The age group with the highest labor force participation rate is 20 to 24 years, with 100.0% or 162 individuals in the labor force. Within the labor force, the 16 to 19 years age range has the highest percentage of unemployed individuals, with 22.1% or 17 of them being unemployed.
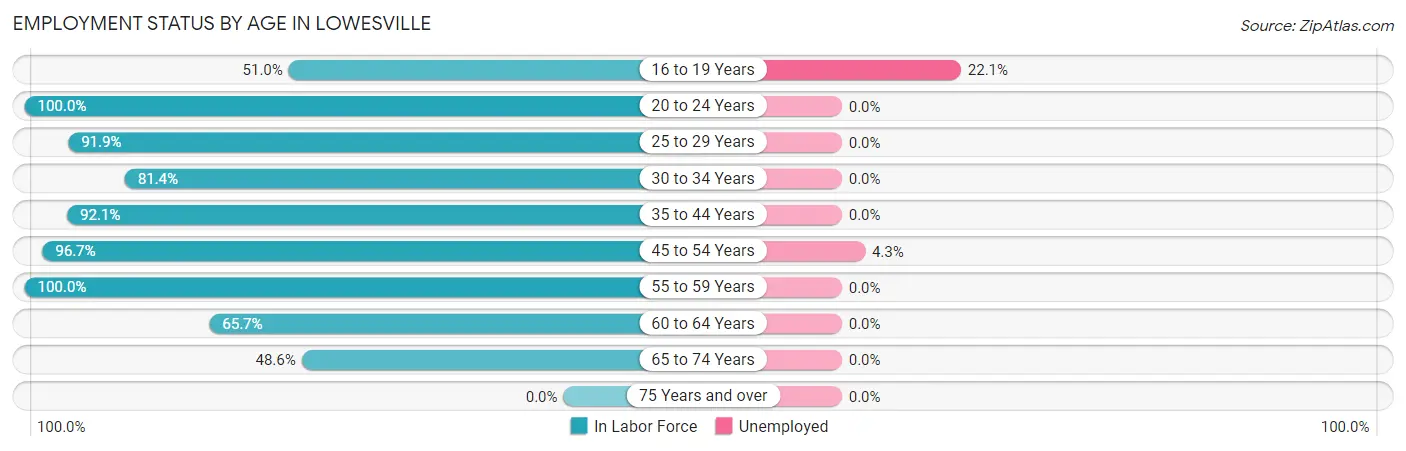
| Age Bracket | In Labor Force | Unemployed |
| 16 to 19 Years | 77 (51.0%) | 17 (22.1%) |
| 20 to 24 Years | 162 (100.0%) | 0 (0.0%) |
| 25 to 29 Years | 136 (91.9%) | 0 (0.0%) |
| 30 to 34 Years | 180 (81.4%) | 0 (0.0%) |
| 35 to 44 Years | 446 (92.1%) | 0 (0.0%) |
| 45 to 54 Years | 648 (96.7%) | 28 (4.3%) |
| 55 to 59 Years | 152 (100.0%) | 0 (0.0%) |
| 60 to 64 Years | 119 (65.7%) | 0 (0.0%) |
| 65 to 74 Years | 135 (48.6%) | 0 (0.0%) |
| 75 Years and over | 0 (0.0%) | 0 (0.0%) |
| Total | 2,056 (72.2%) | 45 (2.2%) |
Employment Status by Educational Attainment in Lowesville
According to labor force statistics for Lowesville, 90.6% of individuals (1,682) out of the total population between 25 and 64 years of age (1,856) are in the labor force, with 1.7% or 29 of them being unemployed. The group with the highest labor force participation rate are those with the educational attainment of less than high school, with 100.0% or 52 individuals in the labor force. Within the labor force, individuals with bachelor's degree or higher education have the highest percentage of unemployment, with 5.1% or 28 of them being unemployed.
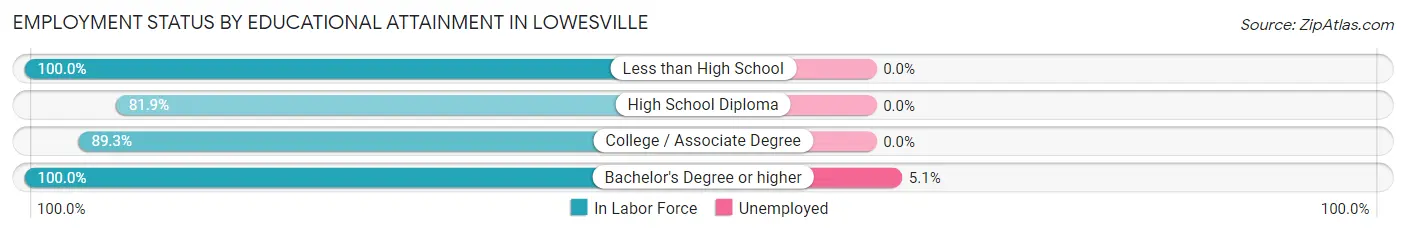
| Educational Attainment | In Labor Force | Unemployed |
| Less than High School | 52 (100.0%) | 0 (0.0%) |
| High School Diploma | 453 (81.9%) | 0 (0.0%) |
| College / Associate Degree | 628 (89.3%) | 0 (0.0%) |
| Bachelor's Degree or higher | 548 (100.0%) | 28 (5.1%) |
| Total | 1,682 (90.6%) | 32 (1.7%) |
Employment Occupations by Sex in Lowesville
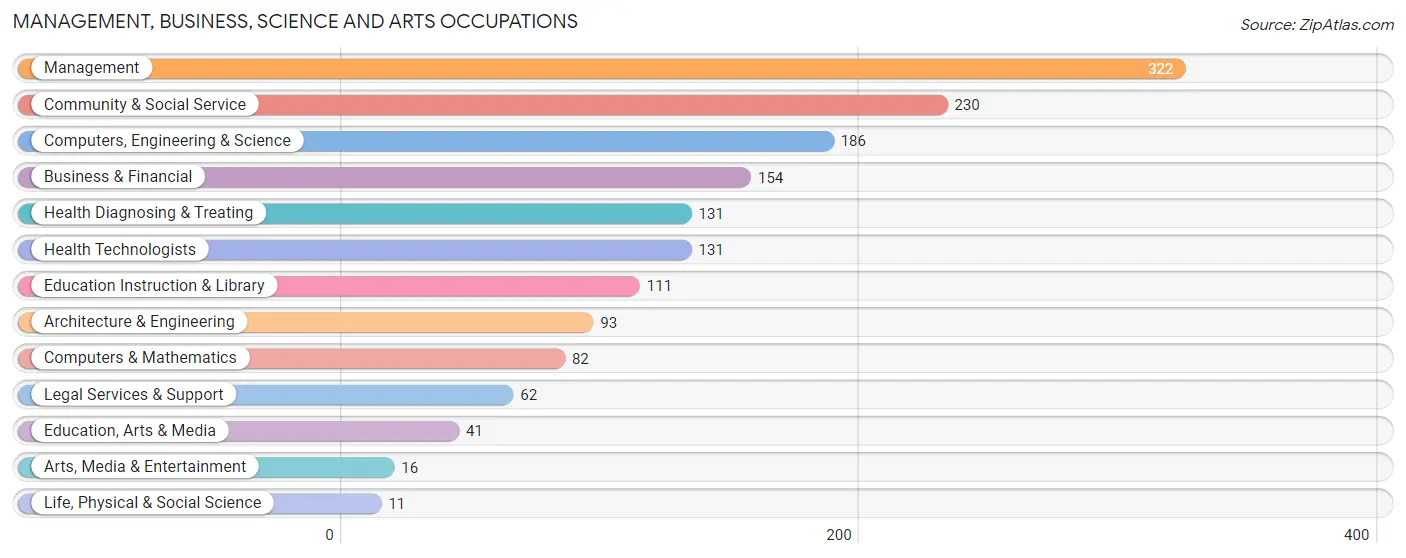
Management, Business, Science and Arts Occupations
The most common Management, Business, Science and Arts occupations in Lowesville are Management (322 | 16.0%), Community & Social Service (230 | 11.4%), Computers, Engineering & Science (186 | 9.2%), Business & Financial (154 | 7.7%), and Health Diagnosing & Treating (131 | 6.5%).
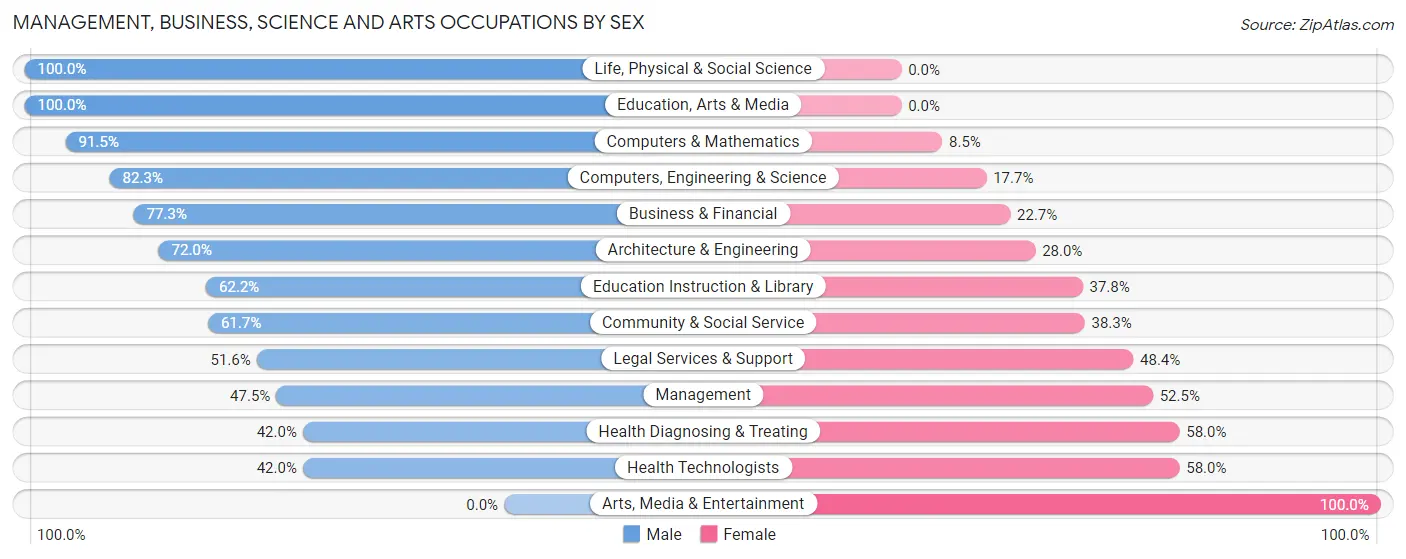
Management, Business, Science and Arts Occupations by Sex
Within the Management, Business, Science and Arts occupations in Lowesville, the most male-oriented occupations are Life, Physical & Social Science (100.0%), Education, Arts & Media (100.0%), and Computers & Mathematics (91.5%), while the most female-oriented occupations are Arts, Media & Entertainment (100.0%), Health Diagnosing & Treating (58.0%), and Health Technologists (58.0%).
| Occupation | Male | Female |
| Management | 153 (47.5%) | 169 (52.5%) |
| Business & Financial | 119 (77.3%) | 35 (22.7%) |
| Computers, Engineering & Science | 153 (82.3%) | 33 (17.7%) |
| Computers & Mathematics | 75 (91.5%) | 7 (8.5%) |
| Architecture & Engineering | 67 (72.0%) | 26 (28.0%) |
| Life, Physical & Social Science | 11 (100.0%) | 0 (0.0%) |
| Community & Social Service | 142 (61.7%) | 88 (38.3%) |
| Education, Arts & Media | 41 (100.0%) | 0 (0.0%) |
| Legal Services & Support | 32 (51.6%) | 30 (48.4%) |
| Education Instruction & Library | 69 (62.2%) | 42 (37.8%) |
| Arts, Media & Entertainment | 0 (0.0%) | 16 (100.0%) |
| Health Diagnosing & Treating | 55 (42.0%) | 76 (58.0%) |
| Health Technologists | 55 (42.0%) | 76 (58.0%) |
| Total (Category) | 622 (60.8%) | 401 (39.2%) |
| Total (Overall) | 1,155 (57.5%) | 855 (42.5%) |
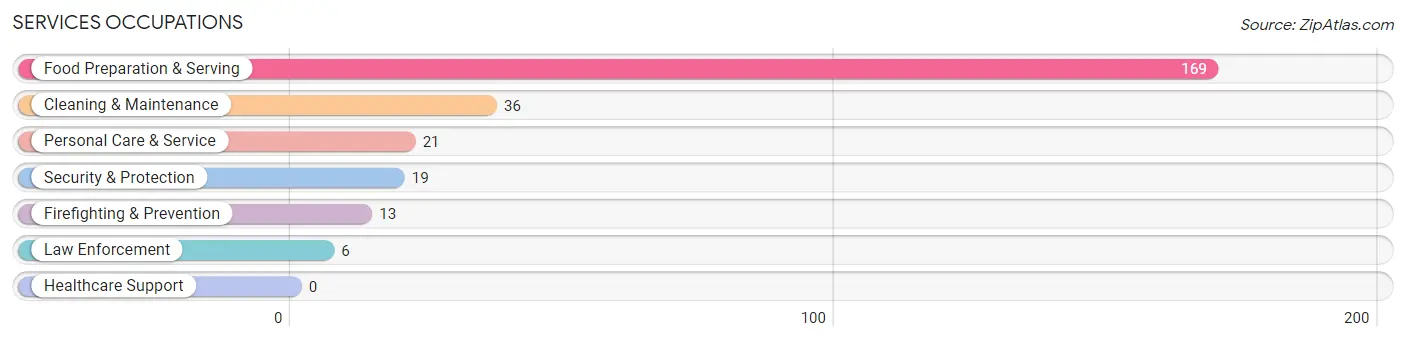
Services Occupations
The most common Services occupations in Lowesville are Food Preparation & Serving (169 | 8.4%), Cleaning & Maintenance (36 | 1.8%), Personal Care & Service (21 | 1.0%), Security & Protection (19 | 0.9%), and Firefighting & Prevention (13 | 0.6%).
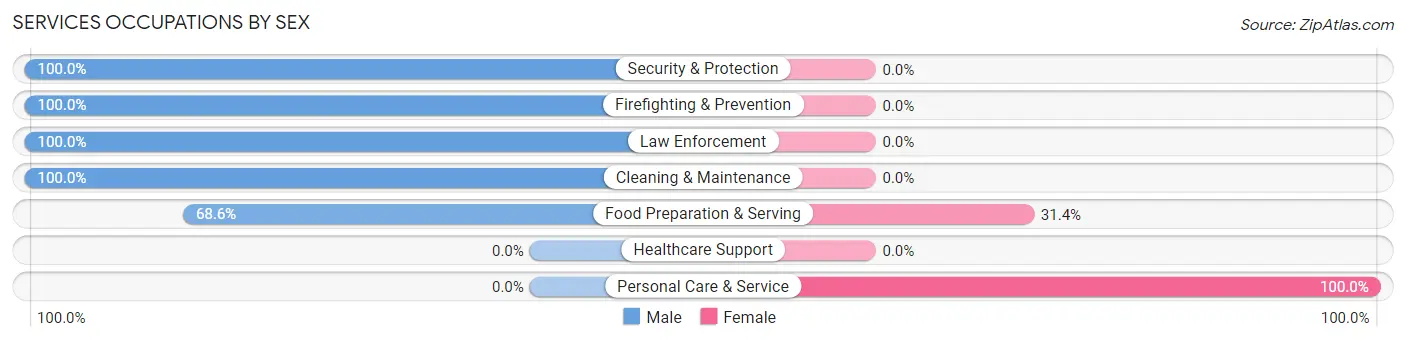
Services Occupations by Sex
Within the Services occupations in Lowesville, the most male-oriented occupations are Security & Protection (100.0%), Firefighting & Prevention (100.0%), and Law Enforcement (100.0%), while the most female-oriented occupations are Personal Care & Service (100.0%), and Food Preparation & Serving (31.4%).
| Occupation | Male | Female |
| Healthcare Support | 0 (0.0%) | 0 (0.0%) |
| Security & Protection | 19 (100.0%) | 0 (0.0%) |
| Firefighting & Prevention | 13 (100.0%) | 0 (0.0%) |
| Law Enforcement | 6 (100.0%) | 0 (0.0%) |
| Food Preparation & Serving | 116 (68.6%) | 53 (31.4%) |
| Cleaning & Maintenance | 36 (100.0%) | 0 (0.0%) |
| Personal Care & Service | 0 (0.0%) | 21 (100.0%) |
| Total (Category) | 171 (69.8%) | 74 (30.2%) |
| Total (Overall) | 1,155 (57.5%) | 855 (42.5%) |
Sales and Office Occupations
The most common Sales and Office occupations in Lowesville are Office & Administration (453 | 22.5%), and Sales & Related (244 | 12.1%).

Sales and Office Occupations by Sex
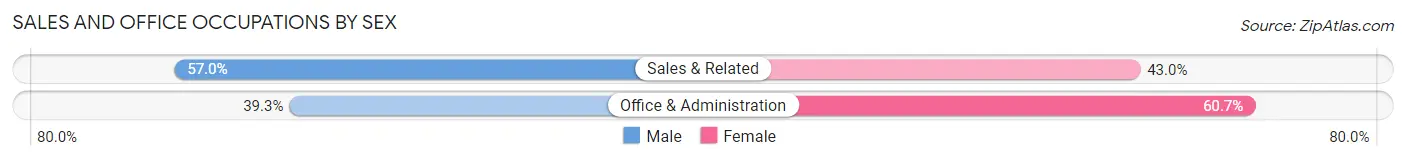
| Occupation | Male | Female |
| Sales & Related | 139 (57.0%) | 105 (43.0%) |
| Office & Administration | 178 (39.3%) | 275 (60.7%) |
| Total (Category) | 317 (45.5%) | 380 (54.5%) |
| Total (Overall) | 1,155 (57.5%) | 855 (42.5%) |
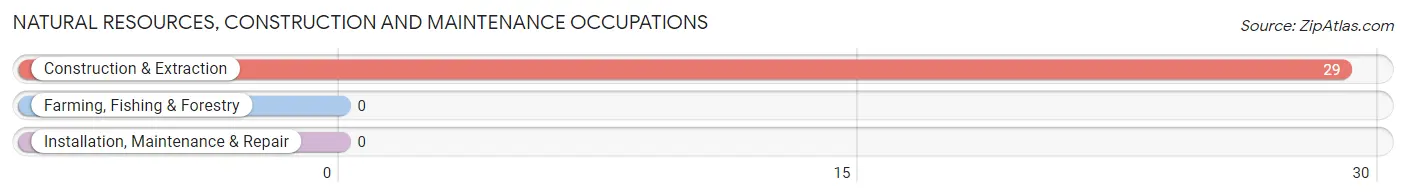
Natural Resources, Construction and Maintenance Occupations
The most common Natural Resources, Construction and Maintenance occupations in Lowesville are , and Construction & Extraction (29 | 1.4%).
Natural Resources, Construction and Maintenance Occupations by Sex
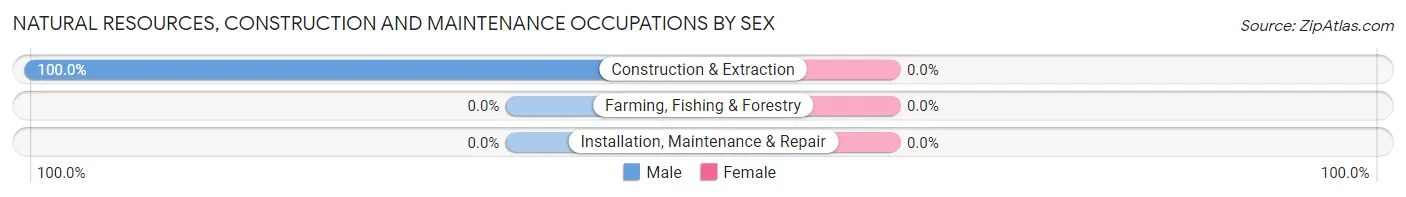
| Occupation | Male | Female |
| Farming, Fishing & Forestry | 0 (0.0%) | 0 (0.0%) |
| Construction & Extraction | 29 (100.0%) | 0 (0.0%) |
| Installation, Maintenance & Repair | 0 (0.0%) | 0 (0.0%) |
| Total (Category) | 29 (100.0%) | 0 (0.0%) |
| Total (Overall) | 1,155 (57.5%) | 855 (42.5%) |
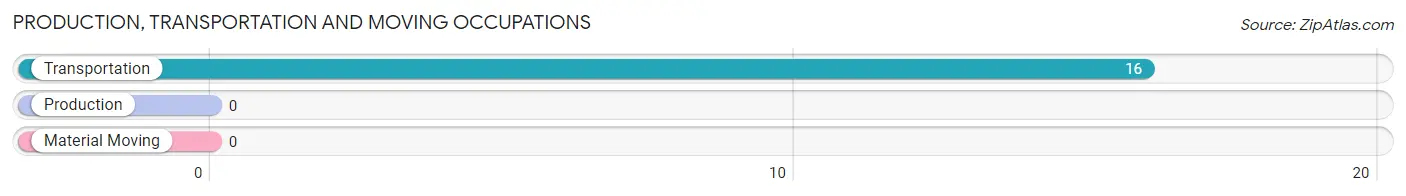
Production, Transportation and Moving Occupations
The most common Production, Transportation and Moving occupations in Lowesville are , and Transportation (16 | 0.8%).
Production, Transportation and Moving Occupations by Sex
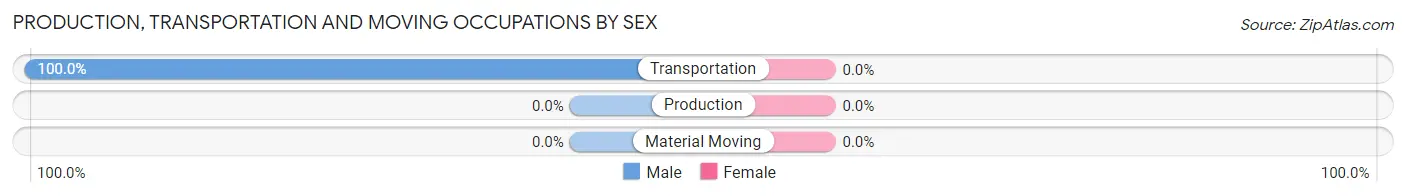
| Occupation | Male | Female |
| Production | 0 (0.0%) | 0 (0.0%) |
| Transportation | 16 (100.0%) | 0 (0.0%) |
| Material Moving | 0 (0.0%) | 0 (0.0%) |
| Total (Category) | 16 (100.0%) | 0 (0.0%) |
| Total (Overall) | 1,155 (57.5%) | 855 (42.5%) |
Employment Industries by Sex in Lowesville
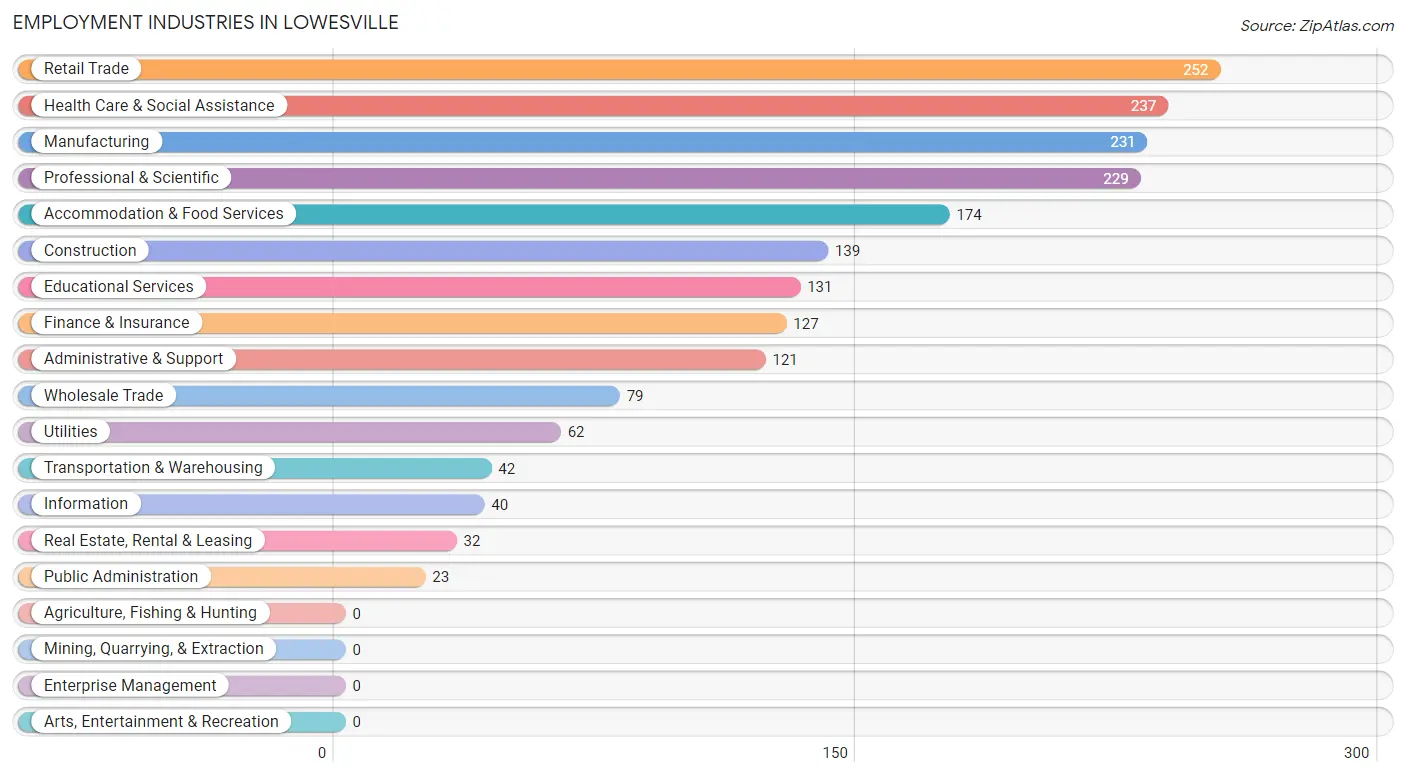
Employment Industries in Lowesville
The major employment industries in Lowesville include Retail Trade (252 | 12.5%), Health Care & Social Assistance (237 | 11.8%), Manufacturing (231 | 11.5%), Professional & Scientific (229 | 11.4%), and Accommodation & Food Services (174 | 8.7%).
Employment Industries by Sex in Lowesville
The Lowesville industries that see more men than women are Utilities (100.0%), Construction (81.3%), and Transportation & Warehousing (76.2%), whereas the industries that tend to have a higher number of women are Information (100.0%), Real Estate, Rental & Leasing (100.0%), and Health Care & Social Assistance (73.0%).
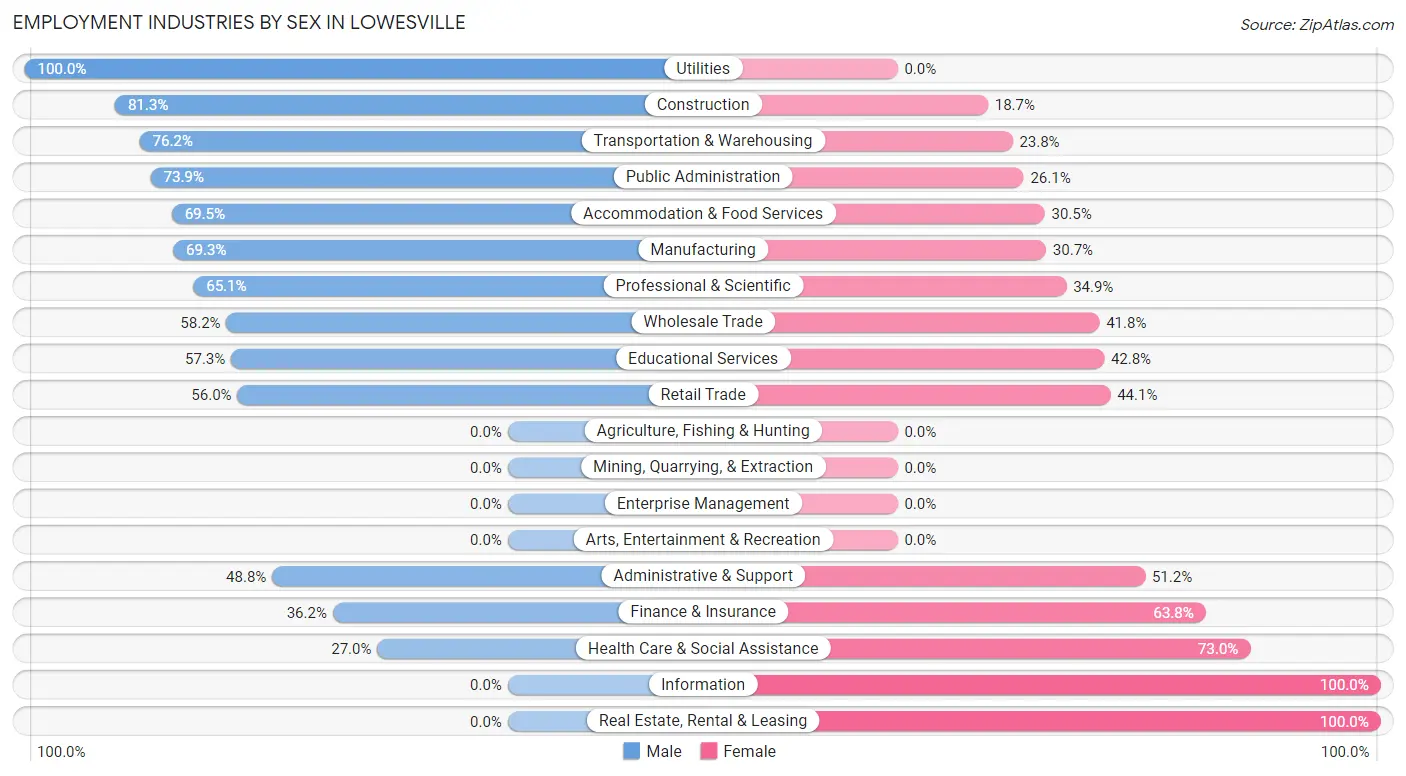
| Industry | Male | Female |
| Agriculture, Fishing & Hunting | 0 (0.0%) | 0 (0.0%) |
| Mining, Quarrying, & Extraction | 0 (0.0%) | 0 (0.0%) |
| Construction | 113 (81.3%) | 26 (18.7%) |
| Manufacturing | 160 (69.3%) | 71 (30.7%) |
| Wholesale Trade | 46 (58.2%) | 33 (41.8%) |
| Retail Trade | 141 (55.9%) | 111 (44.1%) |
| Transportation & Warehousing | 32 (76.2%) | 10 (23.8%) |
| Utilities | 62 (100.0%) | 0 (0.0%) |
| Information | 0 (0.0%) | 40 (100.0%) |
| Finance & Insurance | 46 (36.2%) | 81 (63.8%) |
| Real Estate, Rental & Leasing | 0 (0.0%) | 32 (100.0%) |
| Professional & Scientific | 149 (65.1%) | 80 (34.9%) |
| Enterprise Management | 0 (0.0%) | 0 (0.0%) |
| Administrative & Support | 59 (48.8%) | 62 (51.2%) |
| Educational Services | 75 (57.3%) | 56 (42.7%) |
| Health Care & Social Assistance | 64 (27.0%) | 173 (73.0%) |
| Arts, Entertainment & Recreation | 0 (0.0%) | 0 (0.0%) |
| Accommodation & Food Services | 121 (69.5%) | 53 (30.5%) |
| Public Administration | 17 (73.9%) | 6 (26.1%) |
| Total | 1,155 (57.5%) | 855 (42.5%) |
Education in Lowesville
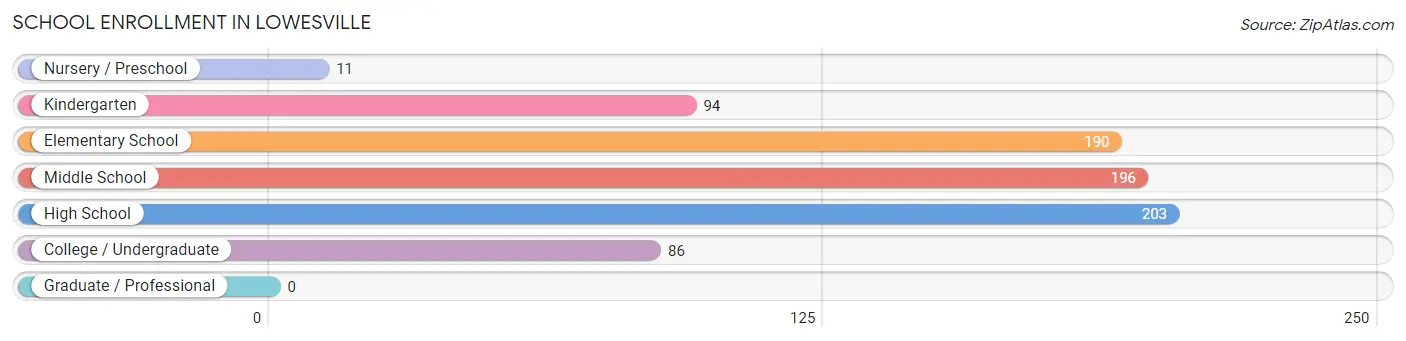
School Enrollment in Lowesville
The most common levels of schooling among the 780 students in Lowesville are high school (203 | 26.0%), middle school (196 | 25.1%), and elementary school (190 | 24.4%).
| School Level | # Students | % Students |
| Nursery / Preschool | 11 | 1.4% |
| Kindergarten | 94 | 12.0% |
| Elementary School | 190 | 24.4% |
| Middle School | 196 | 25.1% |
| High School | 203 | 26.0% |
| College / Undergraduate | 86 | 11.0% |
| Graduate / Professional | 0 | 0.0% |
| Total | 780 | 100.0% |
School Enrollment by Age by Funding Source in Lowesville
Out of a total of 780 students who are enrolled in schools in Lowesville, 131 (16.8%) attend a private institution, while the remaining 649 (83.2%) are enrolled in public schools. The age group of 3 to 4 year olds has the highest likelihood of being enrolled in private schools, with 11 (100.0% in the age bracket) enrolled. Conversely, the age group of 15 to 17 year olds has the lowest likelihood of being enrolled in a private school, with 134 (100.0% in the age bracket) attending a public institution.
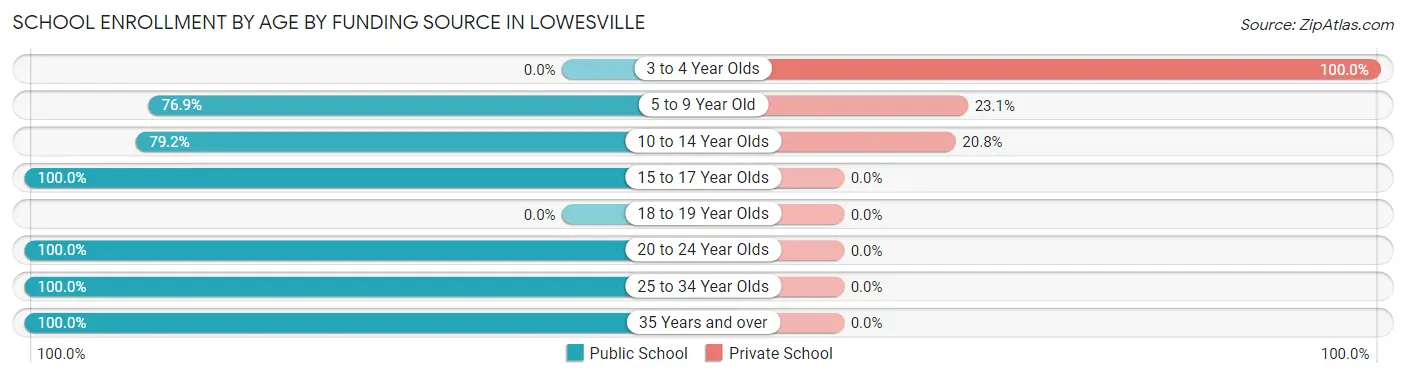
| Age Bracket | Public School | Private School |
| 3 to 4 Year Olds | 0 (0.0%) | 11 (100.0%) |
| 5 to 9 Year Old | 193 (76.9%) | 58 (23.1%) |
| 10 to 14 Year Olds | 236 (79.2%) | 62 (20.8%) |
| 15 to 17 Year Olds | 134 (100.0%) | 0 (0.0%) |
| 18 to 19 Year Olds | 0 (0.0%) | 0 (0.0%) |
| 20 to 24 Year Olds | 32 (100.0%) | 0 (0.0%) |
| 25 to 34 Year Olds | 44 (100.0%) | 0 (0.0%) |
| 35 Years and over | 10 (100.0%) | 0 (0.0%) |
| Total | 649 (83.2%) | 131 (16.8%) |
Educational Attainment by Field of Study in Lowesville
Business (176 | 26.5%), social sciences (80 | 12.0%), science & technology (64 | 9.6%), bio, nature & agricultural (58 | 8.7%), and physical & health sciences (55 | 8.3%) are the most common fields of study among 665 individuals in Lowesville who have obtained a bachelor's degree or higher.
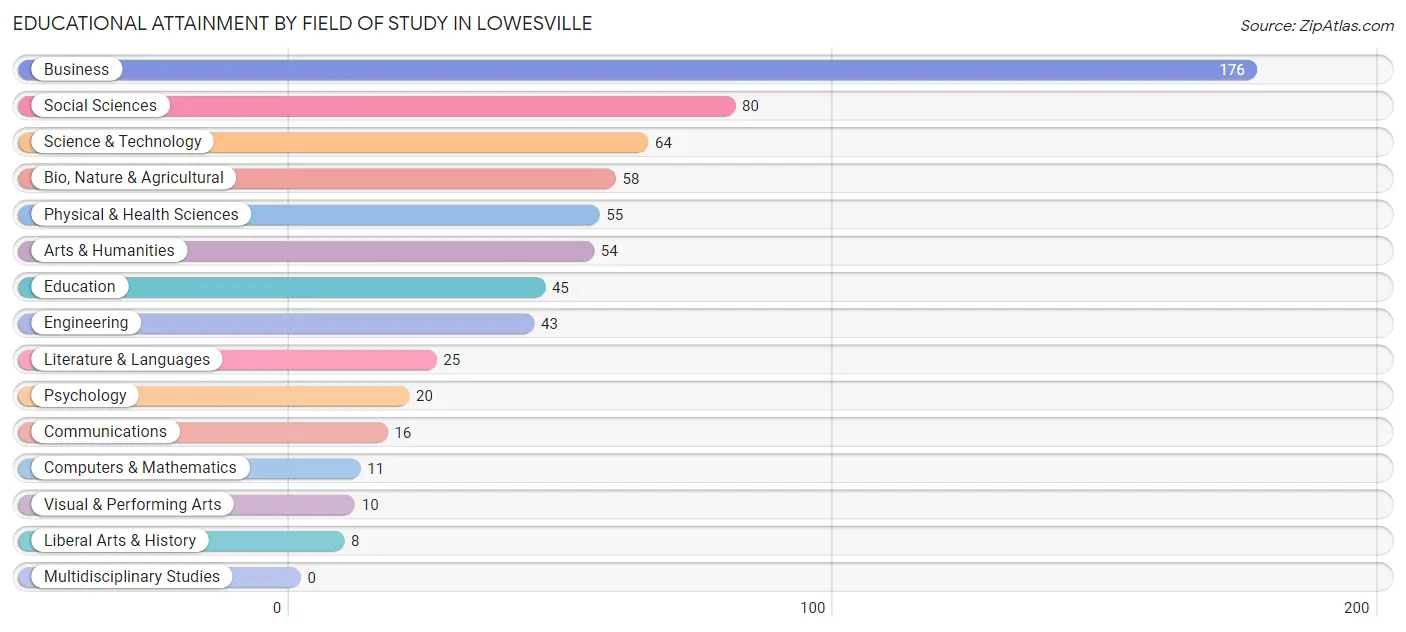
| Field of Study | # Graduates | % Graduates |
| Computers & Mathematics | 11 | 1.7% |
| Bio, Nature & Agricultural | 58 | 8.7% |
| Physical & Health Sciences | 55 | 8.3% |
| Psychology | 20 | 3.0% |
| Social Sciences | 80 | 12.0% |
| Engineering | 43 | 6.5% |
| Multidisciplinary Studies | 0 | 0.0% |
| Science & Technology | 64 | 9.6% |
| Business | 176 | 26.5% |
| Education | 45 | 6.8% |
| Literature & Languages | 25 | 3.8% |
| Liberal Arts & History | 8 | 1.2% |
| Visual & Performing Arts | 10 | 1.5% |
| Communications | 16 | 2.4% |
| Arts & Humanities | 54 | 8.1% |
| Total | 665 | 100.0% |
Transportation & Commute in Lowesville
Vehicle Availability by Sex in Lowesville
The most prevalent vehicle ownership categories in Lowesville are males with 2 vehicles (617, accounting for 53.4%) and females with 2 vehicles (457, making up 72.2%).
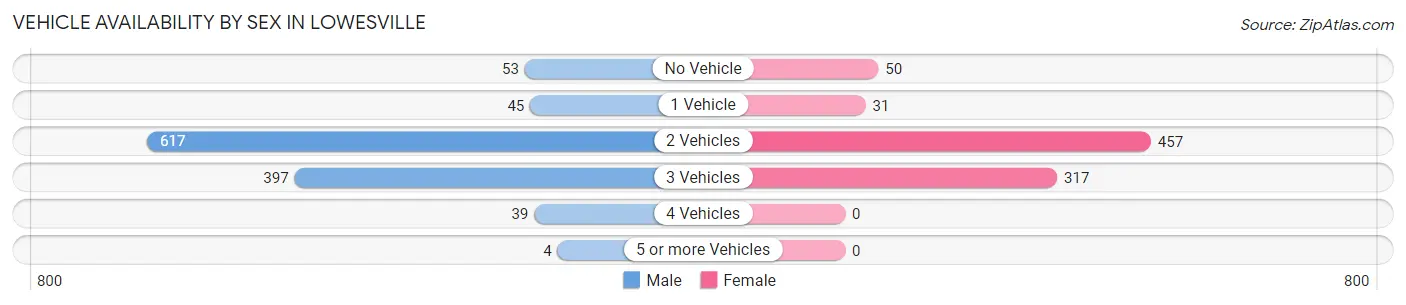
| Vehicles Available | Male | Female |
| No Vehicle | 53 (4.6%) | 50 (5.9%) |
| 1 Vehicle | 45 (3.9%) | 31 (3.6%) |
| 2 Vehicles | 617 (53.4%) | 457 (53.4%) |
| 3 Vehicles | 397 (34.4%) | 317 (37.1%) |
| 4 Vehicles | 39 (3.4%) | 0 (0.0%) |
| 5 or more Vehicles | 4 (0.4%) | 0 (0.0%) |
| Total | 1,155 (100.0%) | 855 (100.0%) |
Commute Time in Lowesville
The most frequently occuring commute durations in Lowesville are 45 to 59 minutes (295 commuters, 17.5%), 30 to 34 minutes (249 commuters, 14.7%), and 5 to 9 minutes (227 commuters, 13.5%).
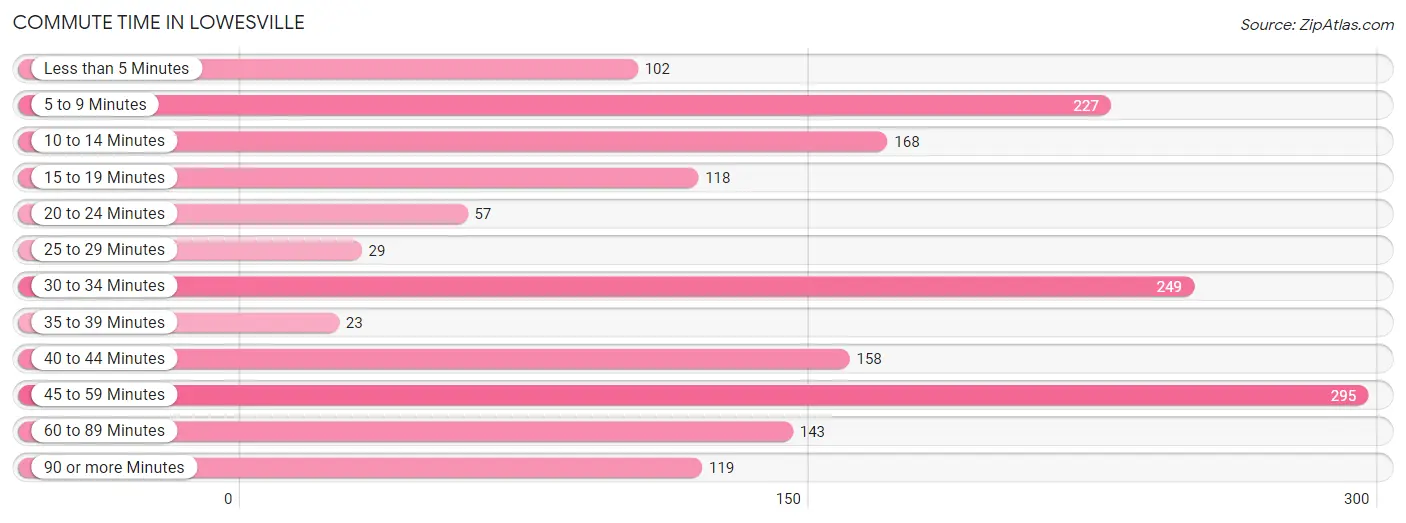
| Commute Time | # Commuters | % Commuters |
| Less than 5 Minutes | 102 | 6.0% |
| 5 to 9 Minutes | 227 | 13.5% |
| 10 to 14 Minutes | 168 | 10.0% |
| 15 to 19 Minutes | 118 | 7.0% |
| 20 to 24 Minutes | 57 | 3.4% |
| 25 to 29 Minutes | 29 | 1.7% |
| 30 to 34 Minutes | 249 | 14.7% |
| 35 to 39 Minutes | 23 | 1.4% |
| 40 to 44 Minutes | 158 | 9.4% |
| 45 to 59 Minutes | 295 | 17.5% |
| 60 to 89 Minutes | 143 | 8.5% |
| 90 or more Minutes | 119 | 7.0% |
Commute Time by Sex in Lowesville
The most common commute times in Lowesville are 45 to 59 minutes (228 commuters, 23.7%) for males and 30 to 34 minutes (133 commuters, 18.3%) for females.
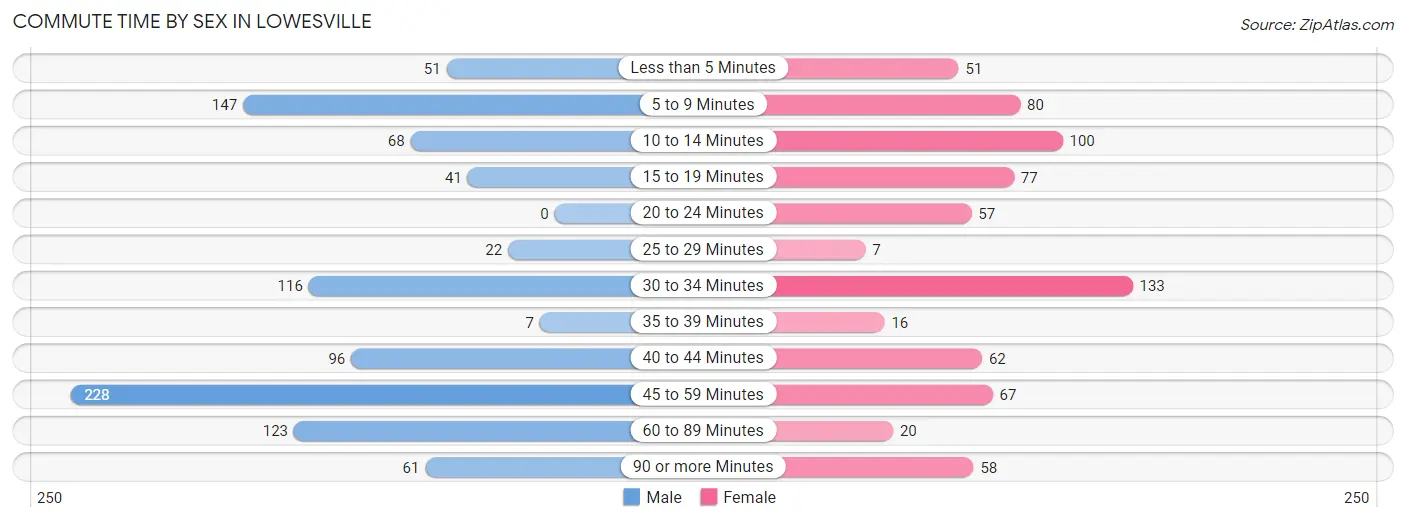
| Commute Time | Male | Female |
| Less than 5 Minutes | 51 (5.3%) | 51 (7.0%) |
| 5 to 9 Minutes | 147 (15.3%) | 80 (11.0%) |
| 10 to 14 Minutes | 68 (7.1%) | 100 (13.7%) |
| 15 to 19 Minutes | 41 (4.3%) | 77 (10.6%) |
| 20 to 24 Minutes | 0 (0.0%) | 57 (7.8%) |
| 25 to 29 Minutes | 22 (2.3%) | 7 (1.0%) |
| 30 to 34 Minutes | 116 (12.1%) | 133 (18.3%) |
| 35 to 39 Minutes | 7 (0.7%) | 16 (2.2%) |
| 40 to 44 Minutes | 96 (10.0%) | 62 (8.5%) |
| 45 to 59 Minutes | 228 (23.7%) | 67 (9.2%) |
| 60 to 89 Minutes | 123 (12.8%) | 20 (2.8%) |
| 90 or more Minutes | 61 (6.4%) | 58 (8.0%) |
Time of Departure to Work by Sex in Lowesville
The most frequent times of departure to work in Lowesville are 6:00 AM to 6:29 AM (148, 15.4%) for males and 7:30 AM to 7:59 AM (192, 26.4%) for females.
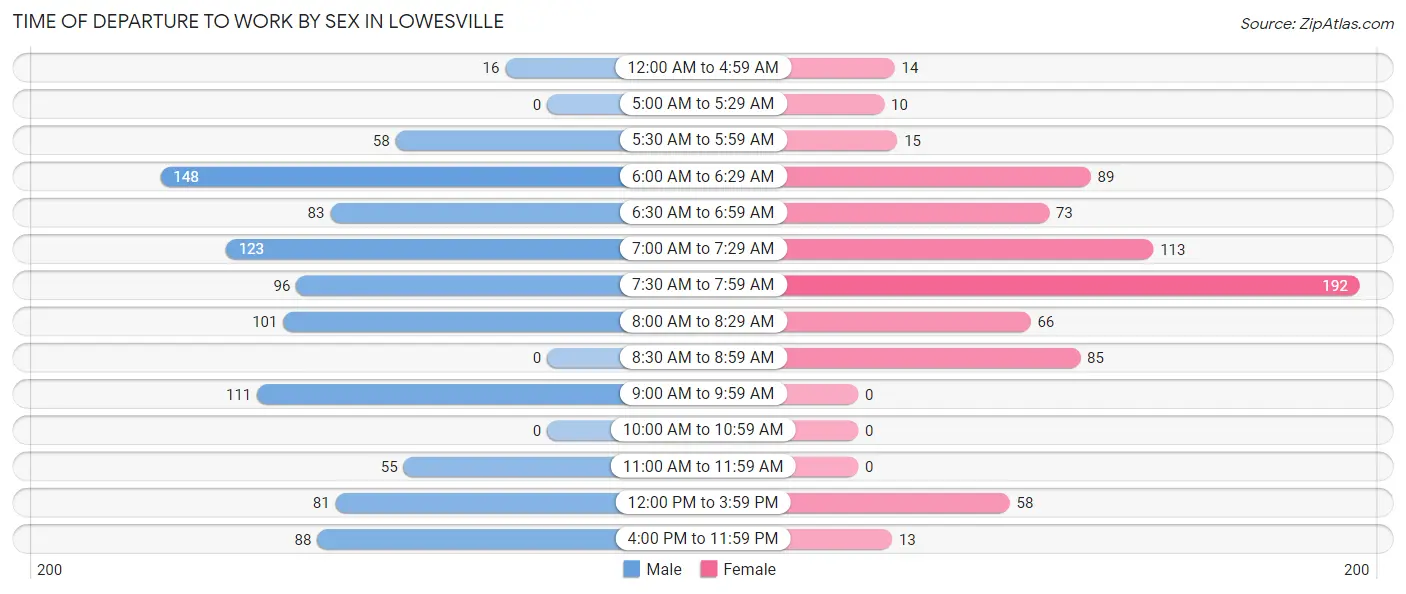
| Time of Departure | Male | Female |
| 12:00 AM to 4:59 AM | 16 (1.7%) | 14 (1.9%) |
| 5:00 AM to 5:29 AM | 0 (0.0%) | 10 (1.4%) |
| 5:30 AM to 5:59 AM | 58 (6.0%) | 15 (2.1%) |
| 6:00 AM to 6:29 AM | 148 (15.4%) | 89 (12.2%) |
| 6:30 AM to 6:59 AM | 83 (8.6%) | 73 (10.0%) |
| 7:00 AM to 7:29 AM | 123 (12.8%) | 113 (15.5%) |
| 7:30 AM to 7:59 AM | 96 (10.0%) | 192 (26.4%) |
| 8:00 AM to 8:29 AM | 101 (10.5%) | 66 (9.1%) |
| 8:30 AM to 8:59 AM | 0 (0.0%) | 85 (11.7%) |
| 9:00 AM to 9:59 AM | 111 (11.6%) | 0 (0.0%) |
| 10:00 AM to 10:59 AM | 0 (0.0%) | 0 (0.0%) |
| 11:00 AM to 11:59 AM | 55 (5.7%) | 0 (0.0%) |
| 12:00 PM to 3:59 PM | 81 (8.4%) | 58 (8.0%) |
| 4:00 PM to 11:59 PM | 88 (9.2%) | 13 (1.8%) |
| Total | 960 (100.0%) | 728 (100.0%) |
Housing Occupancy in Lowesville
Occupancy by Ownership in Lowesville
Of the total 1,378 dwellings in Lowesville, owner-occupied units account for 1,172 (85.1%), while renter-occupied units make up 206 (14.9%).
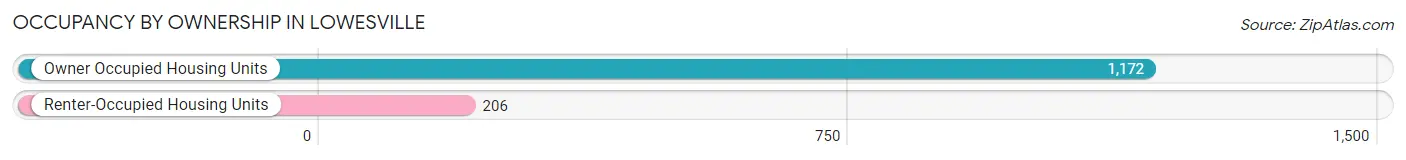
| Occupancy | # Housing Units | % Housing Units |
| Owner Occupied Housing Units | 1,172 | 85.1% |
| Renter-Occupied Housing Units | 206 | 14.9% |
| Total Occupied Housing Units | 1,378 | 100.0% |
Occupancy by Household Size in Lowesville
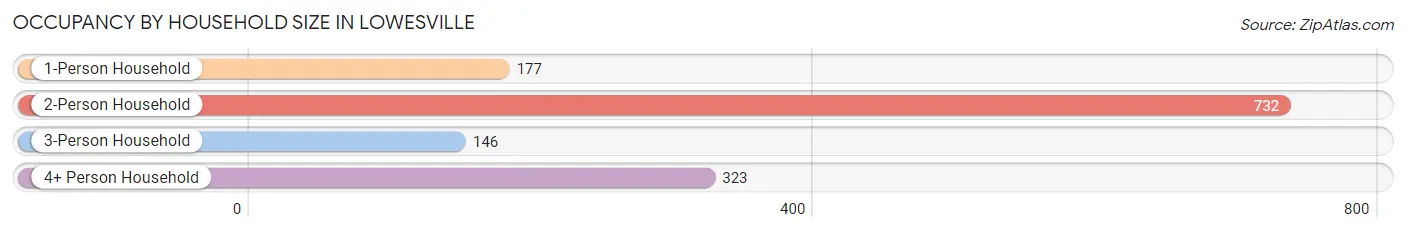
| Household Size | # Housing Units | % Housing Units |
| 1-Person Household | 177 | 12.8% |
| 2-Person Household | 732 | 53.1% |
| 3-Person Household | 146 | 10.6% |
| 4+ Person Household | 323 | 23.4% |
| Total Housing Units | 1,378 | 100.0% |
Occupancy by Ownership by Household Size in Lowesville
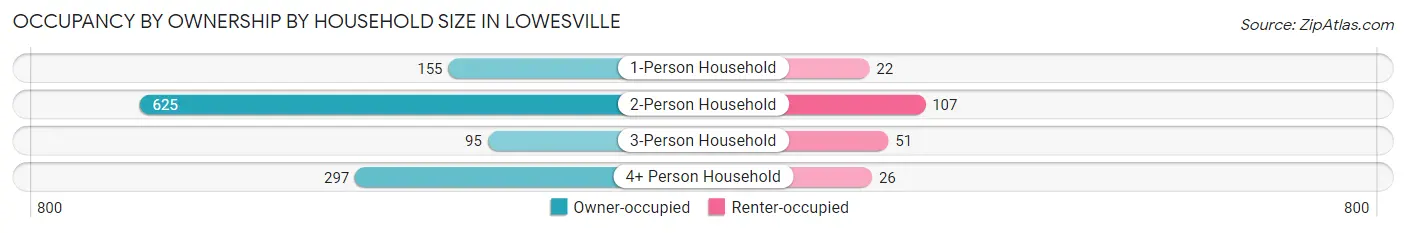
| Household Size | Owner-occupied | Renter-occupied |
| 1-Person Household | 155 (87.6%) | 22 (12.4%) |
| 2-Person Household | 625 (85.4%) | 107 (14.6%) |
| 3-Person Household | 95 (65.1%) | 51 (34.9%) |
| 4+ Person Household | 297 (91.9%) | 26 (8.1%) |
| Total Housing Units | 1,172 (85.1%) | 206 (14.9%) |
Occupancy by Educational Attainment in Lowesville
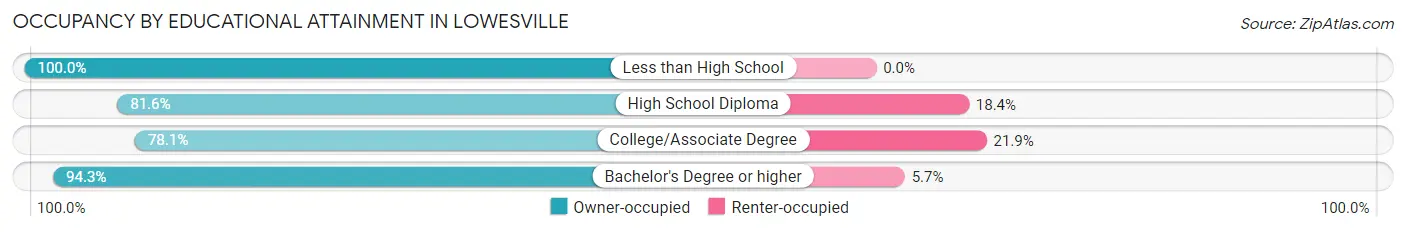
| Household Size | Owner-occupied | Renter-occupied |
| Less than High School | 71 (100.0%) | 0 (0.0%) |
| High School Diploma | 262 (81.6%) | 59 (18.4%) |
| College/Associate Degree | 439 (78.1%) | 123 (21.9%) |
| Bachelor's Degree or higher | 400 (94.3%) | 24 (5.7%) |
Occupancy by Age of Householder in Lowesville
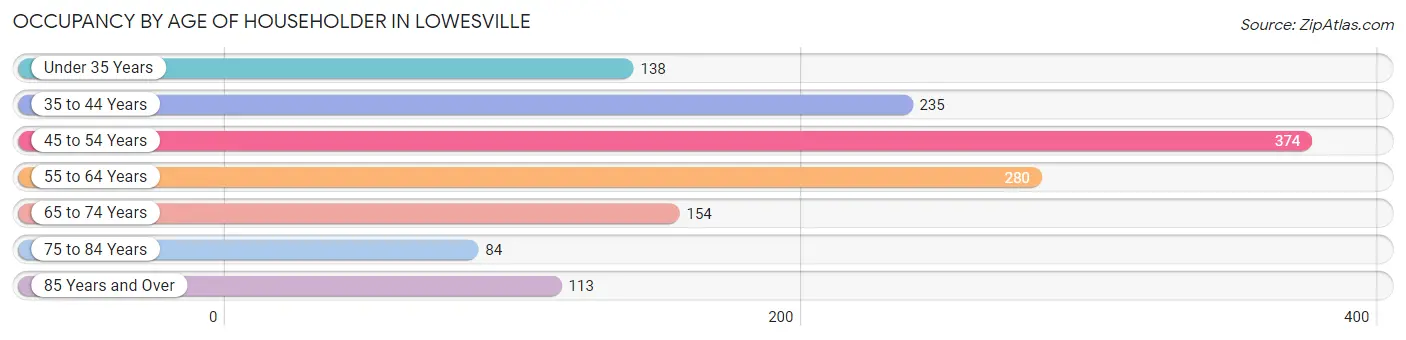
| Age Bracket | # Households | % Households |
| Under 35 Years | 138 | 10.0% |
| 35 to 44 Years | 235 | 17.1% |
| 45 to 54 Years | 374 | 27.1% |
| 55 to 64 Years | 280 | 20.3% |
| 65 to 74 Years | 154 | 11.2% |
| 75 to 84 Years | 84 | 6.1% |
| 85 Years and Over | 113 | 8.2% |
| Total | 1,378 | 100.0% |
Housing Finances in Lowesville
Median Income by Occupancy in Lowesville
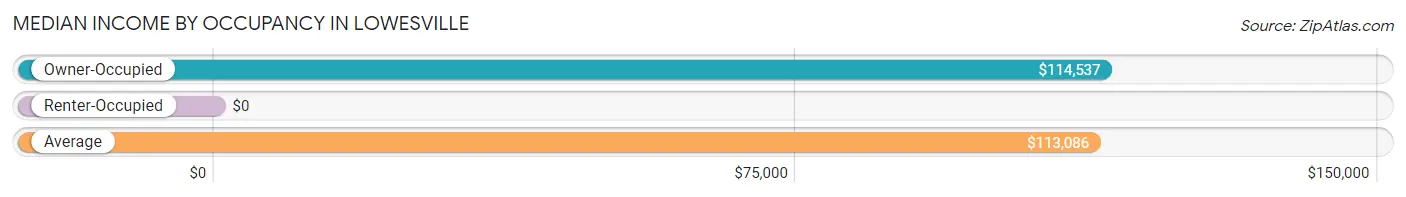
| Occupancy Type | # Households | Median Income |
| Owner-Occupied | 1,172 (85.1%) | $114,537 |
| Renter-Occupied | 206 (14.9%) | $0 |
| Average | 1,378 (100.0%) | $113,086 |
Occupancy by Householder Income Bracket in Lowesville
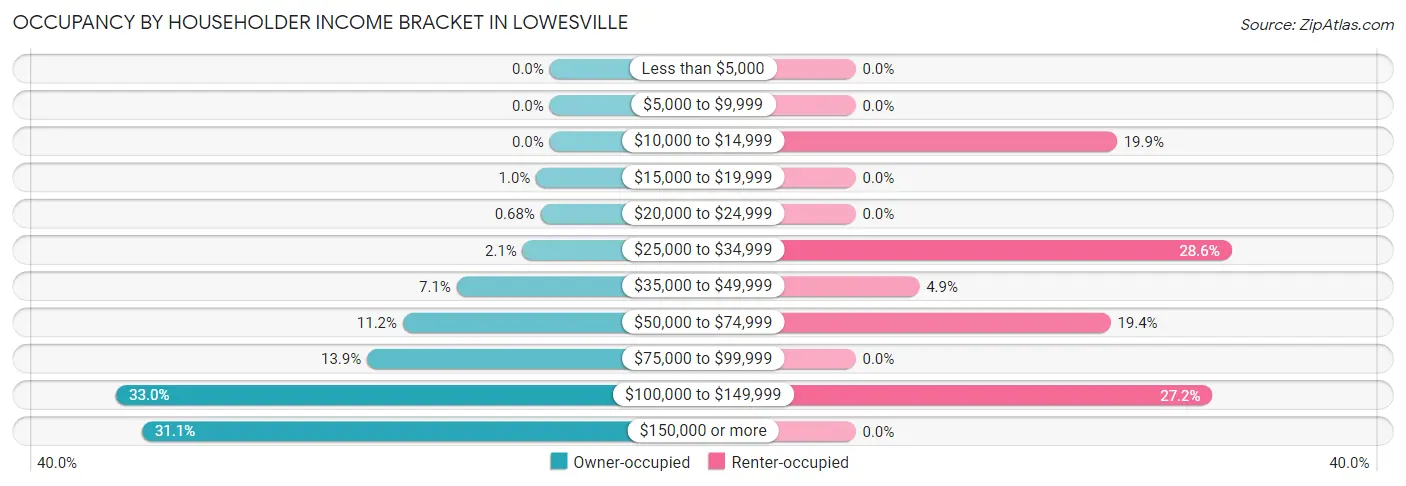
| Income Bracket | Owner-occupied | Renter-occupied |
| Less than $5,000 | 0 (0.0%) | 0 (0.0%) |
| $5,000 to $9,999 | 0 (0.0%) | 0 (0.0%) |
| $10,000 to $14,999 | 0 (0.0%) | 41 (19.9%) |
| $15,000 to $19,999 | 12 (1.0%) | 0 (0.0%) |
| $20,000 to $24,999 | 8 (0.7%) | 0 (0.0%) |
| $25,000 to $34,999 | 24 (2.1%) | 59 (28.6%) |
| $35,000 to $49,999 | 83 (7.1%) | 10 (4.9%) |
| $50,000 to $74,999 | 131 (11.2%) | 40 (19.4%) |
| $75,000 to $99,999 | 163 (13.9%) | 0 (0.0%) |
| $100,000 to $149,999 | 387 (33.0%) | 56 (27.2%) |
| $150,000 or more | 364 (31.1%) | 0 (0.0%) |
| Total | 1,172 (100.0%) | 206 (100.0%) |
Monthly Housing Cost Tiers in Lowesville
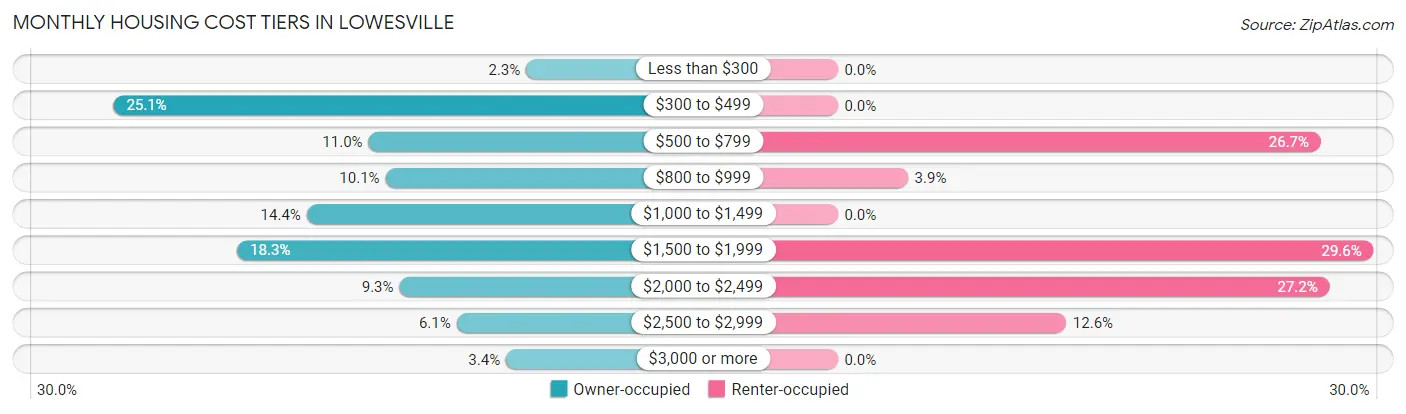
| Monthly Cost | Owner-occupied | Renter-occupied |
| Less than $300 | 27 (2.3%) | 0 (0.0%) |
| $300 to $499 | 294 (25.1%) | 0 (0.0%) |
| $500 to $799 | 129 (11.0%) | 55 (26.7%) |
| $800 to $999 | 118 (10.1%) | 8 (3.9%) |
| $1,000 to $1,499 | 169 (14.4%) | 0 (0.0%) |
| $1,500 to $1,999 | 214 (18.3%) | 61 (29.6%) |
| $2,000 to $2,499 | 109 (9.3%) | 56 (27.2%) |
| $2,500 to $2,999 | 72 (6.1%) | 26 (12.6%) |
| $3,000 or more | 40 (3.4%) | 0 (0.0%) |
| Total | 1,172 (100.0%) | 206 (100.0%) |
Physical Housing Characteristics in Lowesville
Housing Structures in Lowesville
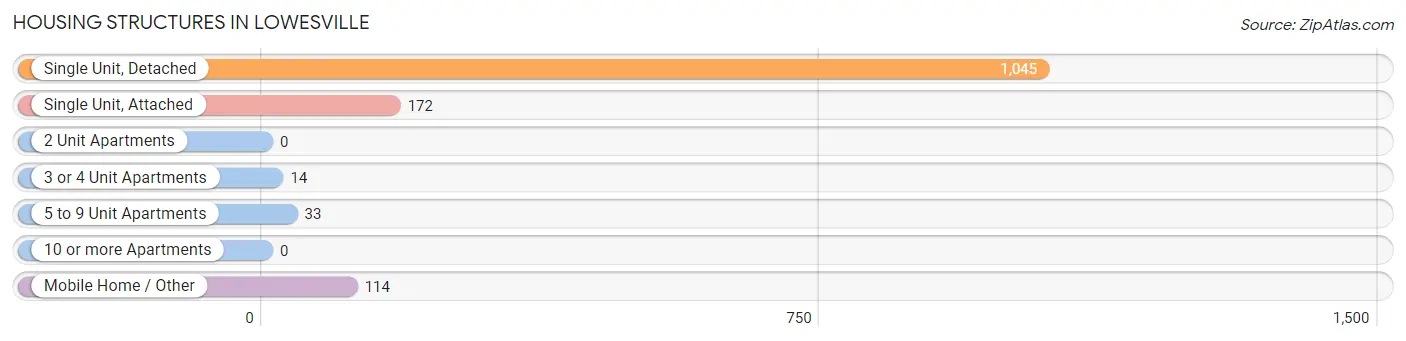
| Structure Type | # Housing Units | % Housing Units |
| Single Unit, Detached | 1,045 | 75.8% |
| Single Unit, Attached | 172 | 12.5% |
| 2 Unit Apartments | 0 | 0.0% |
| 3 or 4 Unit Apartments | 14 | 1.0% |
| 5 to 9 Unit Apartments | 33 | 2.4% |
| 10 or more Apartments | 0 | 0.0% |
| Mobile Home / Other | 114 | 8.3% |
| Total | 1,378 | 100.0% |
Housing Structures by Occupancy in Lowesville
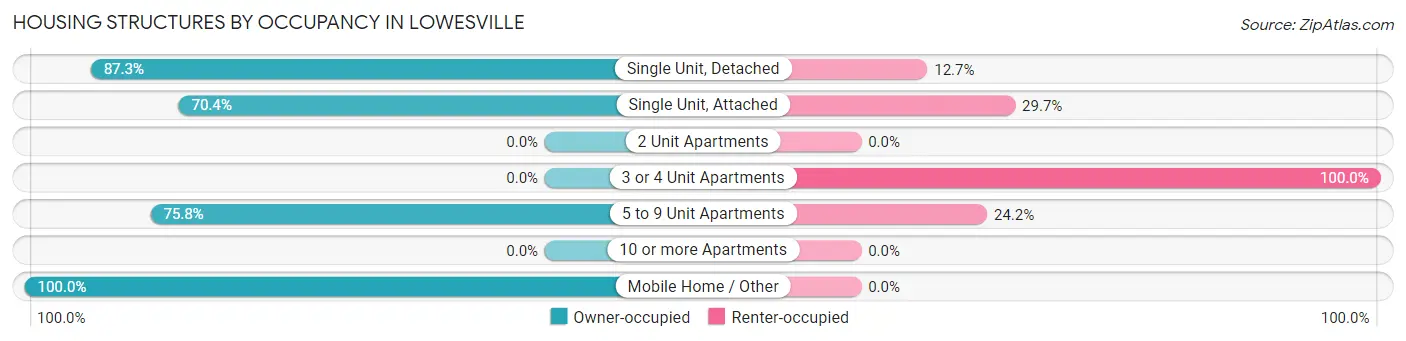
| Structure Type | Owner-occupied | Renter-occupied |
| Single Unit, Detached | 912 (87.3%) | 133 (12.7%) |
| Single Unit, Attached | 121 (70.4%) | 51 (29.6%) |
| 2 Unit Apartments | 0 (0.0%) | 0 (0.0%) |
| 3 or 4 Unit Apartments | 0 (0.0%) | 14 (100.0%) |
| 5 to 9 Unit Apartments | 25 (75.8%) | 8 (24.2%) |
| 10 or more Apartments | 0 (0.0%) | 0 (0.0%) |
| Mobile Home / Other | 114 (100.0%) | 0 (0.0%) |
| Total | 1,172 (85.1%) | 206 (14.9%) |
Housing Structures by Number of Rooms in Lowesville
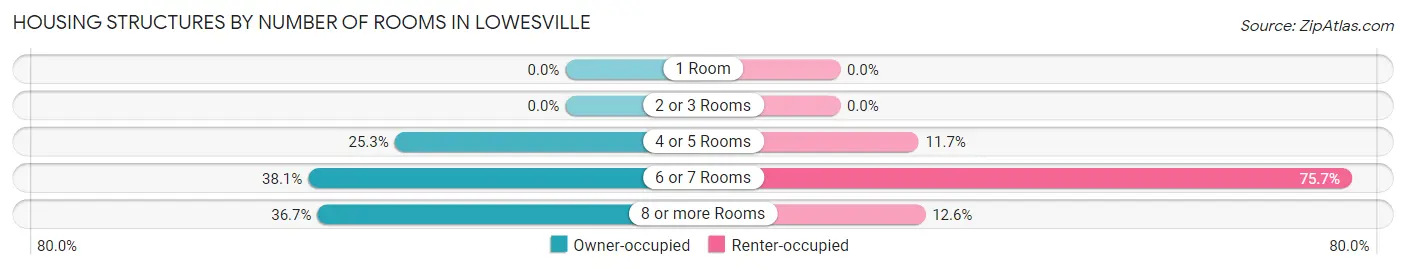
| Number of Rooms | Owner-occupied | Renter-occupied |
| 1 Room | 0 (0.0%) | 0 (0.0%) |
| 2 or 3 Rooms | 0 (0.0%) | 0 (0.0%) |
| 4 or 5 Rooms | 296 (25.3%) | 24 (11.7%) |
| 6 or 7 Rooms | 446 (38.1%) | 156 (75.7%) |
| 8 or more Rooms | 430 (36.7%) | 26 (12.6%) |
| Total | 1,172 (100.0%) | 206 (100.0%) |
Housing Structure by Heating Type in Lowesville
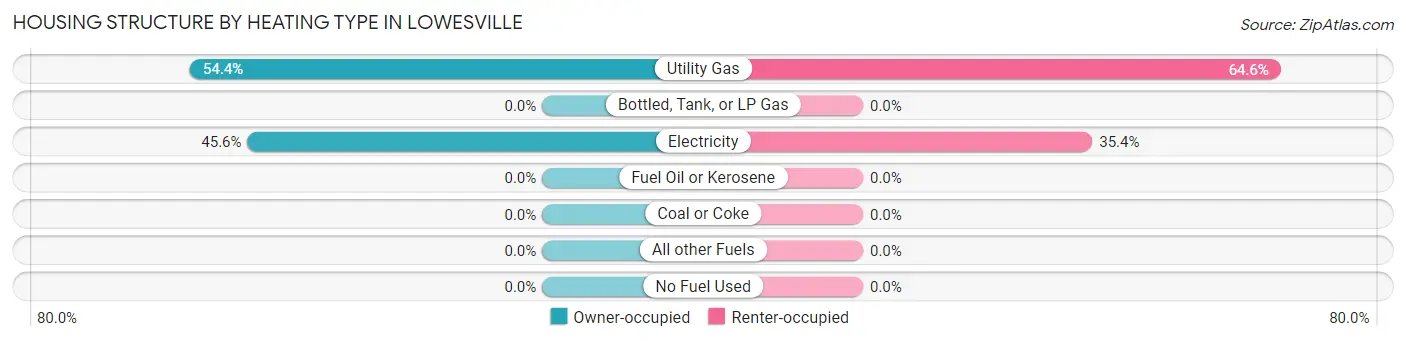
| Heating Type | Owner-occupied | Renter-occupied |
| Utility Gas | 638 (54.4%) | 133 (64.6%) |
| Bottled, Tank, or LP Gas | 0 (0.0%) | 0 (0.0%) |
| Electricity | 534 (45.6%) | 73 (35.4%) |
| Fuel Oil or Kerosene | 0 (0.0%) | 0 (0.0%) |
| Coal or Coke | 0 (0.0%) | 0 (0.0%) |
| All other Fuels | 0 (0.0%) | 0 (0.0%) |
| No Fuel Used | 0 (0.0%) | 0 (0.0%) |
| Total | 1,172 (100.0%) | 206 (100.0%) |
Household Vehicle Usage in Lowesville
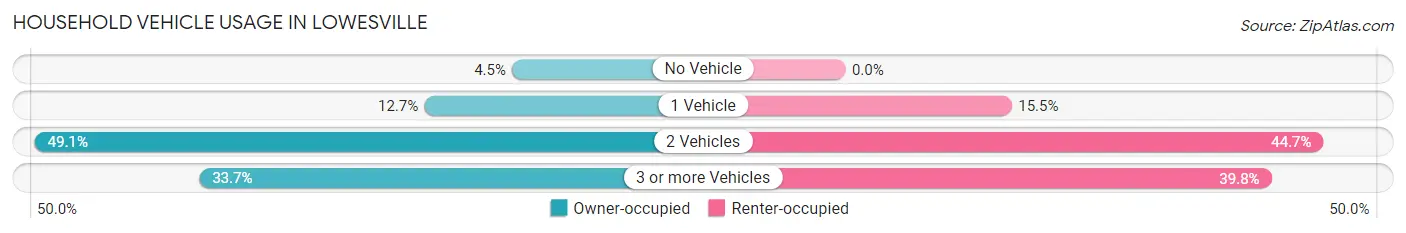
| Vehicles per Household | Owner-occupied | Renter-occupied |
| No Vehicle | 53 (4.5%) | 0 (0.0%) |
| 1 Vehicle | 149 (12.7%) | 32 (15.5%) |
| 2 Vehicles | 575 (49.1%) | 92 (44.7%) |
| 3 or more Vehicles | 395 (33.7%) | 82 (39.8%) |
| Total | 1,172 (100.0%) | 206 (100.0%) |
Real Estate & Mortgages in Lowesville
Real Estate and Mortgage Overview in Lowesville
| Characteristic | Without Mortgage | With Mortgage |
| Housing Units | 395 | 777 |
| Median Property Value | $390,000 | $337,800 |
| Median Household Income | $88,875 | $275 |
| Monthly Housing Costs | $407 | $40 |
| Real Estate Taxes | $1,674 | $25 |
Property Value by Mortgage Status in Lowesville
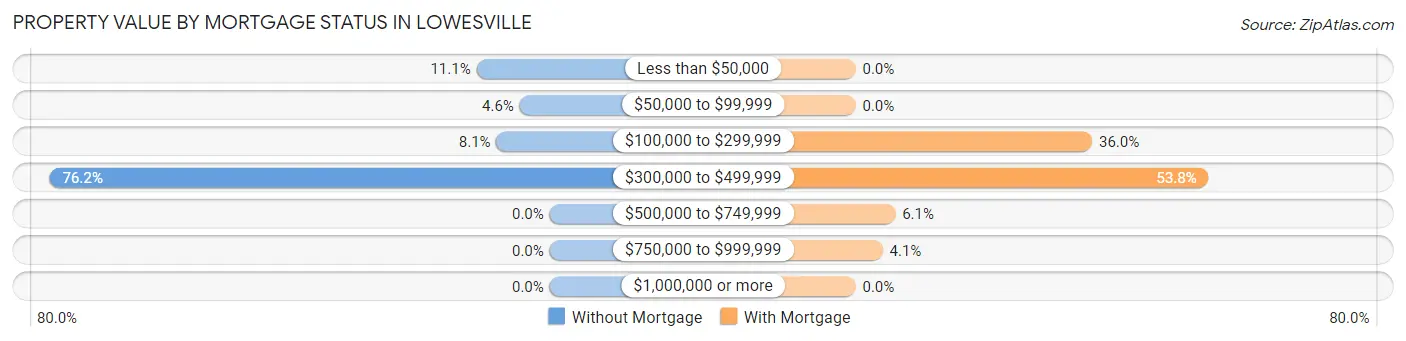
| Property Value | Without Mortgage | With Mortgage |
| Less than $50,000 | 44 (11.1%) | 0 (0.0%) |
| $50,000 to $99,999 | 18 (4.6%) | 0 (0.0%) |
| $100,000 to $299,999 | 32 (8.1%) | 280 (36.0%) |
| $300,000 to $499,999 | 301 (76.2%) | 418 (53.8%) |
| $500,000 to $749,999 | 0 (0.0%) | 47 (6.0%) |
| $750,000 to $999,999 | 0 (0.0%) | 32 (4.1%) |
| $1,000,000 or more | 0 (0.0%) | 0 (0.0%) |
| Total | 395 (100.0%) | 777 (100.0%) |
Household Income by Mortgage Status in Lowesville
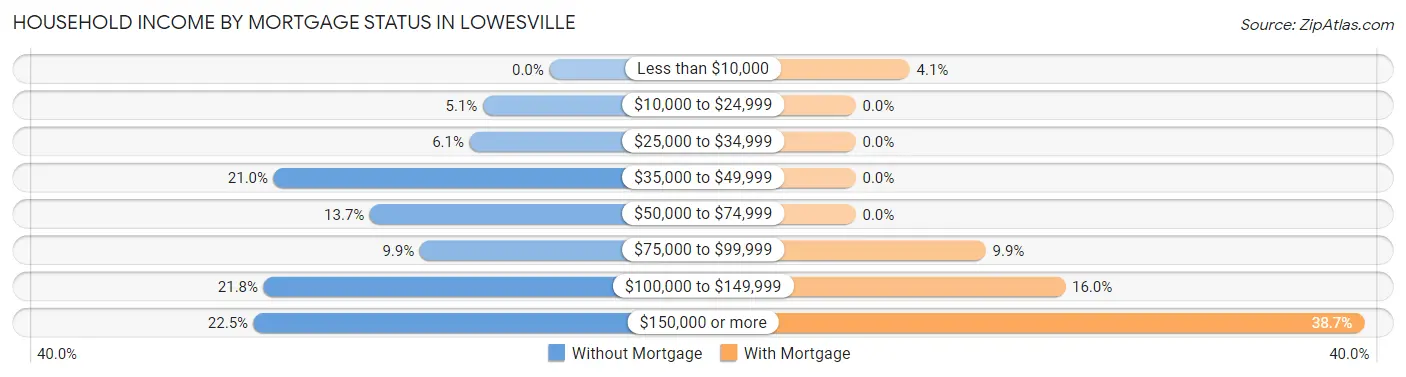
| Household Income | Without Mortgage | With Mortgage |
| Less than $10,000 | 0 (0.0%) | 32 (4.1%) |
| $10,000 to $24,999 | 20 (5.1%) | 0 (0.0%) |
| $25,000 to $34,999 | 24 (6.1%) | 0 (0.0%) |
| $35,000 to $49,999 | 83 (21.0%) | 0 (0.0%) |
| $50,000 to $74,999 | 54 (13.7%) | 0 (0.0%) |
| $75,000 to $99,999 | 39 (9.9%) | 77 (9.9%) |
| $100,000 to $149,999 | 86 (21.8%) | 124 (16.0%) |
| $150,000 or more | 89 (22.5%) | 301 (38.7%) |
| Total | 395 (100.0%) | 777 (100.0%) |
Property Value to Household Income Ratio in Lowesville
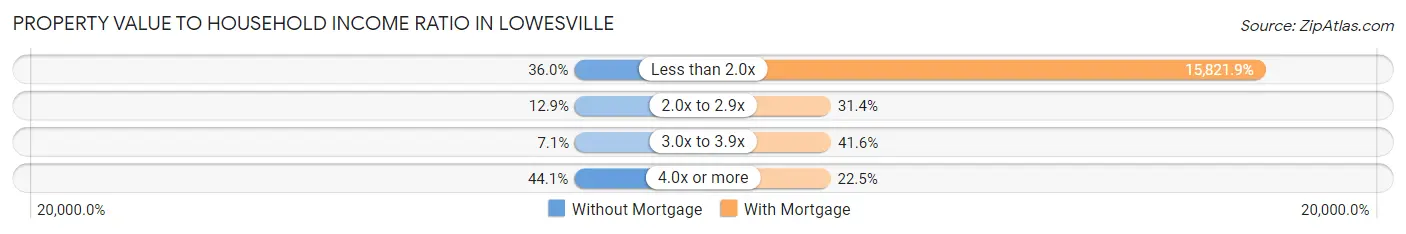
| Value-to-Income Ratio | Without Mortgage | With Mortgage |
| Less than 2.0x | 142 (35.9%) | 122,936 (15,821.9%) |
| 2.0x to 2.9x | 51 (12.9%) | 244 (31.4%) |
| 3.0x to 3.9x | 28 (7.1%) | 323 (41.6%) |
| 4.0x or more | 174 (44.1%) | 175 (22.5%) |
| Total | 395 (100.0%) | 777 (100.0%) |
Real Estate Taxes by Mortgage Status in Lowesville
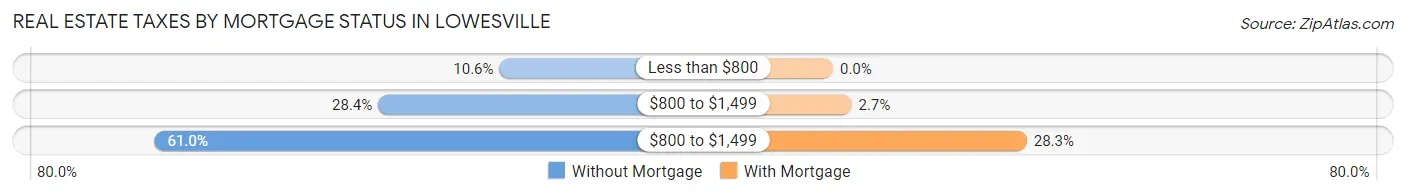
| Property Taxes | Without Mortgage | With Mortgage |
| Less than $800 | 42 (10.6%) | 0 (0.0%) |
| $800 to $1,499 | 112 (28.3%) | 21 (2.7%) |
| $800 to $1,499 | 241 (61.0%) | 220 (28.3%) |
| Total | 395 (100.0%) | 777 (100.0%) |
Health & Disability in Lowesville
Health Insurance Coverage by Age in Lowesville
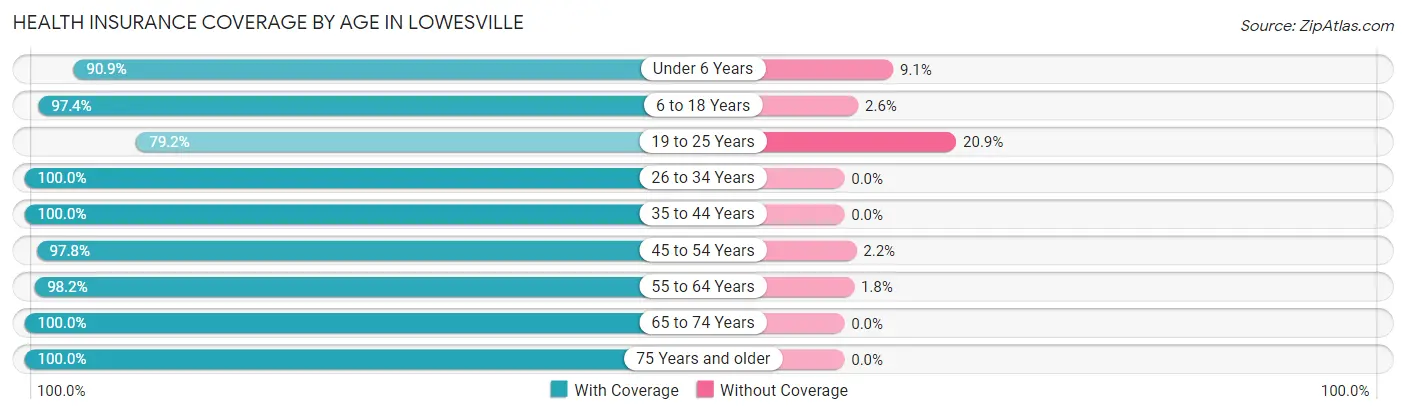
| Age Bracket | With Coverage | Without Coverage |
| Under 6 Years | 210 (90.9%) | 21 (9.1%) |
| 6 to 18 Years | 606 (97.4%) | 16 (2.6%) |
| 19 to 25 Years | 205 (79.1%) | 54 (20.8%) |
| 26 to 34 Years | 289 (100.0%) | 0 (0.0%) |
| 35 to 44 Years | 484 (100.0%) | 0 (0.0%) |
| 45 to 54 Years | 655 (97.8%) | 15 (2.2%) |
| 55 to 64 Years | 327 (98.2%) | 6 (1.8%) |
| 65 to 74 Years | 278 (100.0%) | 0 (0.0%) |
| 75 Years and older | 401 (100.0%) | 0 (0.0%) |
| Total | 3,455 (96.9%) | 112 (3.1%) |
Health Insurance Coverage by Citizenship Status in Lowesville
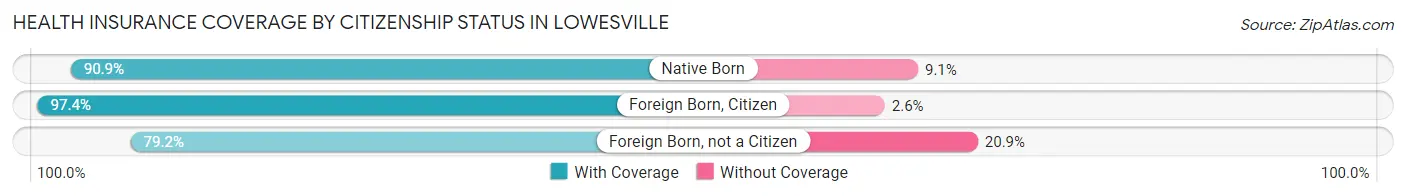
| Citizenship Status | With Coverage | Without Coverage |
| Native Born | 210 (90.9%) | 21 (9.1%) |
| Foreign Born, Citizen | 606 (97.4%) | 16 (2.6%) |
| Foreign Born, not a Citizen | 205 (79.1%) | 54 (20.8%) |
Health Insurance Coverage by Household Income in Lowesville
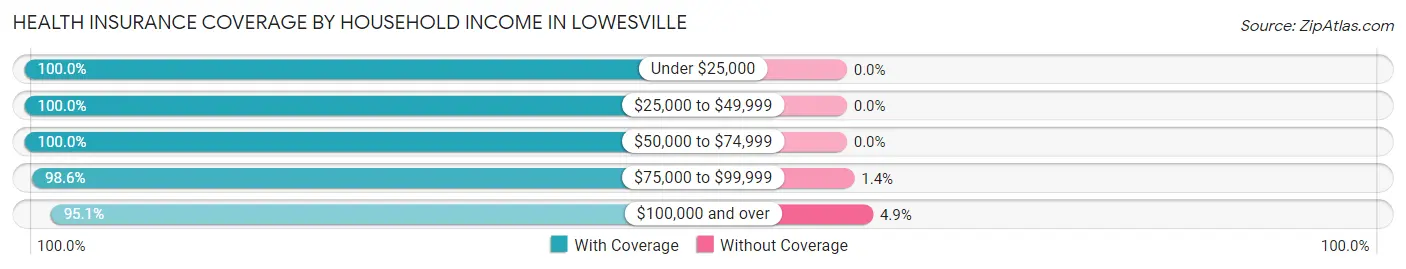
| Household Income | With Coverage | Without Coverage |
| Under $25,000 | 93 (100.0%) | 0 (0.0%) |
| $25,000 to $49,999 | 323 (100.0%) | 0 (0.0%) |
| $50,000 to $74,999 | 564 (100.0%) | 0 (0.0%) |
| $75,000 to $99,999 | 418 (98.6%) | 6 (1.4%) |
| $100,000 and over | 2,057 (95.1%) | 106 (4.9%) |
Public vs Private Health Insurance Coverage by Age in Lowesville
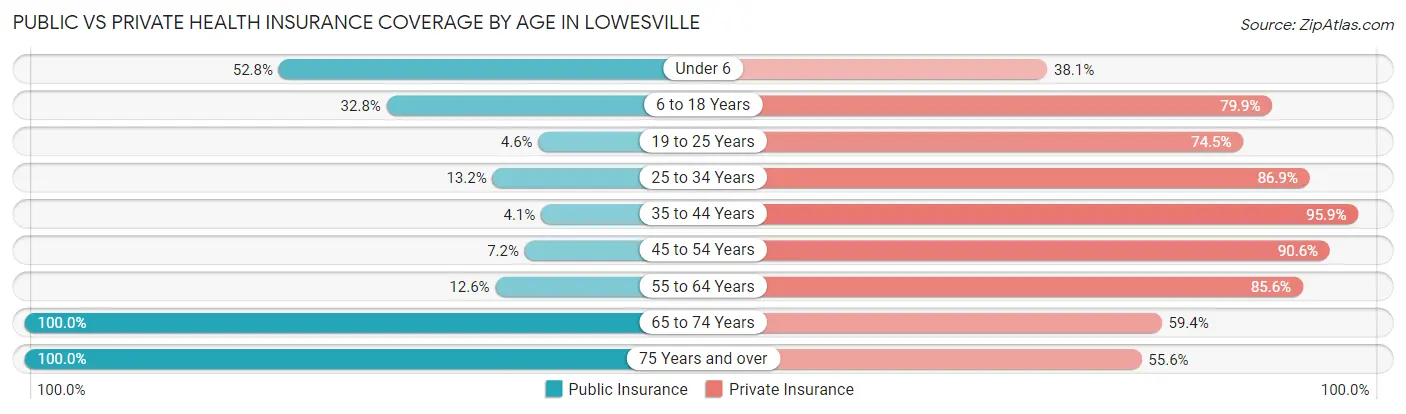
| Age Bracket | Public Insurance | Private Insurance |
| Under 6 | 122 (52.8%) | 88 (38.1%) |
| 6 to 18 Years | 204 (32.8%) | 497 (79.9%) |
| 19 to 25 Years | 12 (4.6%) | 193 (74.5%) |
| 25 to 34 Years | 38 (13.2%) | 251 (86.9%) |
| 35 to 44 Years | 20 (4.1%) | 464 (95.9%) |
| 45 to 54 Years | 48 (7.2%) | 607 (90.6%) |
| 55 to 64 Years | 42 (12.6%) | 285 (85.6%) |
| 65 to 74 Years | 278 (100.0%) | 165 (59.4%) |
| 75 Years and over | 401 (100.0%) | 223 (55.6%) |
| Total | 1,165 (32.7%) | 2,773 (77.7%) |
Disability Status by Sex by Age in Lowesville
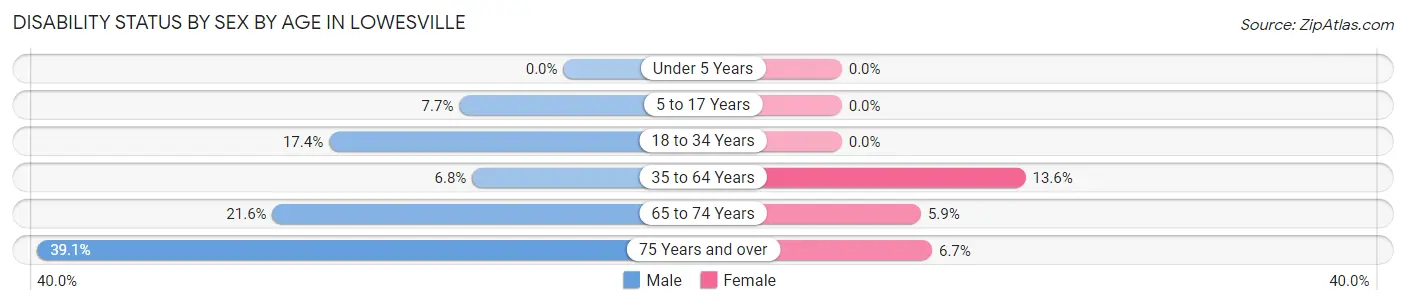
| Age Bracket | Male | Female |
| Under 5 Years | 0 (0.0%) | 0 (0.0%) |
| 5 to 17 Years | 31 (7.7%) | 0 (0.0%) |
| 18 to 34 Years | 67 (17.4%) | 0 (0.0%) |
| 35 to 64 Years | 50 (6.8%) | 102 (13.6%) |
| 65 to 74 Years | 27 (21.6%) | 9 (5.9%) |
| 75 Years and over | 75 (39.1%) | 14 (6.7%) |
Disability Class by Sex by Age in Lowesville
Disability Class: Hearing Difficulty
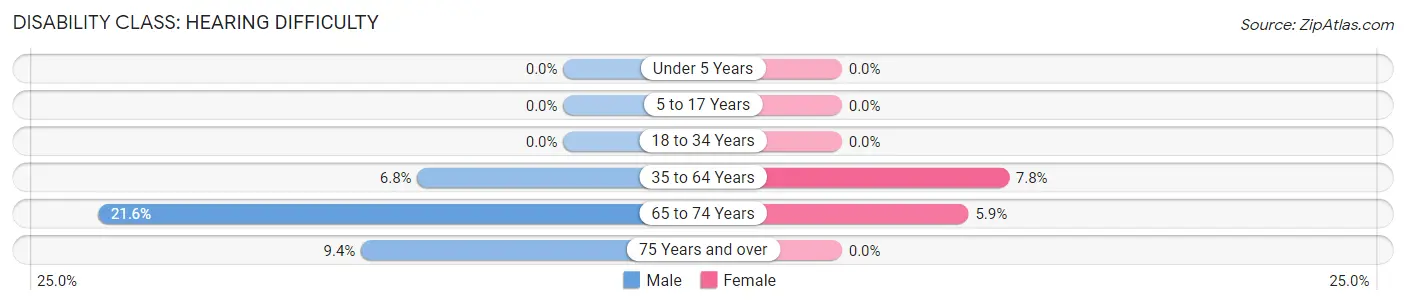
| Age Bracket | Male | Female |
| Under 5 Years | 0 (0.0%) | 0 (0.0%) |
| 5 to 17 Years | 0 (0.0%) | 0 (0.0%) |
| 18 to 34 Years | 0 (0.0%) | 0 (0.0%) |
| 35 to 64 Years | 50 (6.8%) | 58 (7.7%) |
| 65 to 74 Years | 27 (21.6%) | 9 (5.9%) |
| 75 Years and over | 18 (9.4%) | 0 (0.0%) |
Disability Class: Vision Difficulty
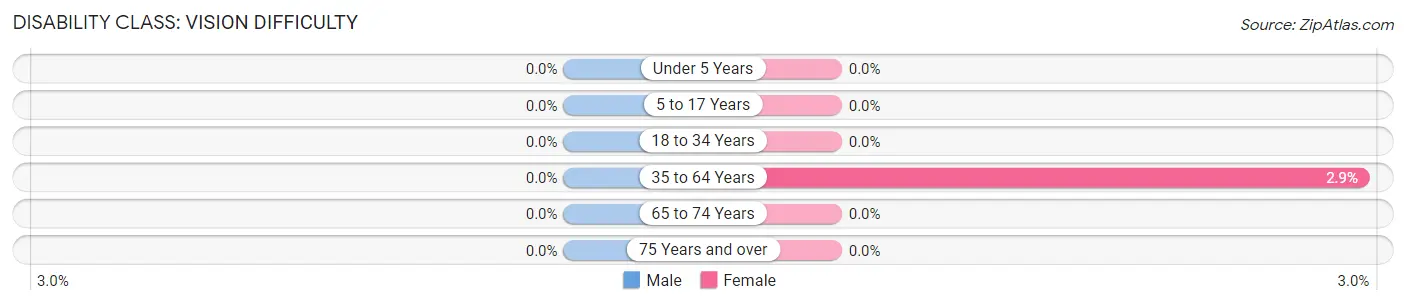
| Age Bracket | Male | Female |
| Under 5 Years | 0 (0.0%) | 0 (0.0%) |
| 5 to 17 Years | 0 (0.0%) | 0 (0.0%) |
| 18 to 34 Years | 0 (0.0%) | 0 (0.0%) |
| 35 to 64 Years | 0 (0.0%) | 22 (2.9%) |
| 65 to 74 Years | 0 (0.0%) | 0 (0.0%) |
| 75 Years and over | 0 (0.0%) | 0 (0.0%) |
Disability Class: Cognitive Difficulty
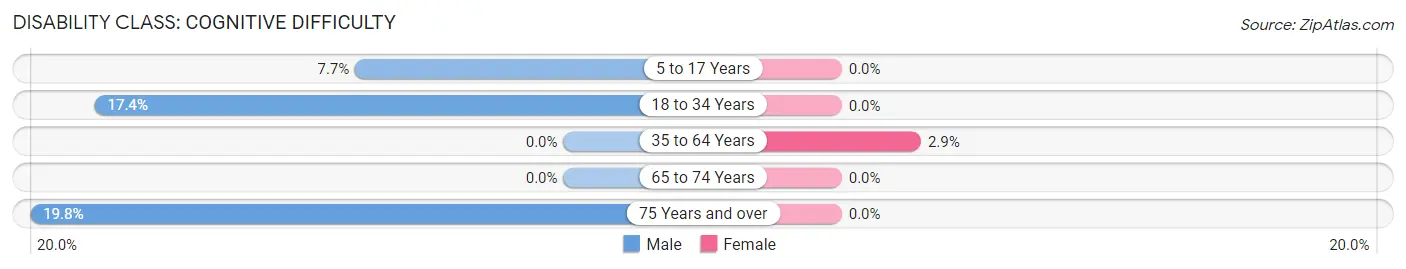
| Age Bracket | Male | Female |
| 5 to 17 Years | 31 (7.7%) | 0 (0.0%) |
| 18 to 34 Years | 67 (17.4%) | 0 (0.0%) |
| 35 to 64 Years | 0 (0.0%) | 22 (2.9%) |
| 65 to 74 Years | 0 (0.0%) | 0 (0.0%) |
| 75 Years and over | 38 (19.8%) | 0 (0.0%) |
Disability Class: Ambulatory Difficulty
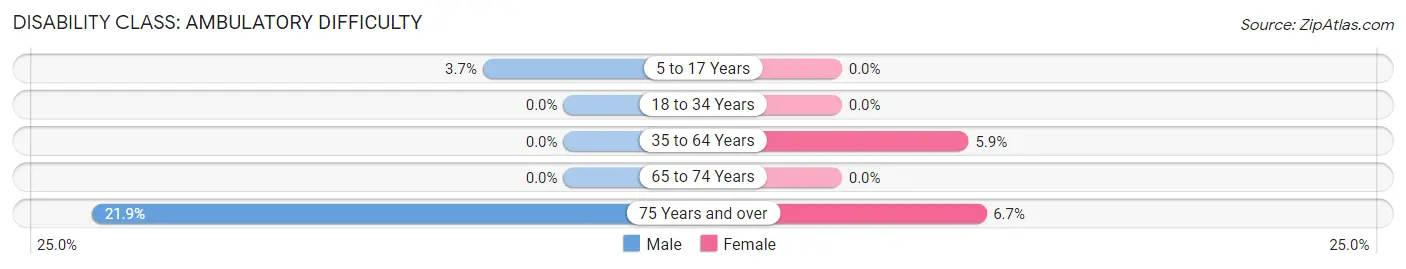
| Age Bracket | Male | Female |
| 5 to 17 Years | 15 (3.7%) | 0 (0.0%) |
| 18 to 34 Years | 0 (0.0%) | 0 (0.0%) |
| 35 to 64 Years | 0 (0.0%) | 44 (5.9%) |
| 65 to 74 Years | 0 (0.0%) | 0 (0.0%) |
| 75 Years and over | 42 (21.9%) | 14 (6.7%) |
Disability Class: Self-Care Difficulty
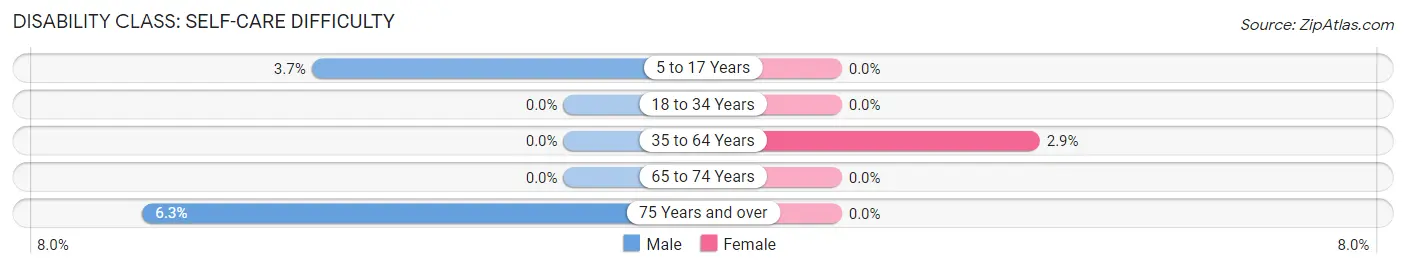
| Age Bracket | Male | Female |
| 5 to 17 Years | 15 (3.7%) | 0 (0.0%) |
| 18 to 34 Years | 0 (0.0%) | 0 (0.0%) |
| 35 to 64 Years | 0 (0.0%) | 22 (2.9%) |
| 65 to 74 Years | 0 (0.0%) | 0 (0.0%) |
| 75 Years and over | 12 (6.2%) | 0 (0.0%) |
Technology Access in Lowesville
Computing Device Access in Lowesville
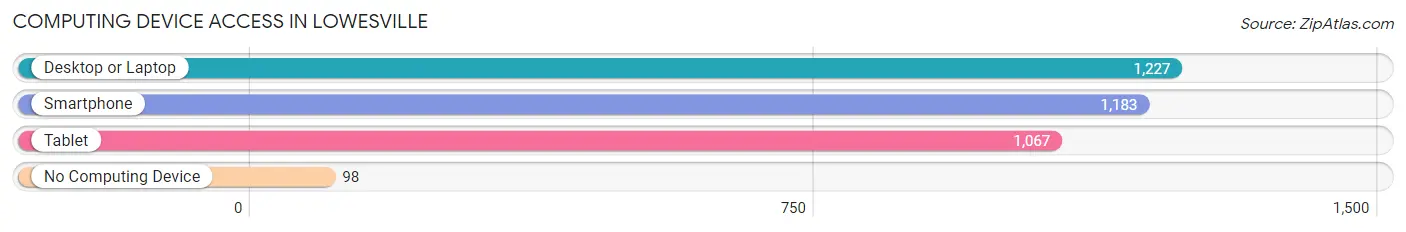
| Device Type | # Households | % Households |
| Desktop or Laptop | 1,227 | 89.0% |
| Smartphone | 1,183 | 85.9% |
| Tablet | 1,067 | 77.4% |
| No Computing Device | 98 | 7.1% |
| Total | 1,378 | 100.0% |
Internet Access in Lowesville
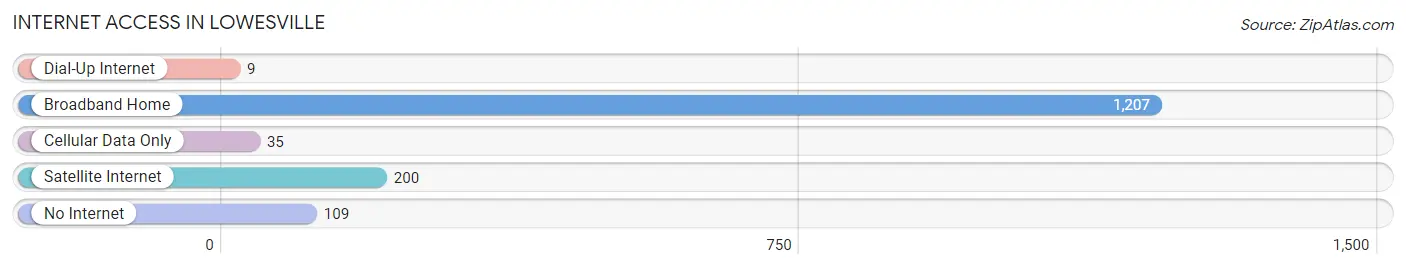
| Internet Type | # Households | % Households |
| Dial-Up Internet | 9 | 0.6% |
| Broadband Home | 1,207 | 87.6% |
| Cellular Data Only | 35 | 2.5% |
| Satellite Internet | 200 | 14.5% |
| No Internet | 109 | 7.9% |
| Total | 1,378 | 100.0% |
Lowesville Summary
Lowesville is a small town located in the foothills of the Blue Ridge Mountains in western North Carolina. It is situated in the foothills of the Blue Ridge Mountains, and is part of the larger Catawba Valley region. The town is located in the county of Lincoln, and is part of the Hickory-Lenoir-Morganton Metropolitan Statistical Area. The town has a population of approximately 1,000 people, and is a rural community with a strong agricultural base.
History
Lowesville was founded in 1845 by a group of settlers from the nearby town of Lincolnton. The town was named after the nearby Lowesville Creek, which was named after the Low family, who were among the first settlers in the area. The town was originally a farming community, and the main crops grown were corn, wheat, and tobacco. The town also had a small sawmill, which provided lumber for the local area.
In the late 19th century, the town began to grow and develop, and the first post office was established in 1887. The town also had a school, a church, and a general store. In the early 20th century, the town began to experience a period of growth and prosperity, and the population increased to over 1,000 people.
Geography
Lowesville is located in the foothills of the Blue Ridge Mountains in western North Carolina. The town is situated in the county of Lincoln, and is part of the Hickory-Lenoir-Morganton Metropolitan Statistical Area. The town is located at an elevation of 1,000 feet, and is surrounded by rolling hills and forests. The town is located near the Catawba River, and is close to the towns of Lincolnton and Hickory.
The climate in Lowesville is mild and temperate, with hot summers and cold winters. The average annual temperature is around 60 degrees Fahrenheit, and the average annual precipitation is around 45 inches.
Economy
The economy of Lowesville is largely based on agriculture, and the town is home to several farms and agricultural businesses. The main crops grown in the area are corn, wheat, and tobacco. The town also has a small sawmill, which provides lumber for the local area.
In addition to agriculture, the town also has a few small businesses, including a general store, a restaurant, and a gas station. The town also has a few small manufacturing businesses, which produce furniture and other wood products.
Demographics
As of the 2010 census, the population of Lowesville was 1,000 people. The racial makeup of the town was 97.2% White, 0.7% African American, 0.3% Native American, 0.3% Asian, and 1.5% from other races. The median household income was $35,000, and the median family income was $41,000. The per capita income was $17,000.
Lowesville is a small, rural community with a strong agricultural base. The town has a strong sense of community, and the people are friendly and welcoming. The town is a great place to live, and offers a peaceful and relaxed lifestyle.
Common Questions
What is the Total Population of Lowesville?
Total Population of Lowesville is 3,567.
What is the Total Male Population of Lowesville?
Total Male Population of Lowesville is 1,888.
What is the Total Female Population of Lowesville?
Total Female Population of Lowesville is 1,679.
What is the Ratio of Males per 100 Females in Lowesville?
There are 112.45 Males per 100 Females in Lowesville.
What is the Ratio of Females per 100 Males in Lowesville?
There are 88.93 Females per 100 Males in Lowesville.
What is the Median Population Age in Lowesville?
Median Population Age in Lowesville is 43.4 Years.
What is the Average Family Size in Lowesville
Average Family Size in Lowesville is 2.9 People.
What is the Average Household Size in Lowesville
Average Household Size in Lowesville is 2.6 People.
What is Per Capita Income in Lowesville?
Per Capita income in Lowesville is $50,409.
What is the Median Family Income in Lowesville?
Median Family Income in Lowesville is $114,738.
What is the Median Household income in Lowesville?
Median Household Income in Lowesville is $113,086.
What is Income or Wage Gap in Lowesville?
Income or Wage Gap in Lowesville is 24.3%.
Women in Lowesville earn 75.7 cents for every dollar earned by a man.
What is Inequality or Gini Index in Lowesville?
Inequality or Gini Index in Lowesville is 0.37.
How Large is the Labor Force in Lowesville?
There are 2,056 People in the Labor Forcein in Lowesville.
What is the Percentage of People in the Labor Force in Lowesville?
72.2% of People are in the Labor Force in Lowesville.
What is the Unemployment Rate in Lowesville?
Unemployment Rate in Lowesville is 2.2%.