Glen Raven, NC
Glen Raven Map
Glen Raven Overview
3,710
TOTAL POPULATION
1,798
MALE POPULATION
1,912
FEMALE POPULATION
94.04
MALES / 100 FEMALES
106.34
FEMALES / 100 MALES
32.0
MEDIAN AGE
3.5
AVG FAMILY SIZE
2.9
AVG HOUSEHOLD SIZE
$24,514
PER CAPITA INCOME
$61,867
AVG FAMILY INCOME
$57,639
AVG HOUSEHOLD INCOME
44.2%
WAGE / INCOME GAP [ % ]
55.8¢/ $1
WAGE / INCOME GAP [ $ ]
$2,316
FAMILY INCOME DEFICIT
0.36
INEQUALITY / GINI INDEX
1,847
LABOR FORCE [ PEOPLE ]
65.0%
PERCENT IN LABOR FORCE
3.7%
UNEMPLOYMENT RATE
Glen Raven Area Codes
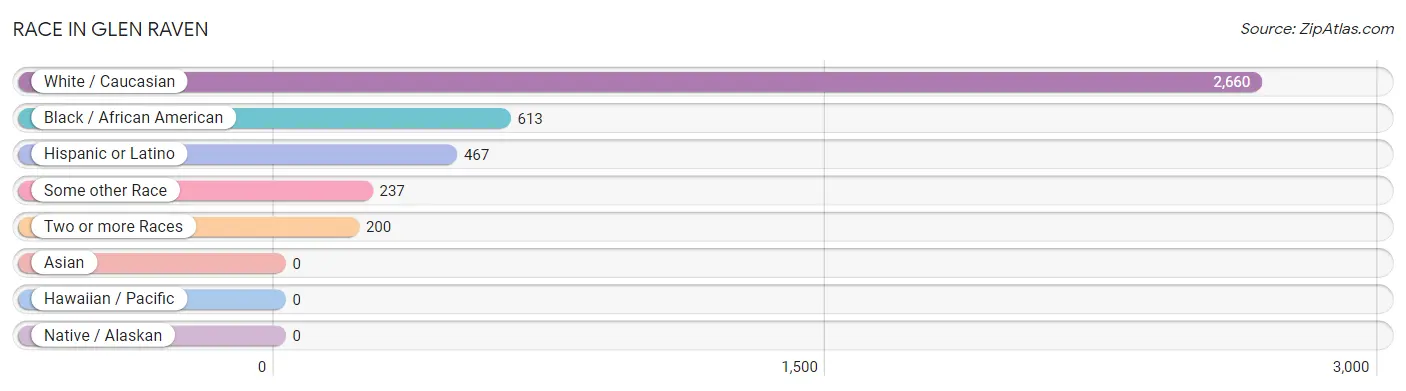
Race in Glen Raven
The most populous races in Glen Raven are White / Caucasian (2,660 | 71.7%), Black / African American (613 | 16.5%), and Hispanic or Latino (467 | 12.6%).
| Race | # Population | % Population |
| Asian | 0 | 0.0% |
| Black / African American | 613 | 16.5% |
| Hawaiian / Pacific | 0 | 0.0% |
| Hispanic or Latino | 467 | 12.6% |
| Native / Alaskan | 0 | 0.0% |
| White / Caucasian | 2,660 | 71.7% |
| Two or more Races | 200 | 5.4% |
| Some other Race | 237 | 6.4% |
| Total | 3,710 | 100.0% |
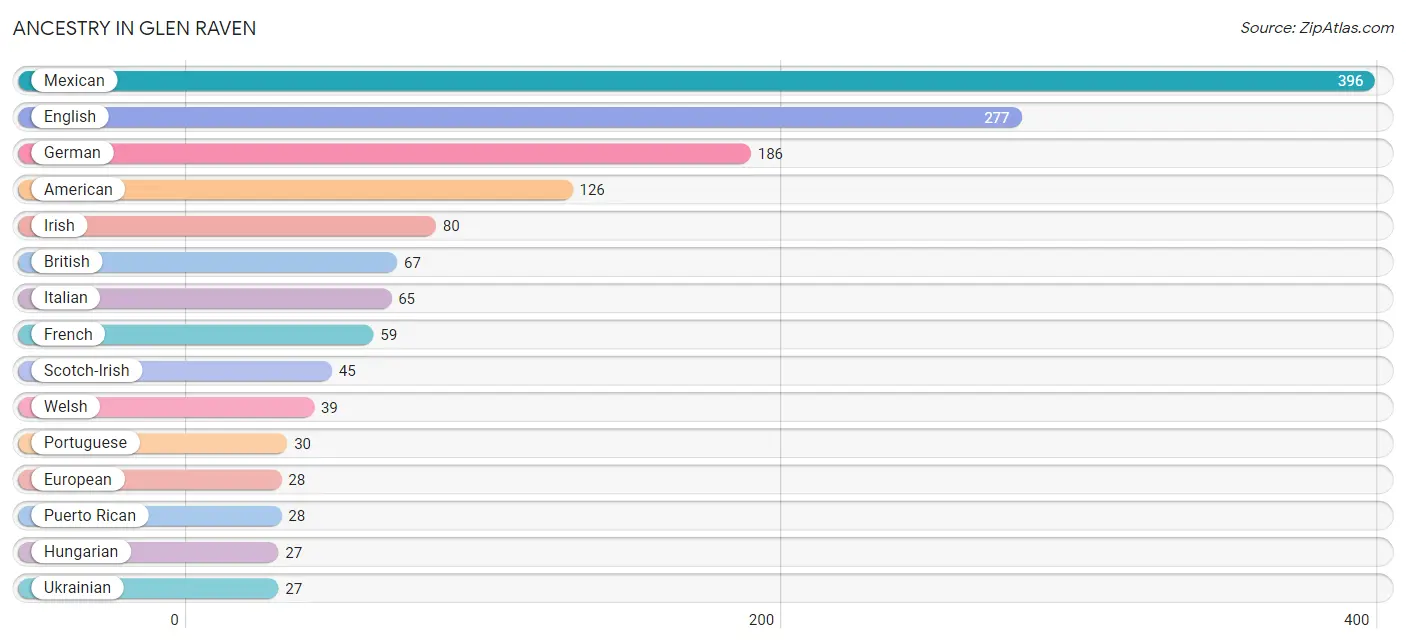
Ancestry in Glen Raven
The most populous ancestries reported in Glen Raven are Mexican (396 | 10.7%), English (277 | 7.5%), German (186 | 5.0%), American (126 | 3.4%), and Irish (80 | 2.2%), together accounting for 28.7% of all Glen Raven residents.
| Ancestry | # Population | % Population |
| American | 126 | 3.4% |
| Arab | 8 | 0.2% |
| British | 67 | 1.8% |
| Central American | 3 | 0.1% |
| Cuban | 10 | 0.3% |
| Dutch | 4 | 0.1% |
| English | 277 | 7.5% |
| European | 28 | 0.7% |
| French | 59 | 1.6% |
| French Canadian | 10 | 0.3% |
| German | 186 | 5.0% |
| Hungarian | 27 | 0.7% |
| Irish | 80 | 2.2% |
| Italian | 65 | 1.8% |
| Lithuanian | 15 | 0.4% |
| Mexican | 396 | 10.7% |
| Polish | 24 | 0.6% |
| Portuguese | 30 | 0.8% |
| Puerto Rican | 28 | 0.7% |
| Romanian | 10 | 0.3% |
| Salvadoran | 3 | 0.1% |
| Scandinavian | 24 | 0.6% |
| Scotch-Irish | 45 | 1.2% |
| Scottish | 8 | 0.2% |
| Ukrainian | 27 | 0.7% |
| Welsh | 39 | 1.1% | View All 26 Rows |
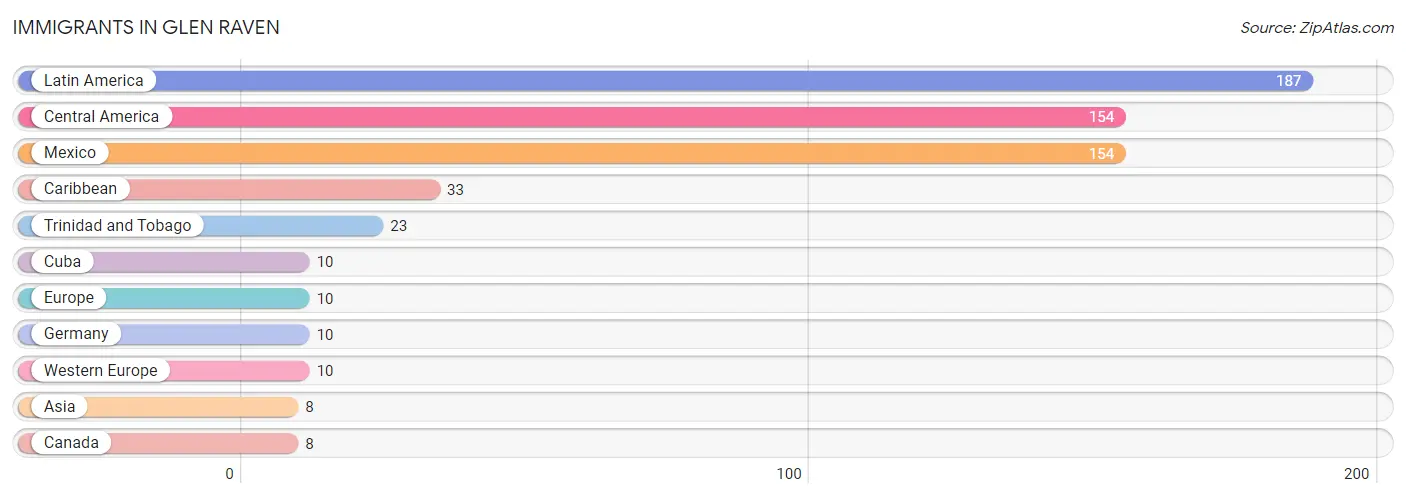
Immigrants in Glen Raven
The most numerous immigrant groups reported in Glen Raven came from Latin America (187 | 5.0%), Central America (154 | 4.2%), Mexico (154 | 4.2%), Caribbean (33 | 0.9%), and Trinidad and Tobago (23 | 0.6%), together accounting for 14.9% of all Glen Raven residents.
| Immigration Origin | # Population | % Population |
| Asia | 8 | 0.2% |
| Canada | 8 | 0.2% |
| Caribbean | 33 | 0.9% |
| Central America | 154 | 4.2% |
| Cuba | 10 | 0.3% |
| Europe | 10 | 0.3% |
| Germany | 10 | 0.3% |
| Latin America | 187 | 5.0% |
| Mexico | 154 | 4.2% |
| Trinidad and Tobago | 23 | 0.6% |
| Western Europe | 10 | 0.3% | View All 11 Rows |
Sex and Age in Glen Raven
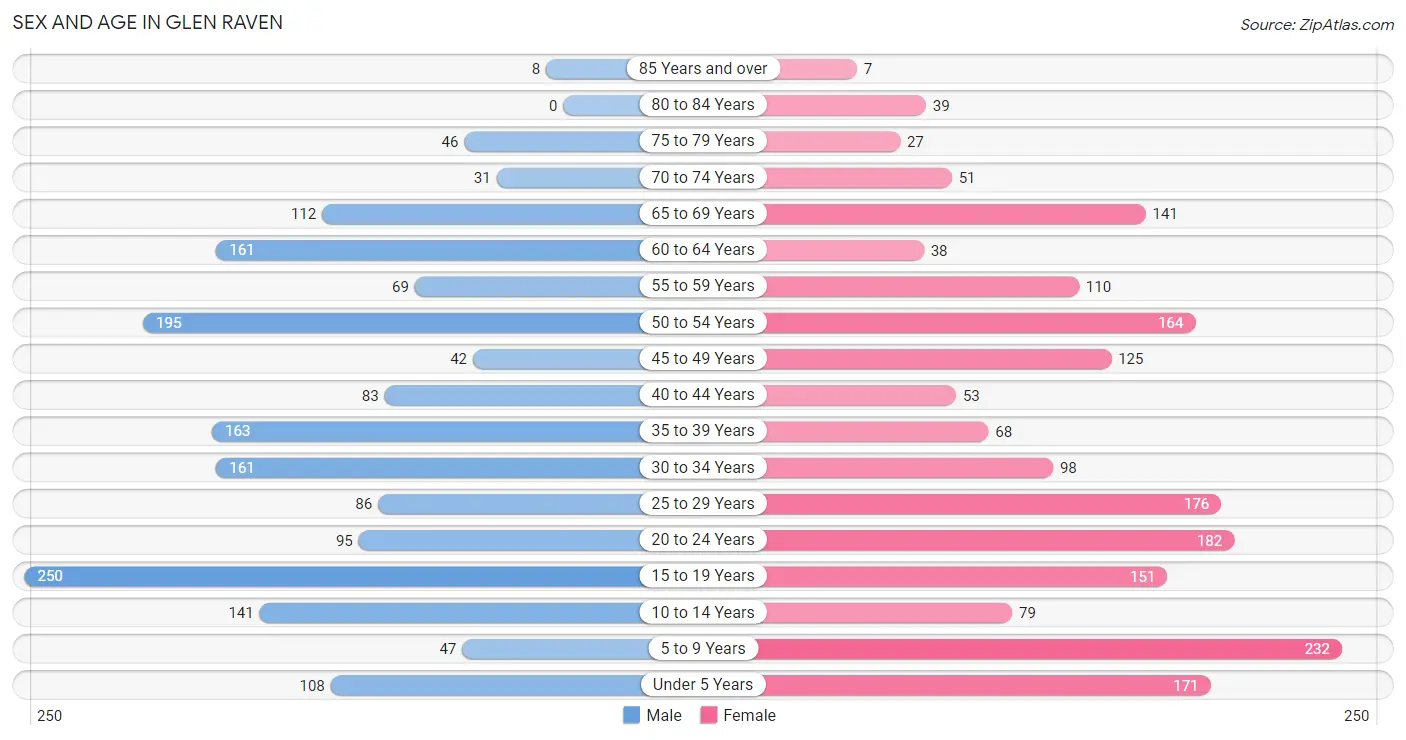
Sex and Age in Glen Raven
The most populous age groups in Glen Raven are 15 to 19 Years (250 | 13.9%) for men and 5 to 9 Years (232 | 12.1%) for women.
| Age Bracket | Male | Female |
| Under 5 Years | 108 (6.0%) | 171 (8.9%) |
| 5 to 9 Years | 47 (2.6%) | 232 (12.1%) |
| 10 to 14 Years | 141 (7.8%) | 79 (4.1%) |
| 15 to 19 Years | 250 (13.9%) | 151 (7.9%) |
| 20 to 24 Years | 95 (5.3%) | 182 (9.5%) |
| 25 to 29 Years | 86 (4.8%) | 176 (9.2%) |
| 30 to 34 Years | 161 (8.9%) | 98 (5.1%) |
| 35 to 39 Years | 163 (9.1%) | 68 (3.6%) |
| 40 to 44 Years | 83 (4.6%) | 53 (2.8%) |
| 45 to 49 Years | 42 (2.3%) | 125 (6.5%) |
| 50 to 54 Years | 195 (10.8%) | 164 (8.6%) |
| 55 to 59 Years | 69 (3.8%) | 110 (5.8%) |
| 60 to 64 Years | 161 (8.9%) | 38 (2.0%) |
| 65 to 69 Years | 112 (6.2%) | 141 (7.4%) |
| 70 to 74 Years | 31 (1.7%) | 51 (2.7%) |
| 75 to 79 Years | 46 (2.6%) | 27 (1.4%) |
| 80 to 84 Years | 0 (0.0%) | 39 (2.0%) |
| 85 Years and over | 8 (0.4%) | 7 (0.4%) |
| Total | 1,798 (100.0%) | 1,912 (100.0%) |
Families and Households in Glen Raven
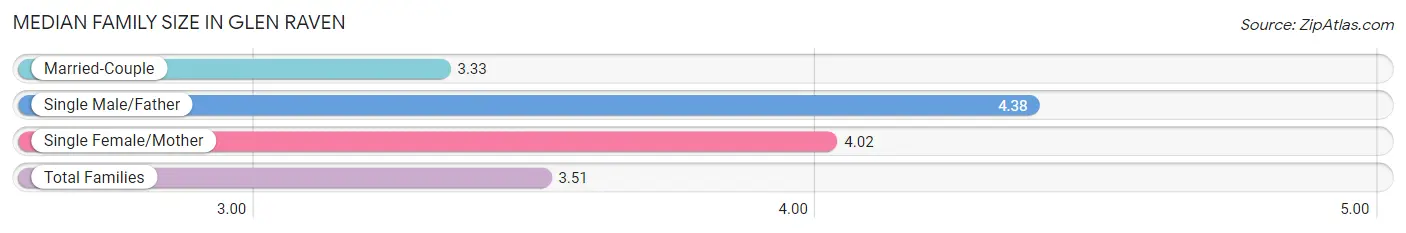
Median Family Size in Glen Raven
The median family size in Glen Raven is 3.51 persons per family, with single male/father families (16 | 1.8%) accounting for the largest median family size of 4.38 persons per family. On the other hand, married-couple families (672 | 74.3%) represent the smallest median family size with 3.33 persons per family.
| Family Type | # Families | Family Size |
| Married-Couple | 672 (74.3%) | 3.33 |
| Single Male/Father | 16 (1.8%) | 4.38 |
| Single Female/Mother | 217 (24.0%) | 4.02 |
| Total Families | 905 (100.0%) | 3.51 |
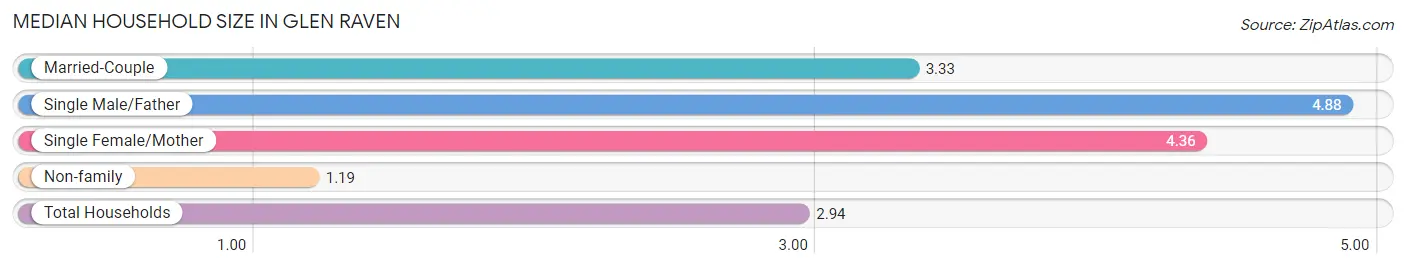
Median Household Size in Glen Raven
The median household size in Glen Raven is 2.94 persons per household, with single male/father households (16 | 1.3%) accounting for the largest median household size of 4.88 persons per household. non-family households (344 | 27.5%) represent the smallest median household size with 1.19 persons per household.
| Household Type | # Households | Household Size |
| Married-Couple | 672 (53.8%) | 3.33 |
| Single Male/Father | 16 (1.3%) | 4.88 |
| Single Female/Mother | 217 (17.4%) | 4.36 |
| Non-family | 344 (27.5%) | 1.19 |
| Total Households | 1,249 (100.0%) | 2.94 |
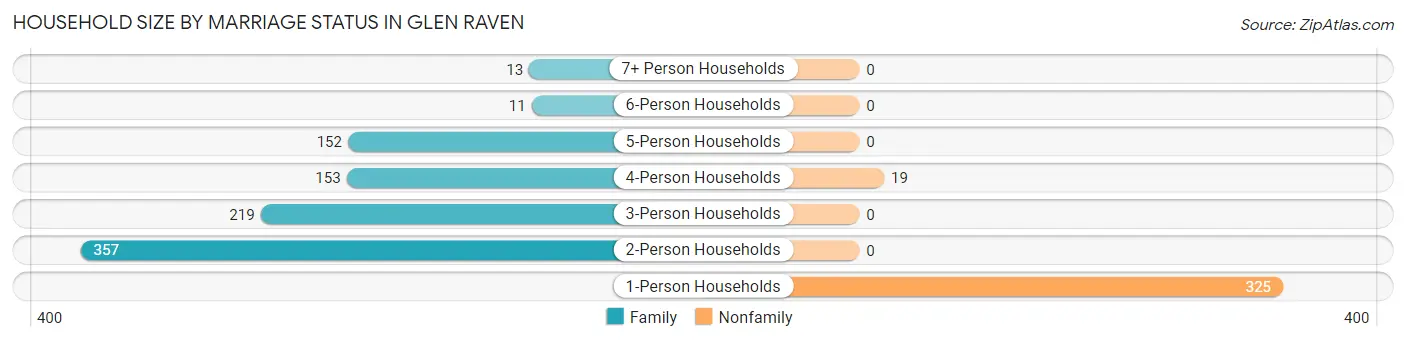
Household Size by Marriage Status in Glen Raven
Out of a total of 1,249 households in Glen Raven, 905 (72.5%) are family households, while 344 (27.5%) are nonfamily households. The most numerous type of family households are 2-person households, comprising 357, and the most common type of nonfamily households are 1-person households, comprising 325.
| Household Size | Family Households | Nonfamily Households |
| 1-Person Households | - | 325 (26.0%) |
| 2-Person Households | 357 (28.6%) | 0 (0.0%) |
| 3-Person Households | 219 (17.5%) | 0 (0.0%) |
| 4-Person Households | 153 (12.2%) | 19 (1.5%) |
| 5-Person Households | 152 (12.2%) | 0 (0.0%) |
| 6-Person Households | 11 (0.9%) | 0 (0.0%) |
| 7+ Person Households | 13 (1.0%) | 0 (0.0%) |
| Total | 905 (72.5%) | 344 (27.5%) |
Female Fertility in Glen Raven
Fertility by Age in Glen Raven
Average fertility rate in Glen Raven is 84.0 births per 1,000 women. Women in the age bracket of 20 to 34 years have the highest fertility rate with 164.0 births per 1,000 women. Women in the age bracket of 20 to 34 years acount for 100.0% of all women with births.
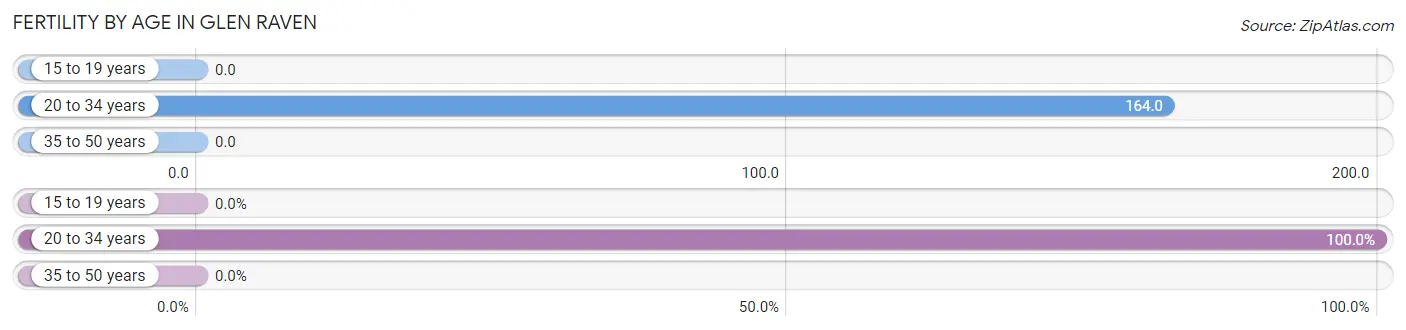
| Age Bracket | Women with Births | Births / 1,000 Women |
| 15 to 19 years | 0 (0.0%) | 0.0 |
| 20 to 34 years | 75 (100.0%) | 164.0 |
| 35 to 50 years | 0 (0.0%) | 0.0 |
| Total | 75 (100.0%) | 84.0 |
Fertility by Age by Marriage Status in Glen Raven
89.3% of women with births (75) in Glen Raven are married. The highest percentage of unmarried women with births falls into 20 to 34 years age bracket with 10.7% of them unmarried at the time of birth, while the lowest percentage of unmarried women with births belong to 20 to 34 years age bracket with 10.7% of them unmarried.
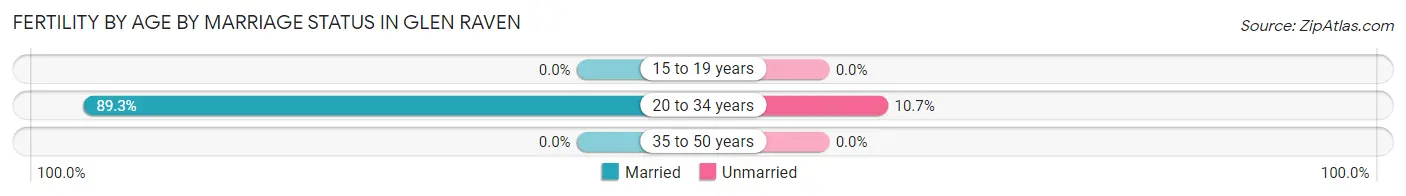
| Age Bracket | Married | Unmarried |
| 15 to 19 years | 0 (0.0%) | 0 (0.0%) |
| 20 to 34 years | 67 (89.3%) | 8 (10.7%) |
| 35 to 50 years | 0 (0.0%) | 0 (0.0%) |
| Total | 67 (89.3%) | 8 (10.7%) |
Fertility by Education in Glen Raven
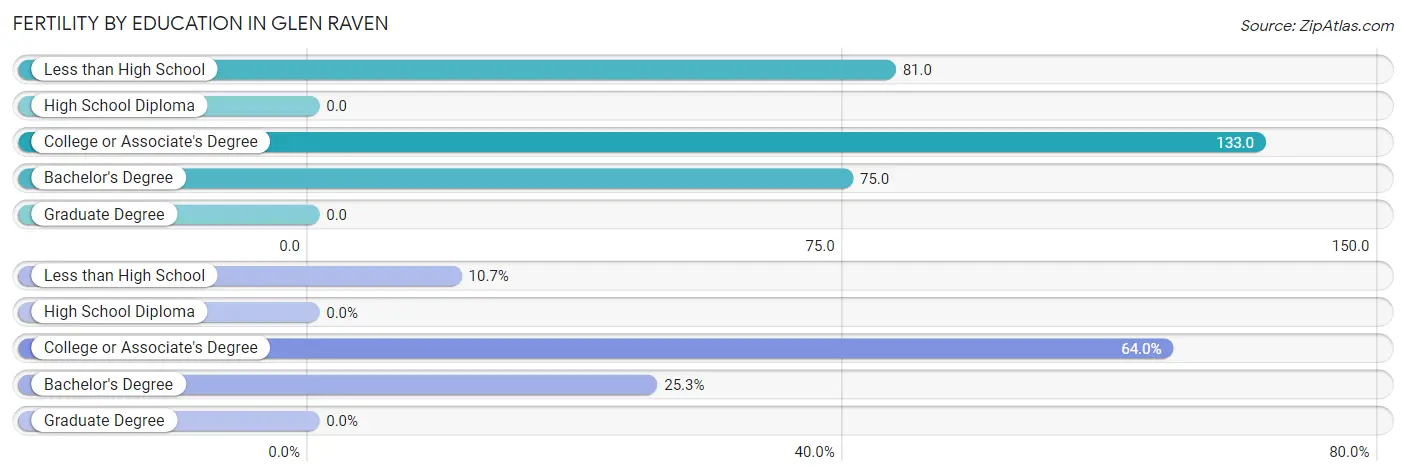
| Educational Attainment | Women with Births | Births / 1,000 Women |
| Less than High School | 8 (10.7%) | 81.0 |
| High School Diploma | 0 (0.0%) | 0.0 |
| College or Associate's Degree | 48 (64.0%) | 133.0 |
| Bachelor's Degree | 19 (25.3%) | 75.0 |
| Graduate Degree | 0 (0.0%) | 0.0 |
| Total | 75 (100.0%) | 84.0 |
Fertility by Education by Marriage Status in Glen Raven
10.7% of women with births in Glen Raven are unmarried. Women with the educational attainment of college or associate's degree are most likely to be married with 100.0% of them married at childbirth, while women with the educational attainment of less than high school are least likely to be married with 100.0% of them unmarried at childbirth.
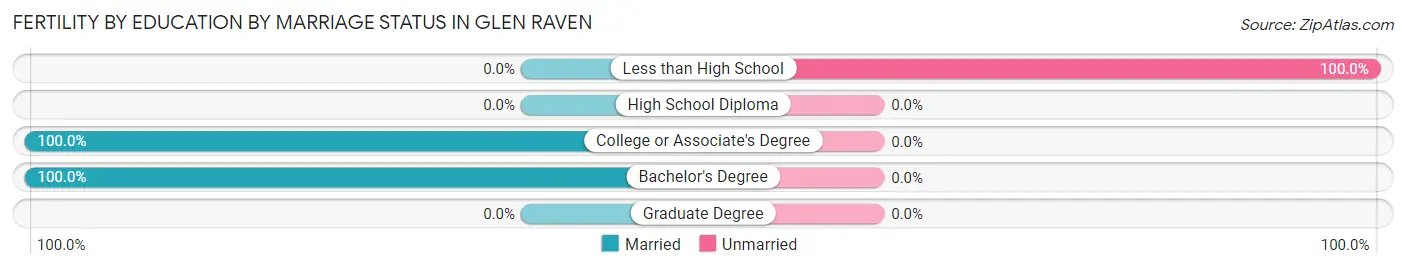
| Educational Attainment | Married | Unmarried |
| Less than High School | 0 (0.0%) | 8 (100.0%) |
| High School Diploma | 0 (0.0%) | 0 (0.0%) |
| College or Associate's Degree | 48 (100.0%) | 0 (0.0%) |
| Bachelor's Degree | 19 (100.0%) | 0 (0.0%) |
| Graduate Degree | 0 (0.0%) | 0 (0.0%) |
| Total | 67 (89.3%) | 8 (10.7%) |
Income in Glen Raven
Income Overview in Glen Raven
Per Capita Income in Glen Raven is $24,514, while median incomes of families and households are $61,867 and $57,639 respectively.
| Characteristic | Number | Measure |
| Per Capita Income | 3,710 | $24,514 |
| Median Family Income | 905 | $61,867 |
| Mean Family Income | 905 | $78,096 |
| Median Household Income | 1,249 | $57,639 |
| Mean Household Income | 1,249 | $68,232 |
| Income Deficit | 905 | $2,316 |
| Wage / Income Gap (%) | 3,710 | 44.21% |
| Wage / Income Gap ($) | 3,710 | 55.79¢ per $1 |
| Gini / Inequality Index | 3,710 | 0.36 |
Earnings by Sex in Glen Raven
Average Earnings in Glen Raven are $33,472, $41,968 for men and $23,413 for women, a difference of 44.2%.
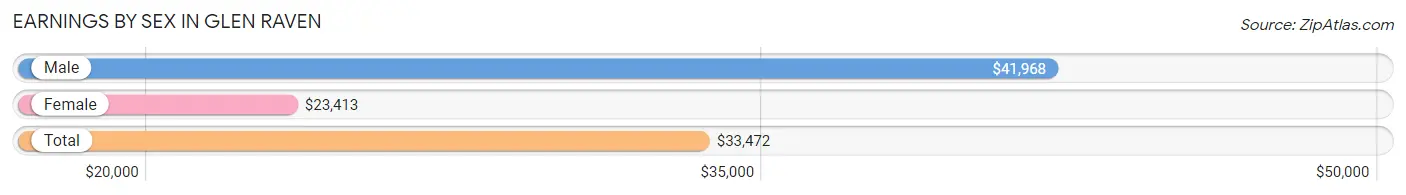
| Sex | Number | Average Earnings |
| Male | 966 (49.7%) | $41,968 |
| Female | 977 (50.3%) | $23,413 |
| Total | 1,943 (100.0%) | $33,472 |
Earnings by Sex by Income Bracket in Glen Raven
The most common earnings brackets in Glen Raven are $55,000 to $64,999 for men (152 | 15.7%) and $10,000 to $12,499 for women (124 | 12.7%).
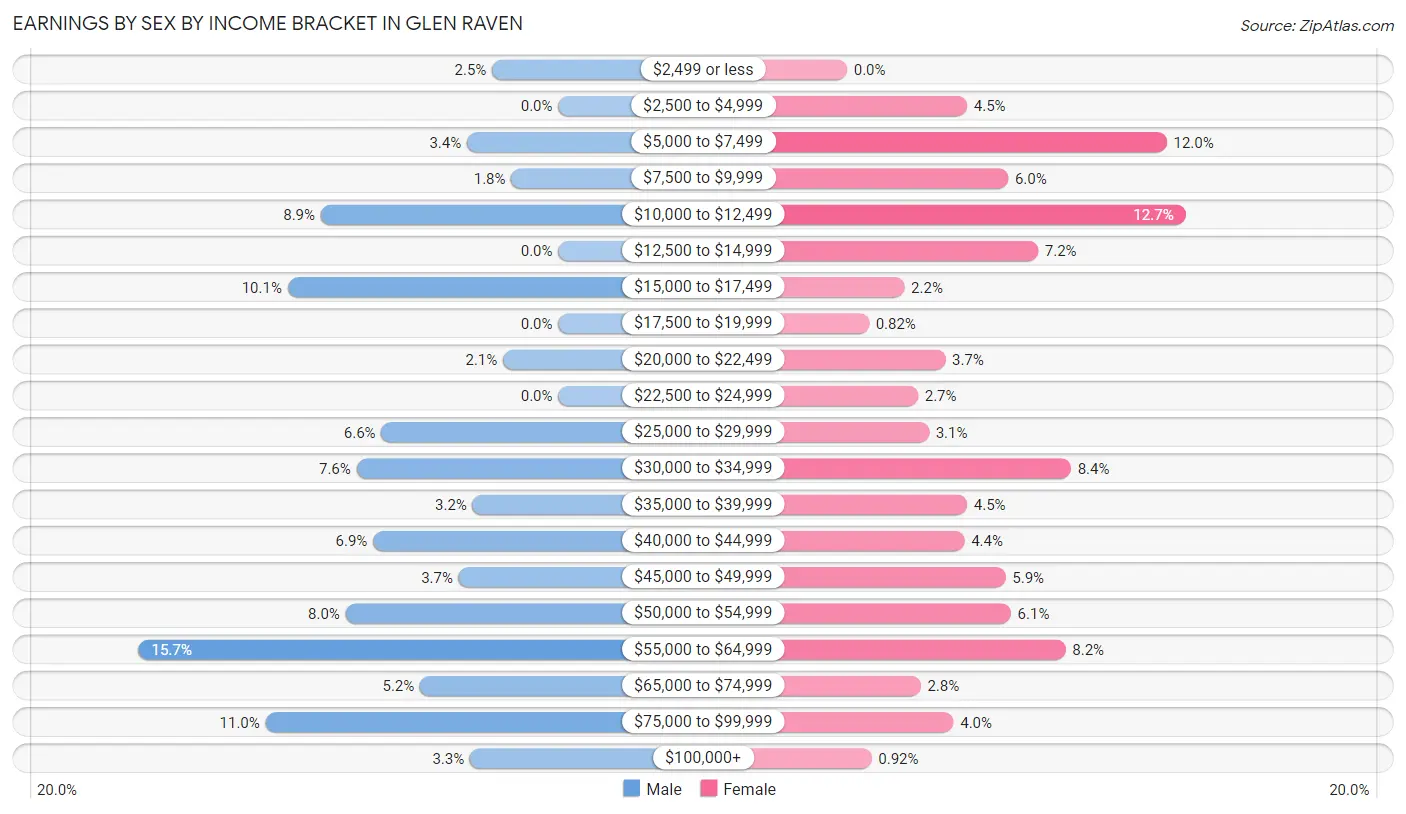
| Income | Male | Female |
| $2,499 or less | 24 (2.5%) | 0 (0.0%) |
| $2,500 to $4,999 | 0 (0.0%) | 44 (4.5%) |
| $5,000 to $7,499 | 33 (3.4%) | 117 (12.0%) |
| $7,500 to $9,999 | 17 (1.8%) | 59 (6.0%) |
| $10,000 to $12,499 | 86 (8.9%) | 124 (12.7%) |
| $12,500 to $14,999 | 0 (0.0%) | 70 (7.2%) |
| $15,000 to $17,499 | 98 (10.1%) | 21 (2.1%) |
| $17,500 to $19,999 | 0 (0.0%) | 8 (0.8%) |
| $20,000 to $22,499 | 20 (2.1%) | 36 (3.7%) |
| $22,500 to $24,999 | 0 (0.0%) | 26 (2.7%) |
| $25,000 to $29,999 | 64 (6.6%) | 30 (3.1%) |
| $30,000 to $34,999 | 73 (7.6%) | 82 (8.4%) |
| $35,000 to $39,999 | 31 (3.2%) | 44 (4.5%) |
| $40,000 to $44,999 | 67 (6.9%) | 43 (4.4%) |
| $45,000 to $49,999 | 36 (3.7%) | 58 (5.9%) |
| $50,000 to $54,999 | 77 (8.0%) | 60 (6.1%) |
| $55,000 to $64,999 | 152 (15.7%) | 80 (8.2%) |
| $65,000 to $74,999 | 50 (5.2%) | 27 (2.8%) |
| $75,000 to $99,999 | 106 (11.0%) | 39 (4.0%) |
| $100,000+ | 32 (3.3%) | 9 (0.9%) |
| Total | 966 (100.0%) | 977 (100.0%) |
Earnings by Sex by Educational Attainment in Glen Raven
Average earnings in Glen Raven are $45,000 for men and $32,528 for women, a difference of 27.7%. Men with an educational attainment of college or associate's degree enjoy the highest average annual earnings of $53,417, while those with less than high school education earn the least with $32,500. Women with an educational attainment of bachelor's degree earn the most with the average annual earnings of $37,188, while those with high school diploma education have the smallest earnings of $20,326.
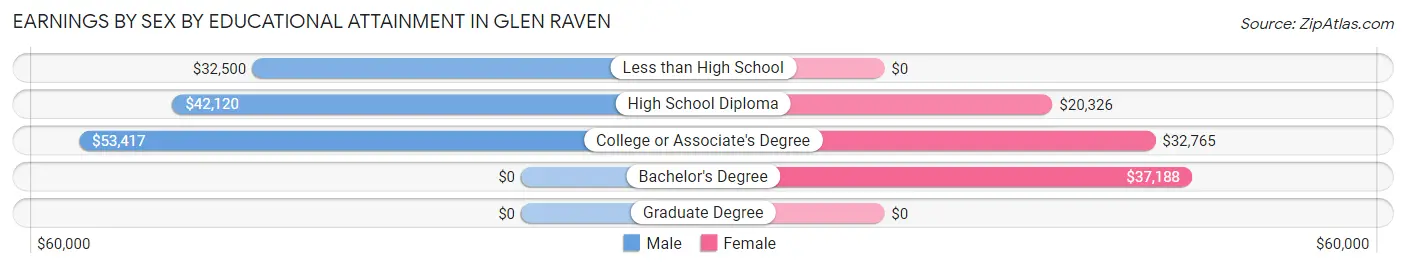
| Educational Attainment | Male Income | Female Income |
| Less than High School | $32,500 | $0 |
| High School Diploma | $42,120 | $20,326 |
| College or Associate's Degree | $53,417 | $32,765 |
| Bachelor's Degree | - | - |
| Graduate Degree | - | - |
| Total | $45,000 | $32,528 |
Family Income in Glen Raven
Family Income Brackets in Glen Raven
According to the Glen Raven family income data, there are 260 families falling into the $50,000 to $74,999 income range, which is the most common income bracket and makes up 28.7% of all families.
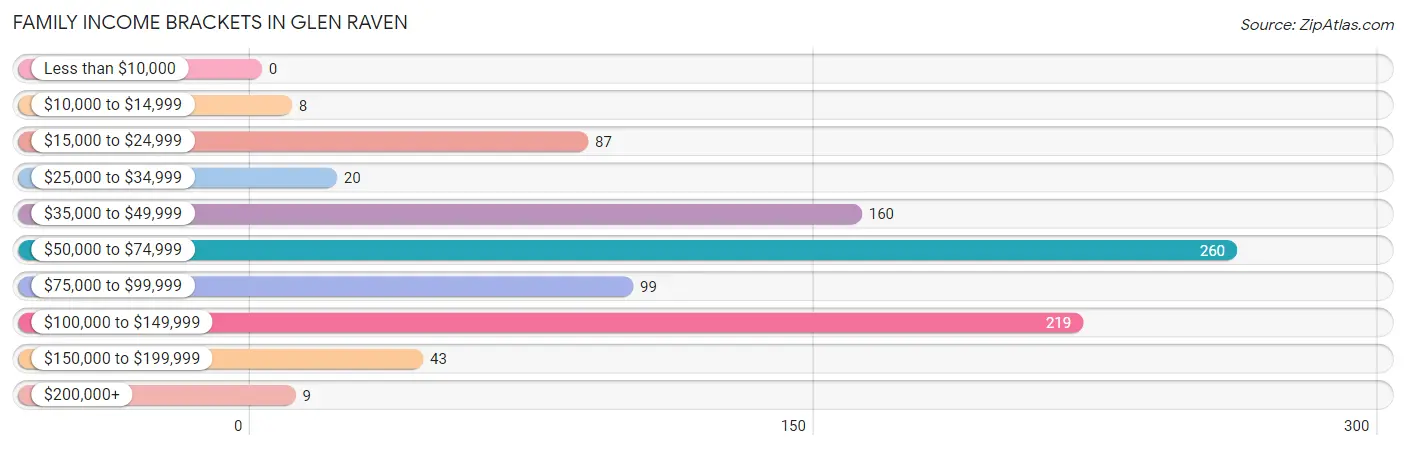
| Income Bracket | # Families | % Families |
| Less than $10,000 | 0 | 0.0% |
| $10,000 to $14,999 | 8 | 0.9% |
| $15,000 to $24,999 | 87 | 9.6% |
| $25,000 to $34,999 | 20 | 2.2% |
| $35,000 to $49,999 | 160 | 17.7% |
| $50,000 to $74,999 | 260 | 28.7% |
| $75,000 to $99,999 | 99 | 10.9% |
| $100,000 to $149,999 | 219 | 24.2% |
| $150,000 to $199,999 | 43 | 4.8% |
| $200,000+ | 9 | 1.0% |
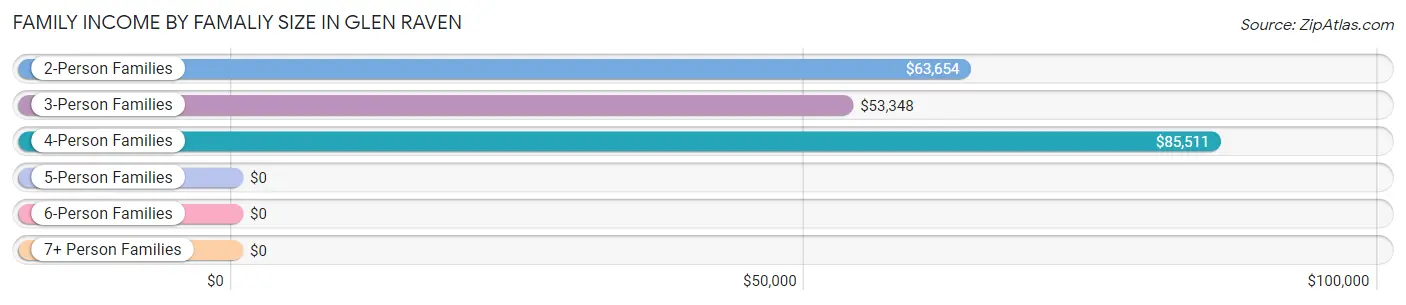
Family Income by Famaliy Size in Glen Raven
4-person families (138 | 15.2%) account for the highest median family income in Glen Raven with $85,511 per family, while 2-person families (382 | 42.2%) have the highest median income of $31,827 per family member.
| Income Bracket | # Families | Median Income |
| 2-Person Families | 382 (42.2%) | $63,654 |
| 3-Person Families | 225 (24.9%) | $53,348 |
| 4-Person Families | 138 (15.2%) | $85,511 |
| 5-Person Families | 138 (15.2%) | $0 |
| 6-Person Families | 9 (1.0%) | $0 |
| 7+ Person Families | 13 (1.4%) | $0 |
| Total | 905 (100.0%) | $61,867 |
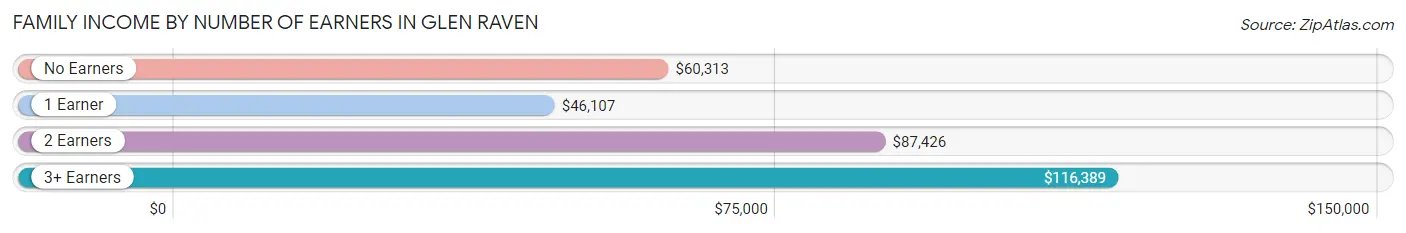
Family Income by Number of Earners in Glen Raven
The median family income in Glen Raven is $61,867, with families comprising 3+ earners (90) having the highest median family income of $116,389, while families with 1 earner (233) have the lowest median family income of $46,107, accounting for 9.9% and 25.8% of families, respectively.
| Number of Earners | # Families | Median Income |
| No Earners | 97 (10.7%) | $60,313 |
| 1 Earner | 233 (25.8%) | $46,107 |
| 2 Earners | 485 (53.6%) | $87,426 |
| 3+ Earners | 90 (9.9%) | $116,389 |
| Total | 905 (100.0%) | $61,867 |
Household Income in Glen Raven
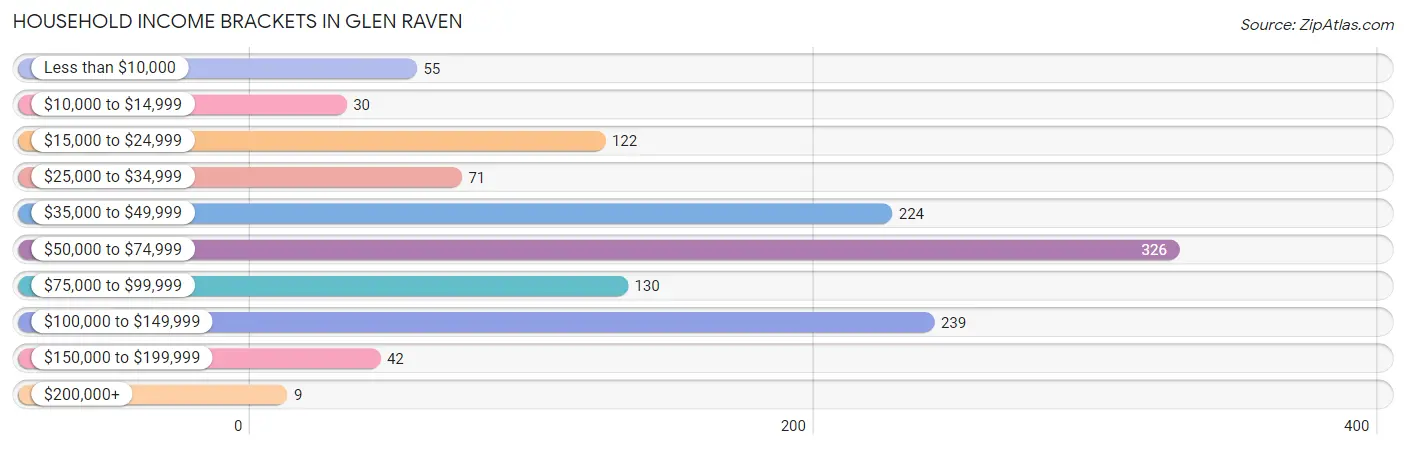
Household Income Brackets in Glen Raven
With 326 households falling in the category, the $50,000 to $74,999 income range is the most frequent in Glen Raven, accounting for 26.1% of all households. In contrast, only 9 households (0.7%) fall into the $200,000+ income bracket, making it the least populous group.
| Income Bracket | # Households | % Households |
| Less than $10,000 | 55 | 4.4% |
| $10,000 to $14,999 | 30 | 2.4% |
| $15,000 to $24,999 | 122 | 9.8% |
| $25,000 to $34,999 | 71 | 5.7% |
| $35,000 to $49,999 | 224 | 17.9% |
| $50,000 to $74,999 | 326 | 26.1% |
| $75,000 to $99,999 | 130 | 10.4% |
| $100,000 to $149,999 | 239 | 19.1% |
| $150,000 to $199,999 | 42 | 3.4% |
| $200,000+ | 9 | 0.7% |
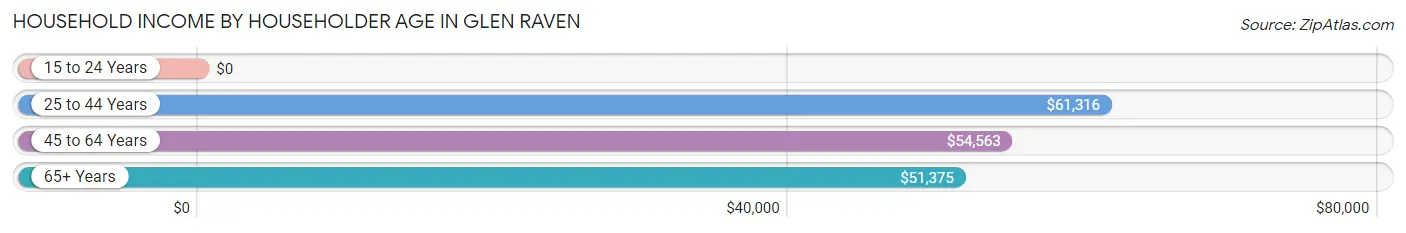
Household Income by Householder Age in Glen Raven
The median household income in Glen Raven is $57,639, with the highest median household income of $61,316 found in the 25 to 44 years age bracket for the primary householder. A total of 456 households (36.5%) fall into this category. Meanwhile, the 15 to 24 years age bracket for the primary householder has the lowest median household income of $0, with 7 households (0.6%) in this group.
| Income Bracket | # Households | Median Income |
| 15 to 24 Years | 7 (0.6%) | $0 |
| 25 to 44 Years | 456 (36.5%) | $61,316 |
| 45 to 64 Years | 508 (40.7%) | $54,563 |
| 65+ Years | 278 (22.3%) | $51,375 |
| Total | 1,249 (100.0%) | $57,639 |
Poverty in Glen Raven
Income Below Poverty by Sex and Age in Glen Raven
With 14.7% poverty level for males and 9.7% for females among the residents of Glen Raven, 16 and 17 year old males and 16 and 17 year old females are the most vulnerable to poverty, with 113 males (86.3%) and 9 females (34.6%) in their respective age groups living below the poverty level.
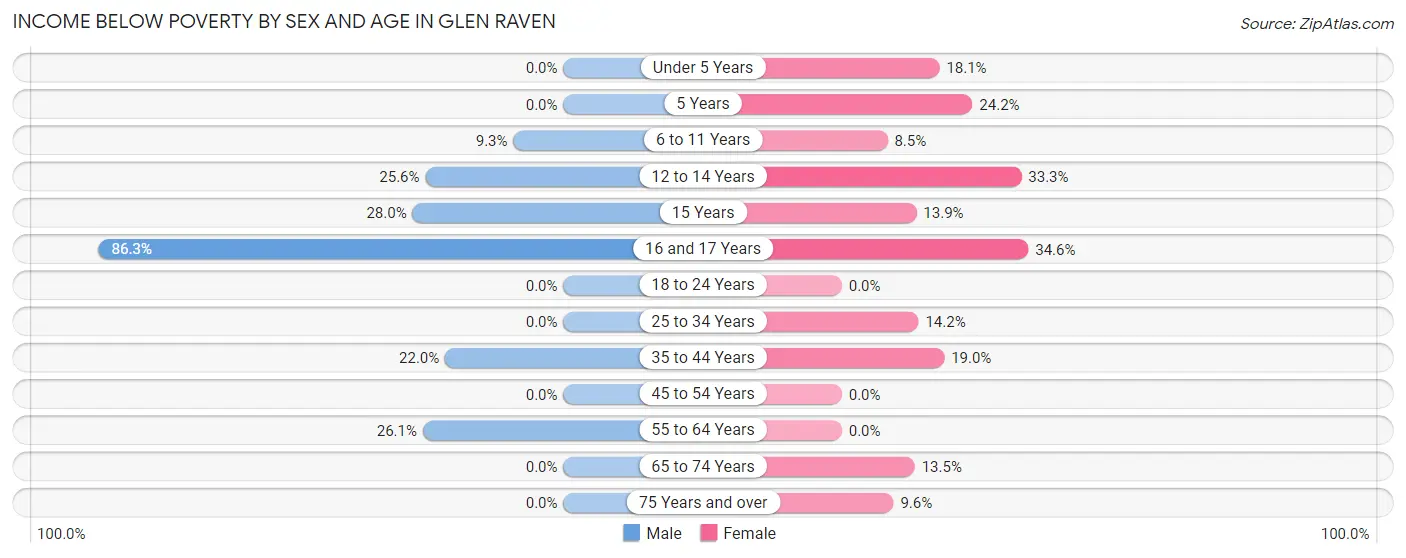
| Age Bracket | Male | Female |
| Under 5 Years | 0 (0.0%) | 31 (18.1%) |
| 5 Years | 0 (0.0%) | 8 (24.2%) |
| 6 to 11 Years | 9 (9.3%) | 20 (8.5%) |
| 12 to 14 Years | 21 (25.6%) | 14 (33.3%) |
| 15 Years | 7 (28.0%) | 9 (13.9%) |
| 16 and 17 Years | 113 (86.3%) | 9 (34.6%) |
| 18 to 24 Years | 0 (0.0%) | 0 (0.0%) |
| 25 to 34 Years | 0 (0.0%) | 39 (14.2%) |
| 35 to 44 Years | 54 (22.0%) | 23 (19.0%) |
| 45 to 54 Years | 0 (0.0%) | 0 (0.0%) |
| 55 to 64 Years | 60 (26.1%) | 0 (0.0%) |
| 65 to 74 Years | 0 (0.0%) | 26 (13.5%) |
| 75 Years and over | 0 (0.0%) | 7 (9.6%) |
| Total | 264 (14.7%) | 186 (9.7%) |
Income Above Poverty by Sex and Age in Glen Raven
According to the poverty statistics in Glen Raven, males aged under 5 years and females aged 18 to 24 years are the age groups that are most secure financially, with 100.0% of males and 100.0% of females in these age groups living above the poverty line.
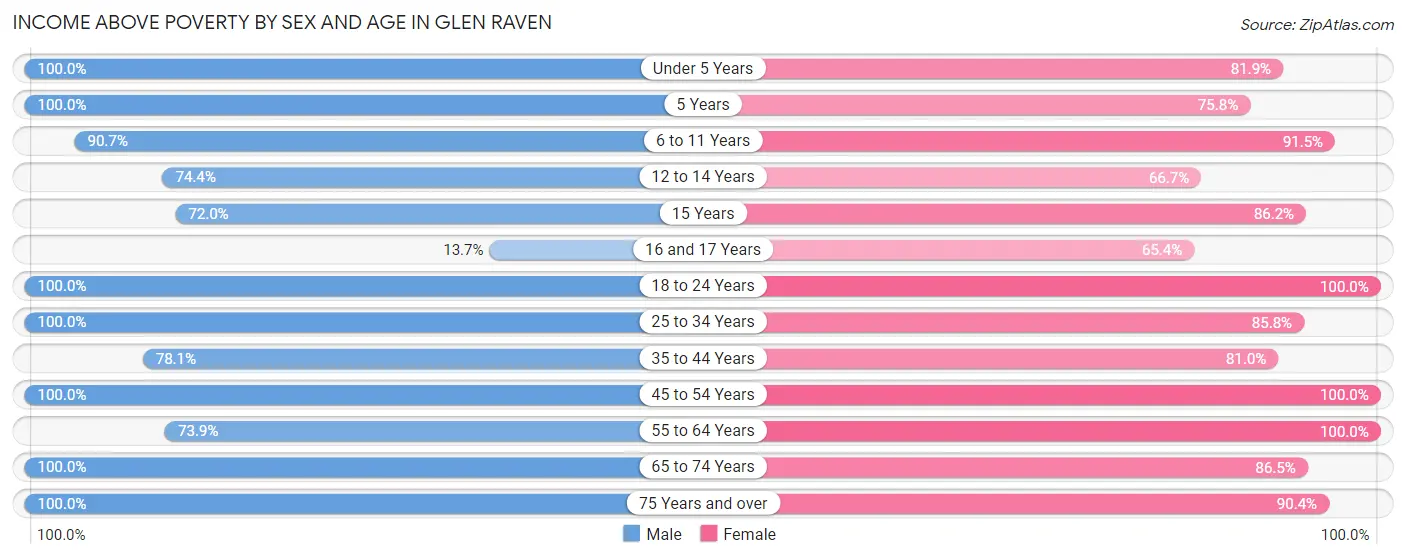
| Age Bracket | Male | Female |
| Under 5 Years | 108 (100.0%) | 140 (81.9%) |
| 5 Years | 9 (100.0%) | 25 (75.8%) |
| 6 to 11 Years | 88 (90.7%) | 216 (91.5%) |
| 12 to 14 Years | 61 (74.4%) | 28 (66.7%) |
| 15 Years | 18 (72.0%) | 56 (86.2%) |
| 16 and 17 Years | 18 (13.7%) | 17 (65.4%) |
| 18 to 24 Years | 189 (100.0%) | 242 (100.0%) |
| 25 to 34 Years | 247 (100.0%) | 235 (85.8%) |
| 35 to 44 Years | 192 (78.0%) | 98 (81.0%) |
| 45 to 54 Years | 237 (100.0%) | 289 (100.0%) |
| 55 to 64 Years | 170 (73.9%) | 148 (100.0%) |
| 65 to 74 Years | 143 (100.0%) | 166 (86.5%) |
| 75 Years and over | 54 (100.0%) | 66 (90.4%) |
| Total | 1,534 (85.3%) | 1,726 (90.3%) |
Income Below Poverty Among Married-Couple Families in Glen Raven
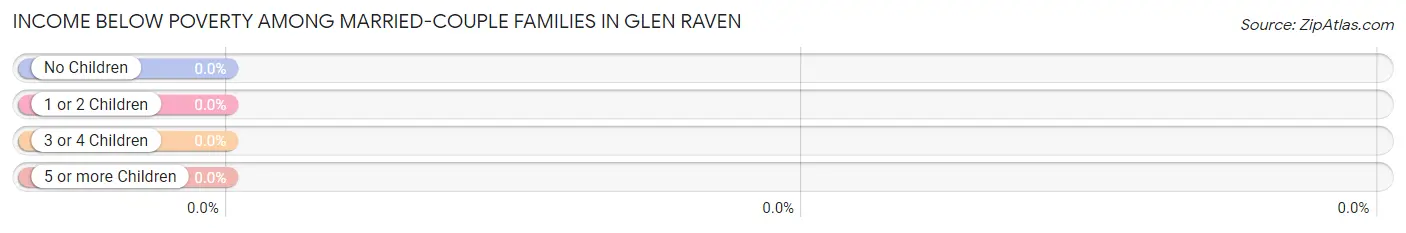
| Children | Above Poverty | Below Poverty |
| No Children | 399 (100.0%) | 0 (0.0%) |
| 1 or 2 Children | 165 (100.0%) | 0 (0.0%) |
| 3 or 4 Children | 108 (100.0%) | 0 (0.0%) |
| 5 or more Children | 0 (0.0%) | 0 (0.0%) |
| Total | 672 (100.0%) | 0 (0.0%) |
Income Below Poverty Among Single-Parent Households in Glen Raven
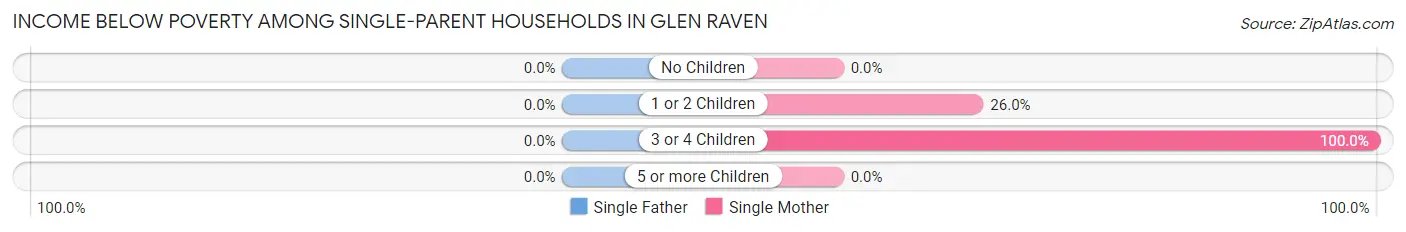
| Children | Single Father | Single Mother |
| No Children | 0 (0.0%) | 0 (0.0%) |
| 1 or 2 Children | 0 (0.0%) | 38 (26.0%) |
| 3 or 4 Children | 0 (0.0%) | 20 (100.0%) |
| 5 or more Children | 0 (0.0%) | 0 (0.0%) |
| Total | 0 (0.0%) | 58 (26.7%) |
Income Below Poverty Among Married-Couple vs Single-Parent Households in Glen Raven
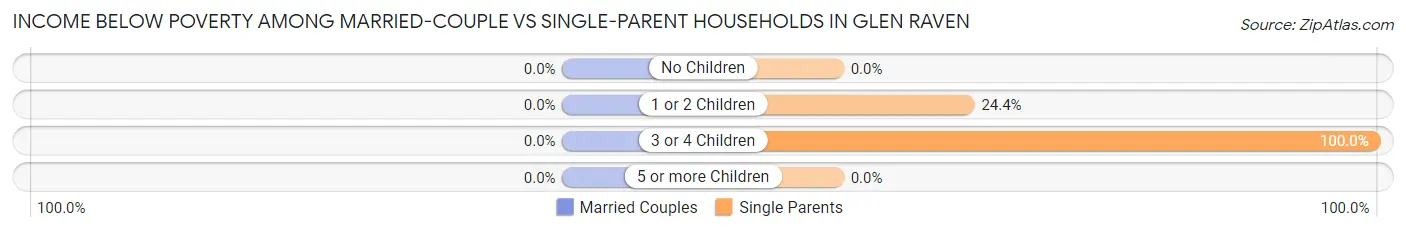
| Children | Married-Couple Families | Single-Parent Households |
| No Children | 0 (0.0%) | 0 (0.0%) |
| 1 or 2 Children | 0 (0.0%) | 38 (24.4%) |
| 3 or 4 Children | 0 (0.0%) | 20 (100.0%) |
| 5 or more Children | 0 (0.0%) | 0 (0.0%) |
| Total | 0 (0.0%) | 58 (24.9%) |
Employment Characteristics in Glen Raven
Employment by Class of Employer in Glen Raven
Among the 1,780 employed individuals in Glen Raven, private company employees (1,390 | 78.1%), self-employed (not incorporated) (119 | 6.7%), and not-for-profit organizations (86 | 4.8%) make up the most common classes of employment.
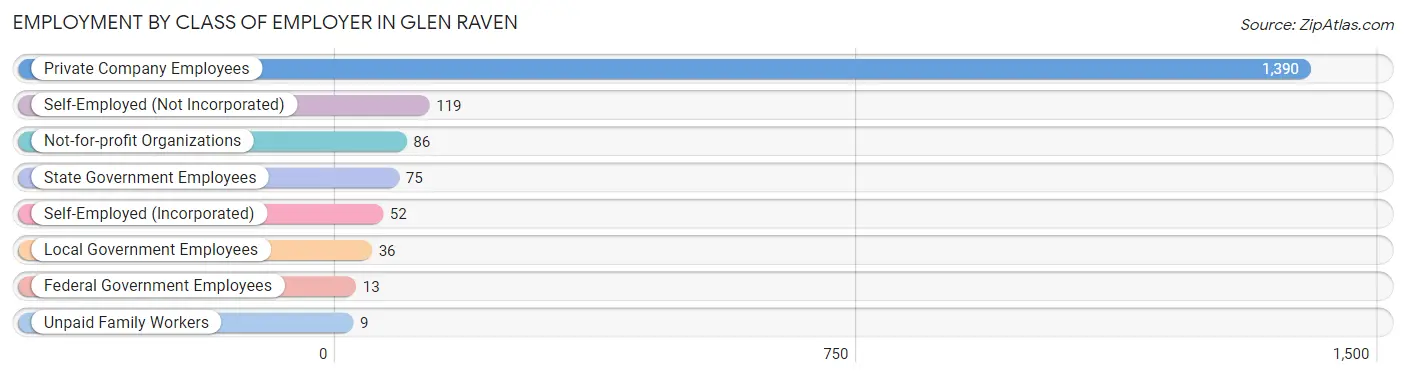
| Employer Class | # Employees | % Employees |
| Private Company Employees | 1,390 | 78.1% |
| Self-Employed (Incorporated) | 52 | 2.9% |
| Self-Employed (Not Incorporated) | 119 | 6.7% |
| Not-for-profit Organizations | 86 | 4.8% |
| Local Government Employees | 36 | 2.0% |
| State Government Employees | 75 | 4.2% |
| Federal Government Employees | 13 | 0.7% |
| Unpaid Family Workers | 9 | 0.5% |
| Total | 1,780 | 100.0% |
Employment Status by Age in Glen Raven
According to the labor force statistics for Glen Raven, out of the total population over 16 years of age (2,842), 65.0% or 1,847 individuals are in the labor force, with 3.7% or 68 of them unemployed. The age group with the highest labor force participation rate is 25 to 29 years, with 96.6% or 253 individuals in the labor force. Within the labor force, the 65 to 74 years age range has the highest percentage of unemployed individuals, with 28.2% or 20 of them being unemployed.
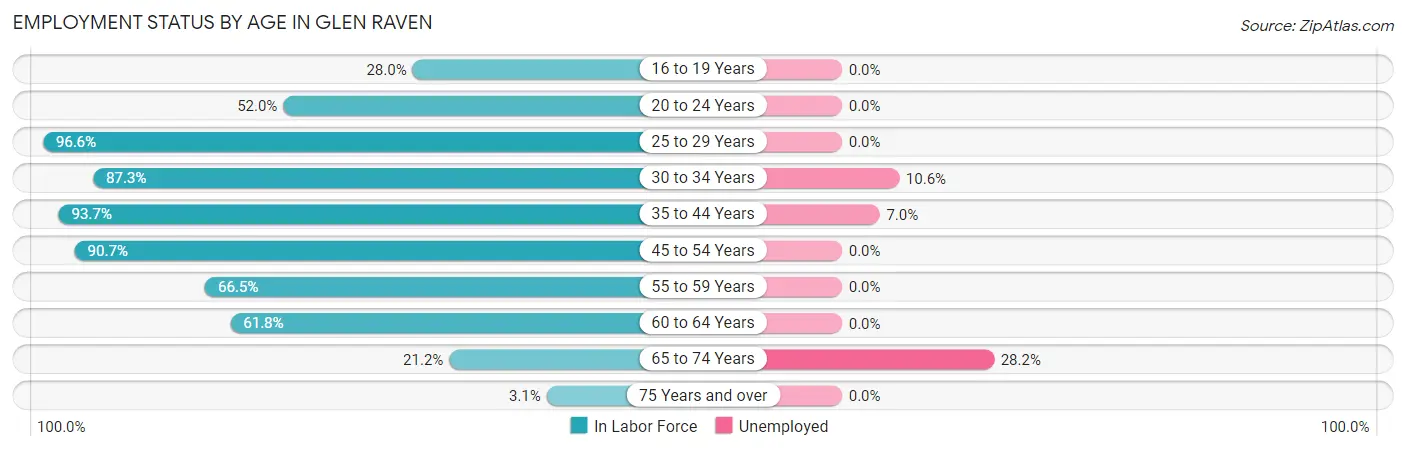
| Age Bracket | In Labor Force | Unemployed |
| 16 to 19 Years | 87 (28.0%) | 0 (0.0%) |
| 20 to 24 Years | 144 (52.0%) | 0 (0.0%) |
| 25 to 29 Years | 253 (96.6%) | 0 (0.0%) |
| 30 to 34 Years | 226 (87.3%) | 24 (10.6%) |
| 35 to 44 Years | 344 (93.7%) | 24 (7.0%) |
| 45 to 54 Years | 477 (90.7%) | 0 (0.0%) |
| 55 to 59 Years | 119 (66.5%) | 0 (0.0%) |
| 60 to 64 Years | 123 (61.8%) | 0 (0.0%) |
| 65 to 74 Years | 71 (21.2%) | 20 (28.2%) |
| 75 Years and over | 4 (3.1%) | 0 (0.0%) |
| Total | 1,847 (65.0%) | 68 (3.7%) |
Employment Status by Educational Attainment in Glen Raven
According to labor force statistics for Glen Raven, 86.0% of individuals (1,541) out of the total population between 25 and 64 years of age (1,792) are in the labor force, with 3.1% or 48 of them being unemployed. The group with the highest labor force participation rate are those with the educational attainment of college / associate degree, with 87.7% or 786 individuals in the labor force. Within the labor force, individuals with college / associate degree education have the highest percentage of unemployment, with 5.1% or 40 of them being unemployed.
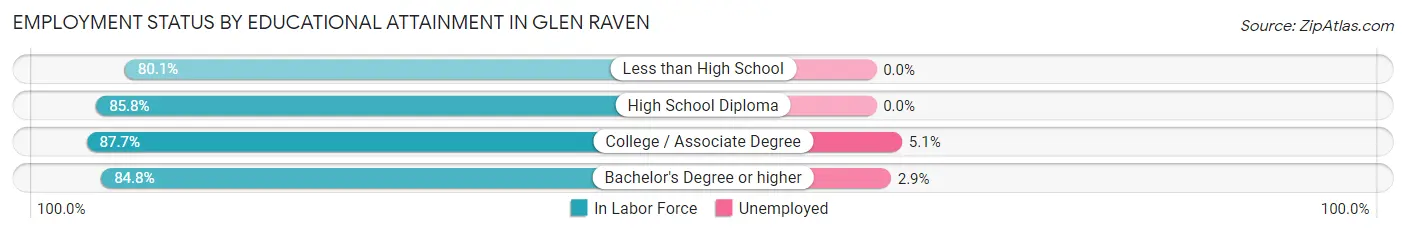
| Educational Attainment | In Labor Force | Unemployed |
| Less than High School | 133 (80.1%) | 0 (0.0%) |
| High School Diploma | 350 (85.8%) | 0 (0.0%) |
| College / Associate Degree | 786 (87.7%) | 46 (5.1%) |
| Bachelor's Degree or higher | 273 (84.8%) | 9 (2.9%) |
| Total | 1,541 (86.0%) | 56 (3.1%) |
Employment Occupations by Sex in Glen Raven
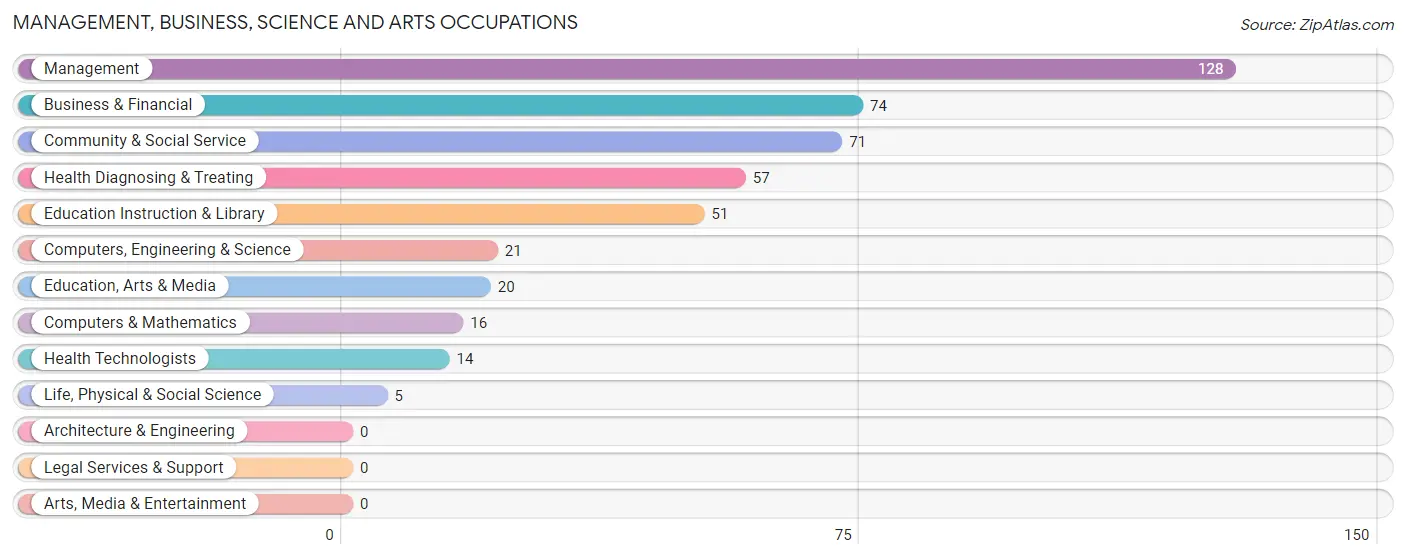
Management, Business, Science and Arts Occupations
The most common Management, Business, Science and Arts occupations in Glen Raven are Management (128 | 7.2%), Business & Financial (74 | 4.2%), Community & Social Service (71 | 4.0%), Health Diagnosing & Treating (57 | 3.2%), and Education Instruction & Library (51 | 2.9%).
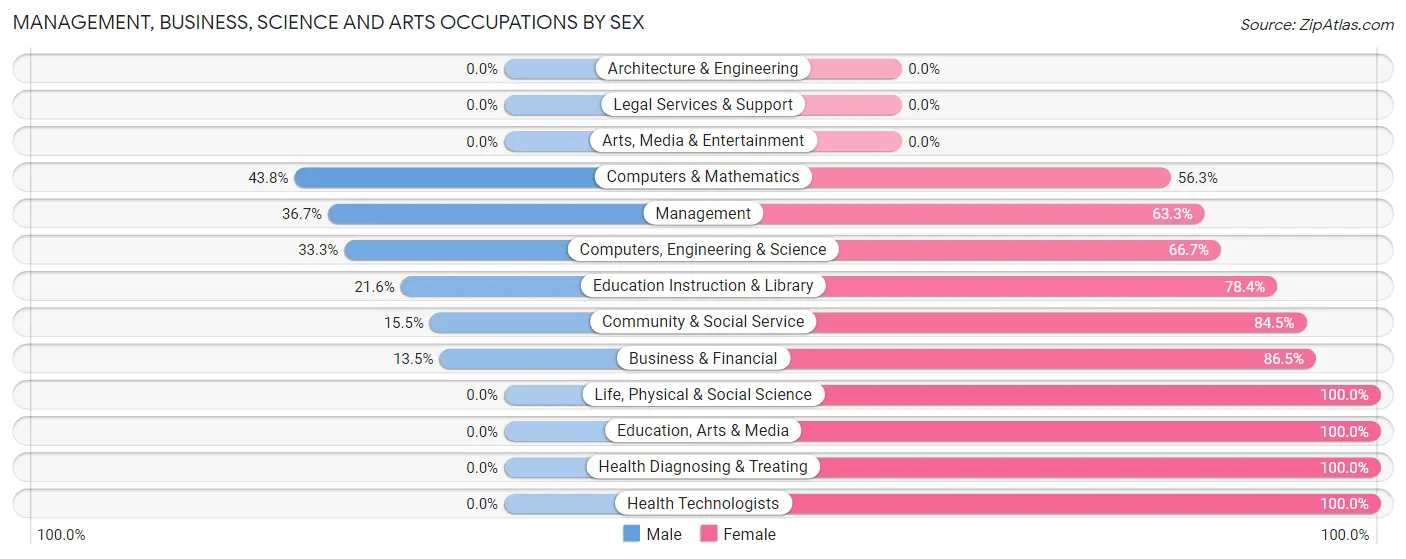
Management, Business, Science and Arts Occupations by Sex
Within the Management, Business, Science and Arts occupations in Glen Raven, the most male-oriented occupations are Computers & Mathematics (43.8%), Management (36.7%), and Computers, Engineering & Science (33.3%), while the most female-oriented occupations are Life, Physical & Social Science (100.0%), Education, Arts & Media (100.0%), and Health Diagnosing & Treating (100.0%).
| Occupation | Male | Female |
| Management | 47 (36.7%) | 81 (63.3%) |
| Business & Financial | 10 (13.5%) | 64 (86.5%) |
| Computers, Engineering & Science | 7 (33.3%) | 14 (66.7%) |
| Computers & Mathematics | 7 (43.8%) | 9 (56.2%) |
| Architecture & Engineering | 0 (0.0%) | 0 (0.0%) |
| Life, Physical & Social Science | 0 (0.0%) | 5 (100.0%) |
| Community & Social Service | 11 (15.5%) | 60 (84.5%) |
| Education, Arts & Media | 0 (0.0%) | 20 (100.0%) |
| Legal Services & Support | 0 (0.0%) | 0 (0.0%) |
| Education Instruction & Library | 11 (21.6%) | 40 (78.4%) |
| Arts, Media & Entertainment | 0 (0.0%) | 0 (0.0%) |
| Health Diagnosing & Treating | 0 (0.0%) | 57 (100.0%) |
| Health Technologists | 0 (0.0%) | 14 (100.0%) |
| Total (Category) | 75 (21.4%) | 276 (78.6%) |
| Total (Overall) | 920 (51.7%) | 860 (48.3%) |
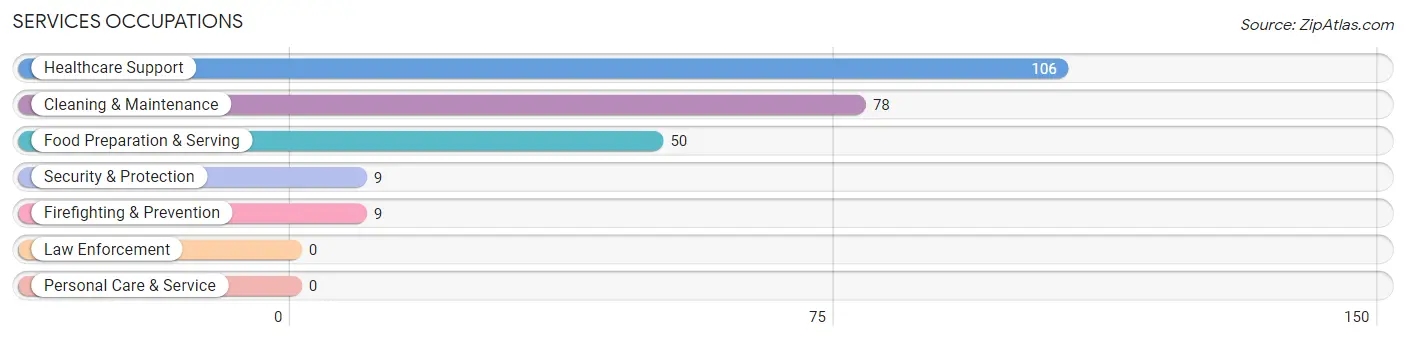
Services Occupations
The most common Services occupations in Glen Raven are Healthcare Support (106 | 6.0%), Cleaning & Maintenance (78 | 4.4%), Food Preparation & Serving (50 | 2.8%), Security & Protection (9 | 0.5%), and Firefighting & Prevention (9 | 0.5%).
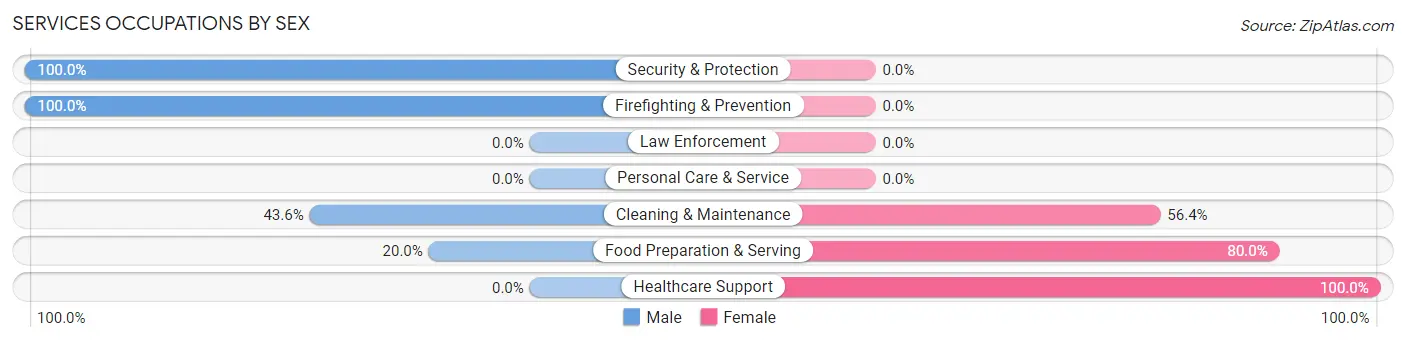
Services Occupations by Sex
Within the Services occupations in Glen Raven, the most male-oriented occupations are Security & Protection (100.0%), Firefighting & Prevention (100.0%), and Cleaning & Maintenance (43.6%), while the most female-oriented occupations are Healthcare Support (100.0%), Food Preparation & Serving (80.0%), and Cleaning & Maintenance (56.4%).
| Occupation | Male | Female |
| Healthcare Support | 0 (0.0%) | 106 (100.0%) |
| Security & Protection | 9 (100.0%) | 0 (0.0%) |
| Firefighting & Prevention | 9 (100.0%) | 0 (0.0%) |
| Law Enforcement | 0 (0.0%) | 0 (0.0%) |
| Food Preparation & Serving | 10 (20.0%) | 40 (80.0%) |
| Cleaning & Maintenance | 34 (43.6%) | 44 (56.4%) |
| Personal Care & Service | 0 (0.0%) | 0 (0.0%) |
| Total (Category) | 53 (21.8%) | 190 (78.2%) |
| Total (Overall) | 920 (51.7%) | 860 (48.3%) |
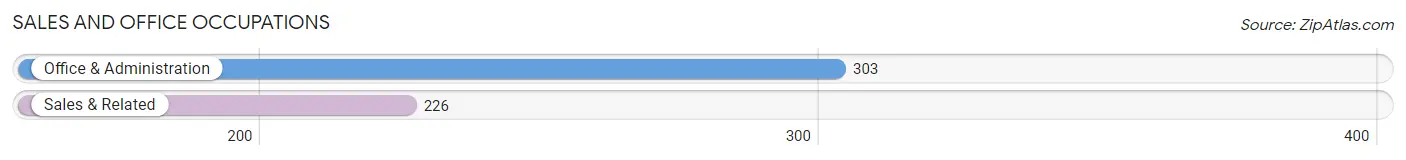
Sales and Office Occupations
The most common Sales and Office occupations in Glen Raven are Office & Administration (303 | 17.0%), and Sales & Related (226 | 12.7%).
Sales and Office Occupations by Sex
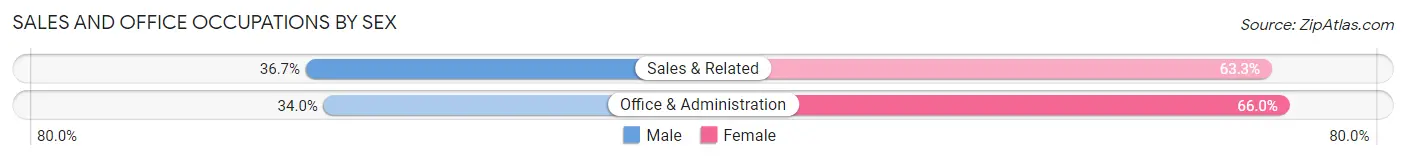
| Occupation | Male | Female |
| Sales & Related | 83 (36.7%) | 143 (63.3%) |
| Office & Administration | 103 (34.0%) | 200 (66.0%) |
| Total (Category) | 186 (35.2%) | 343 (64.8%) |
| Total (Overall) | 920 (51.7%) | 860 (48.3%) |
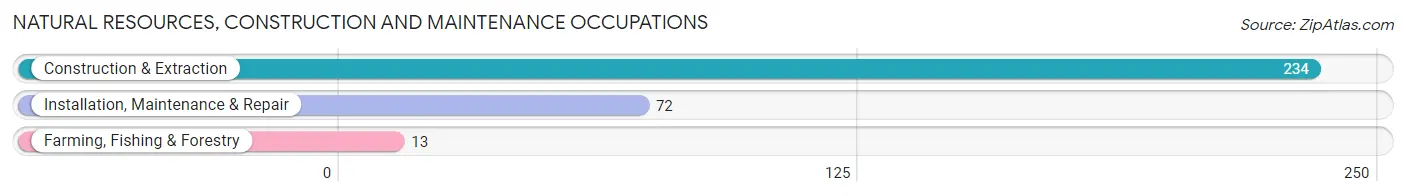
Natural Resources, Construction and Maintenance Occupations
The most common Natural Resources, Construction and Maintenance occupations in Glen Raven are Construction & Extraction (234 | 13.2%), Installation, Maintenance & Repair (72 | 4.0%), and Farming, Fishing & Forestry (13 | 0.7%).
Natural Resources, Construction and Maintenance Occupations by Sex
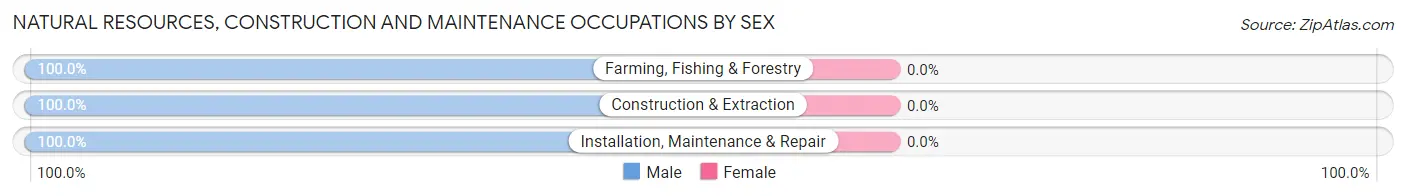
| Occupation | Male | Female |
| Farming, Fishing & Forestry | 13 (100.0%) | 0 (0.0%) |
| Construction & Extraction | 234 (100.0%) | 0 (0.0%) |
| Installation, Maintenance & Repair | 72 (100.0%) | 0 (0.0%) |
| Total (Category) | 319 (100.0%) | 0 (0.0%) |
| Total (Overall) | 920 (51.7%) | 860 (48.3%) |
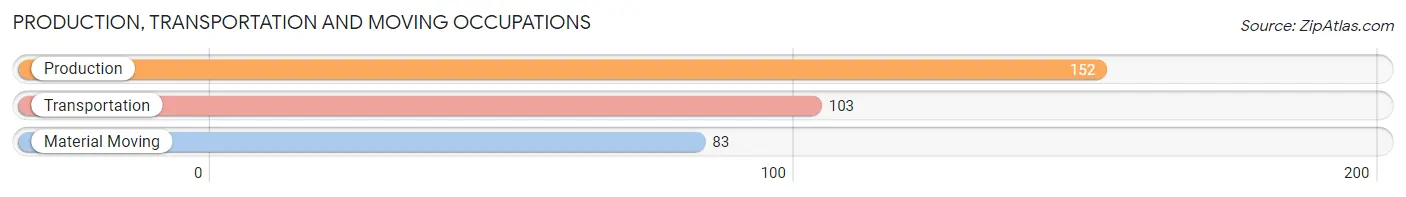
Production, Transportation and Moving Occupations
The most common Production, Transportation and Moving occupations in Glen Raven are Production (152 | 8.5%), Transportation (103 | 5.8%), and Material Moving (83 | 4.7%).
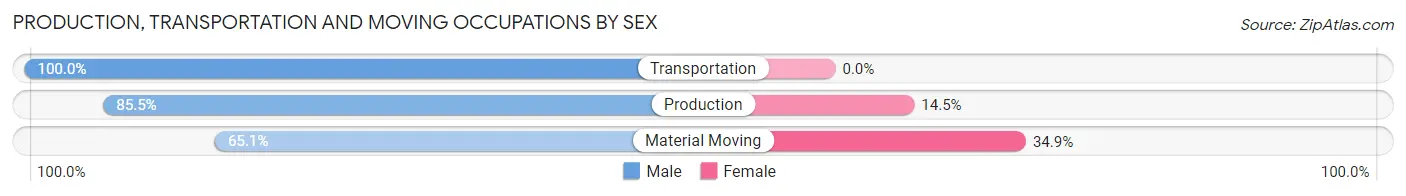
Production, Transportation and Moving Occupations by Sex
| Occupation | Male | Female |
| Production | 130 (85.5%) | 22 (14.5%) |
| Transportation | 103 (100.0%) | 0 (0.0%) |
| Material Moving | 54 (65.1%) | 29 (34.9%) |
| Total (Category) | 287 (84.9%) | 51 (15.1%) |
| Total (Overall) | 920 (51.7%) | 860 (48.3%) |
Employment Industries by Sex in Glen Raven
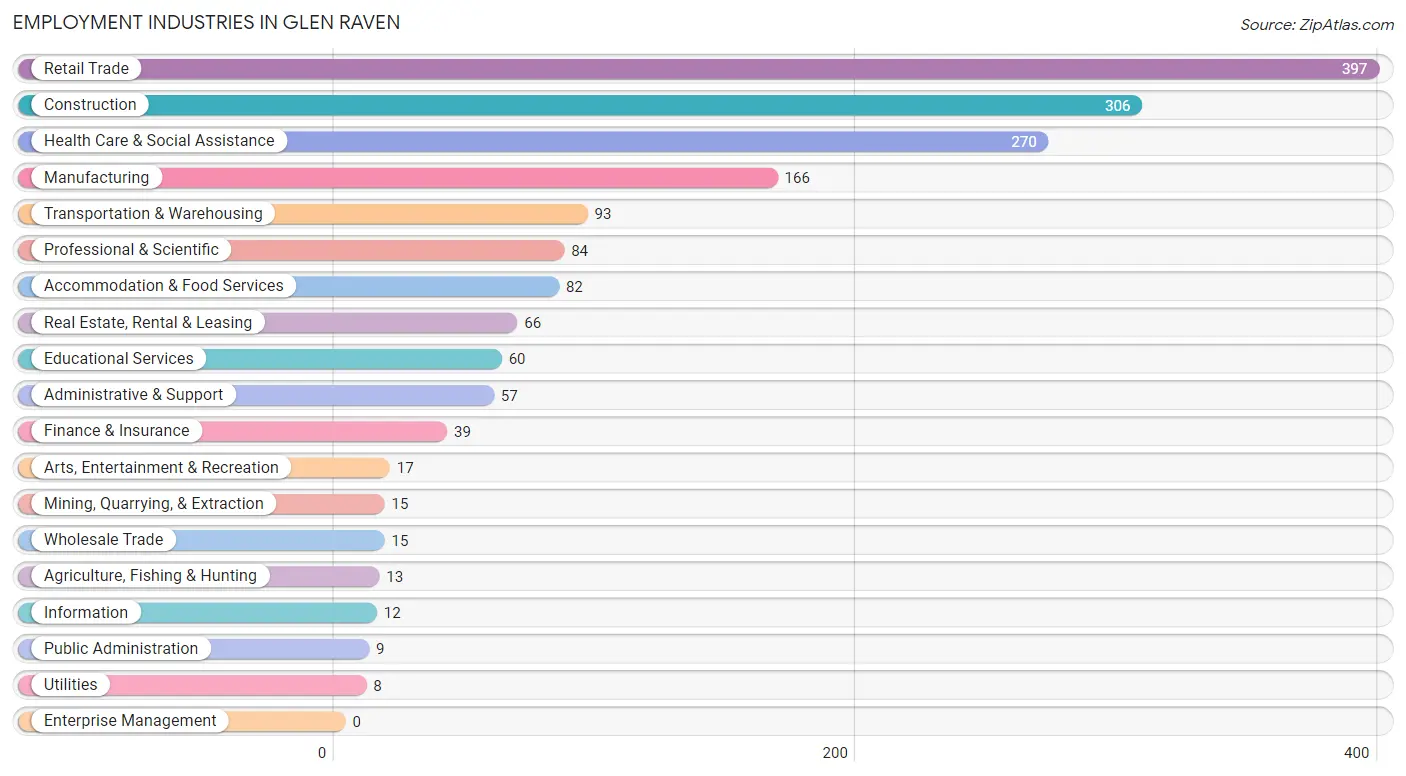
Employment Industries in Glen Raven
The major employment industries in Glen Raven include Retail Trade (397 | 22.3%), Construction (306 | 17.2%), Health Care & Social Assistance (270 | 15.2%), Manufacturing (166 | 9.3%), and Transportation & Warehousing (93 | 5.2%).
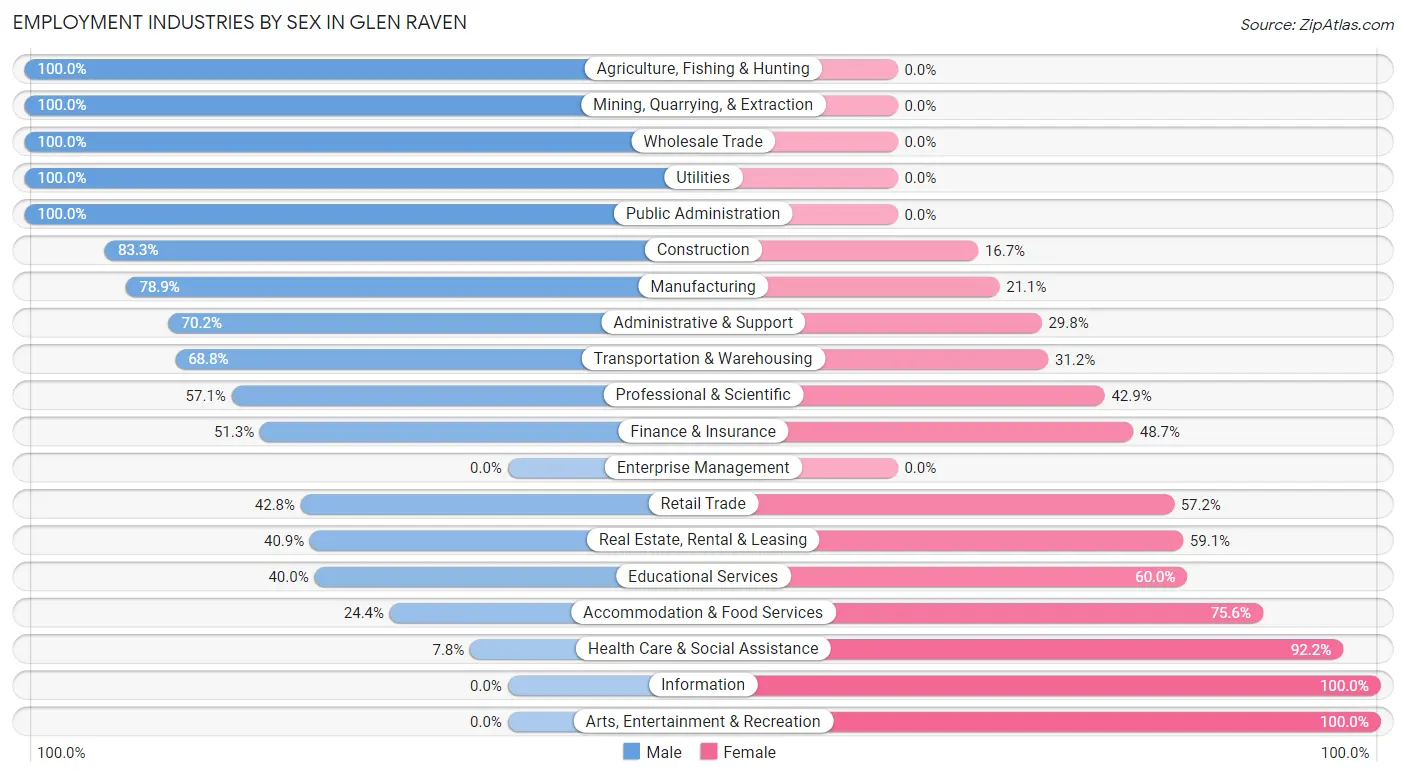
Employment Industries by Sex in Glen Raven
The Glen Raven industries that see more men than women are Agriculture, Fishing & Hunting (100.0%), Mining, Quarrying, & Extraction (100.0%), and Wholesale Trade (100.0%), whereas the industries that tend to have a higher number of women are Information (100.0%), Arts, Entertainment & Recreation (100.0%), and Health Care & Social Assistance (92.2%).
| Industry | Male | Female |
| Agriculture, Fishing & Hunting | 13 (100.0%) | 0 (0.0%) |
| Mining, Quarrying, & Extraction | 15 (100.0%) | 0 (0.0%) |
| Construction | 255 (83.3%) | 51 (16.7%) |
| Manufacturing | 131 (78.9%) | 35 (21.1%) |
| Wholesale Trade | 15 (100.0%) | 0 (0.0%) |
| Retail Trade | 170 (42.8%) | 227 (57.2%) |
| Transportation & Warehousing | 64 (68.8%) | 29 (31.2%) |
| Utilities | 8 (100.0%) | 0 (0.0%) |
| Information | 0 (0.0%) | 12 (100.0%) |
| Finance & Insurance | 20 (51.3%) | 19 (48.7%) |
| Real Estate, Rental & Leasing | 27 (40.9%) | 39 (59.1%) |
| Professional & Scientific | 48 (57.1%) | 36 (42.9%) |
| Enterprise Management | 0 (0.0%) | 0 (0.0%) |
| Administrative & Support | 40 (70.2%) | 17 (29.8%) |
| Educational Services | 24 (40.0%) | 36 (60.0%) |
| Health Care & Social Assistance | 21 (7.8%) | 249 (92.2%) |
| Arts, Entertainment & Recreation | 0 (0.0%) | 17 (100.0%) |
| Accommodation & Food Services | 20 (24.4%) | 62 (75.6%) |
| Public Administration | 9 (100.0%) | 0 (0.0%) |
| Total | 920 (51.7%) | 860 (48.3%) |
Education in Glen Raven
School Enrollment in Glen Raven
The most common levels of schooling among the 991 students in Glen Raven are high school (291 | 29.4%), middle school (224 | 22.6%), and college / undergraduate (216 | 21.8%).
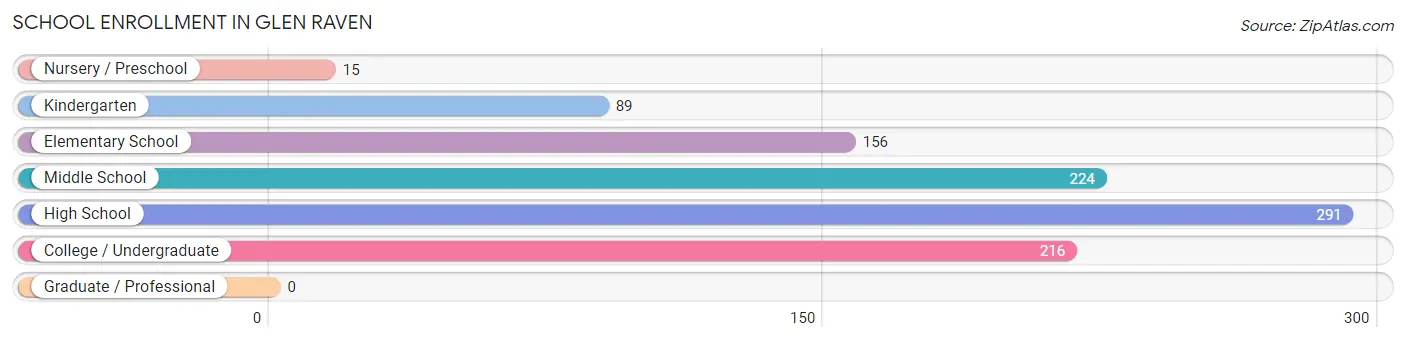
| School Level | # Students | % Students |
| Nursery / Preschool | 15 | 1.5% |
| Kindergarten | 89 | 9.0% |
| Elementary School | 156 | 15.7% |
| Middle School | 224 | 22.6% |
| High School | 291 | 29.4% |
| College / Undergraduate | 216 | 21.8% |
| Graduate / Professional | 0 | 0.0% |
| Total | 991 | 100.0% |
School Enrollment by Age by Funding Source in Glen Raven
Out of a total of 991 students who are enrolled in schools in Glen Raven, 208 (21.0%) attend a private institution, while the remaining 783 (79.0%) are enrolled in public schools. The age group of 10 to 14 year olds has the highest likelihood of being enrolled in private schools, with 95 (43.2% in the age bracket) enrolled. Conversely, the age group of 3 to 4 year olds has the lowest likelihood of being enrolled in a private school, with 15 (100.0% in the age bracket) attending a public institution.
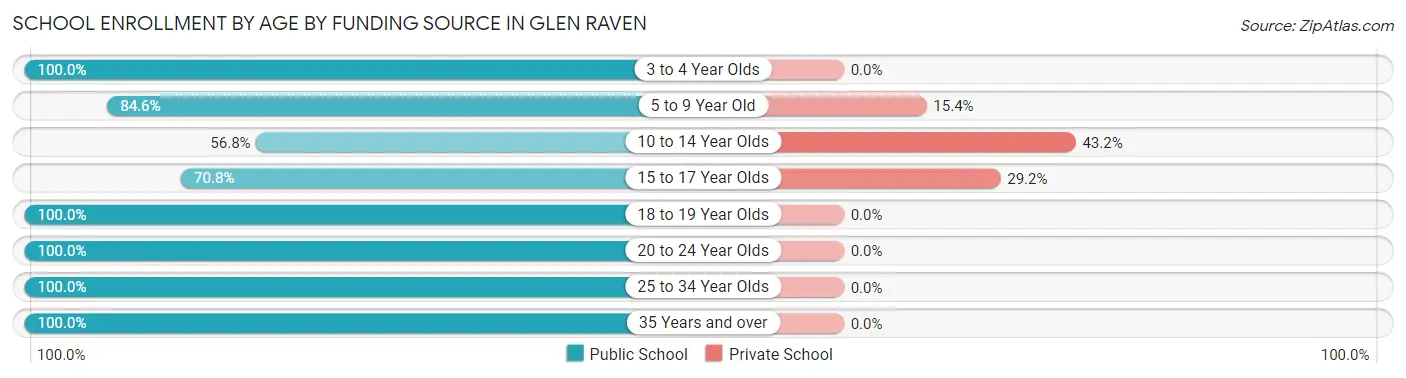
| Age Bracket | Public School | Private School |
| 3 to 4 Year Olds | 15 (100.0%) | 0 (0.0%) |
| 5 to 9 Year Old | 236 (84.6%) | 43 (15.4%) |
| 10 to 14 Year Olds | 125 (56.8%) | 95 (43.2%) |
| 15 to 17 Year Olds | 170 (70.8%) | 70 (29.2%) |
| 18 to 19 Year Olds | 106 (100.0%) | 0 (0.0%) |
| 20 to 24 Year Olds | 75 (100.0%) | 0 (0.0%) |
| 25 to 34 Year Olds | 33 (100.0%) | 0 (0.0%) |
| 35 Years and over | 23 (100.0%) | 0 (0.0%) |
| Total | 783 (79.0%) | 208 (21.0%) |
Educational Attainment by Field of Study in Glen Raven
Business (78 | 18.7%), science & technology (57 | 13.7%), education (52 | 12.5%), arts & humanities (51 | 12.2%), and liberal arts & history (33 | 7.9%) are the most common fields of study among 417 individuals in Glen Raven who have obtained a bachelor's degree or higher.
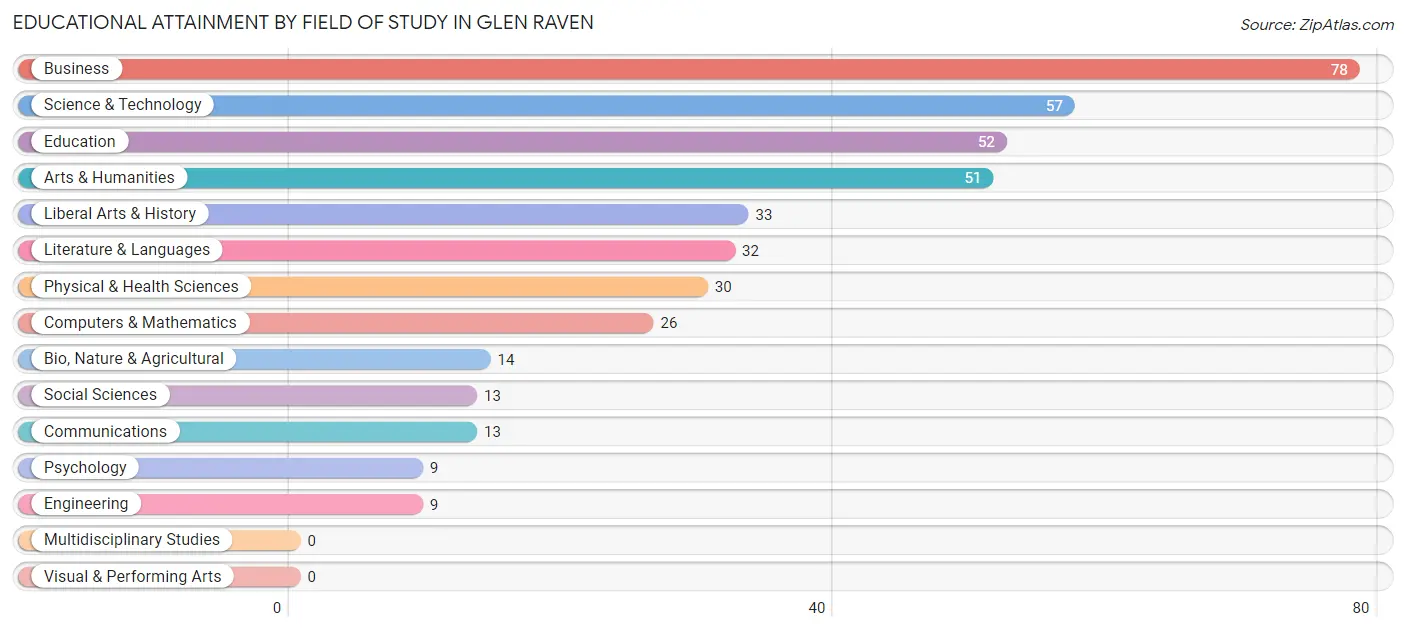
| Field of Study | # Graduates | % Graduates |
| Computers & Mathematics | 26 | 6.2% |
| Bio, Nature & Agricultural | 14 | 3.4% |
| Physical & Health Sciences | 30 | 7.2% |
| Psychology | 9 | 2.2% |
| Social Sciences | 13 | 3.1% |
| Engineering | 9 | 2.2% |
| Multidisciplinary Studies | 0 | 0.0% |
| Science & Technology | 57 | 13.7% |
| Business | 78 | 18.7% |
| Education | 52 | 12.5% |
| Literature & Languages | 32 | 7.7% |
| Liberal Arts & History | 33 | 7.9% |
| Visual & Performing Arts | 0 | 0.0% |
| Communications | 13 | 3.1% |
| Arts & Humanities | 51 | 12.2% |
| Total | 417 | 100.0% |
Transportation & Commute in Glen Raven
Vehicle Availability by Sex in Glen Raven
The most prevalent vehicle ownership categories in Glen Raven are males with 2 vehicles (298, accounting for 32.4%) and females with 2 vehicles (277, making up 36.2%).
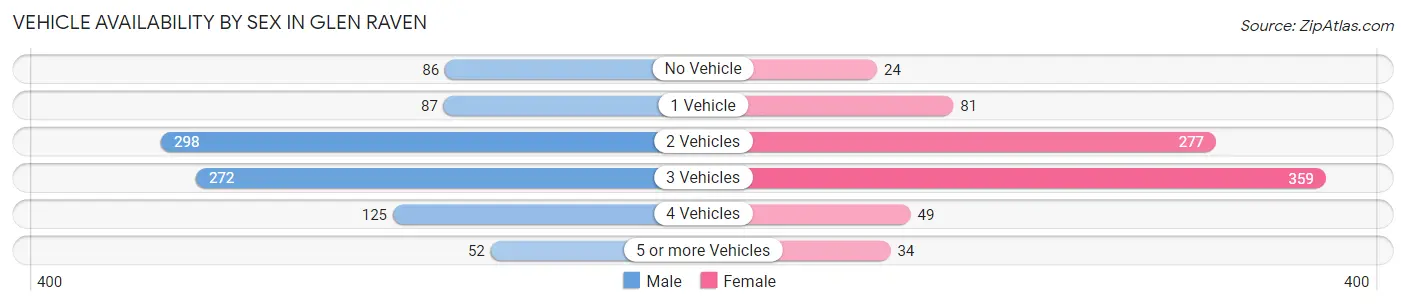
| Vehicles Available | Male | Female |
| No Vehicle | 86 (9.3%) | 24 (2.9%) |
| 1 Vehicle | 87 (9.5%) | 81 (9.8%) |
| 2 Vehicles | 298 (32.4%) | 277 (33.6%) |
| 3 Vehicles | 272 (29.6%) | 359 (43.6%) |
| 4 Vehicles | 125 (13.6%) | 49 (5.9%) |
| 5 or more Vehicles | 52 (5.7%) | 34 (4.1%) |
| Total | 920 (100.0%) | 824 (100.0%) |
Commute Time in Glen Raven
The most frequently occuring commute durations in Glen Raven are 15 to 19 minutes (376 commuters, 21.9%), 10 to 14 minutes (356 commuters, 20.7%), and 30 to 34 minutes (192 commuters, 11.2%).
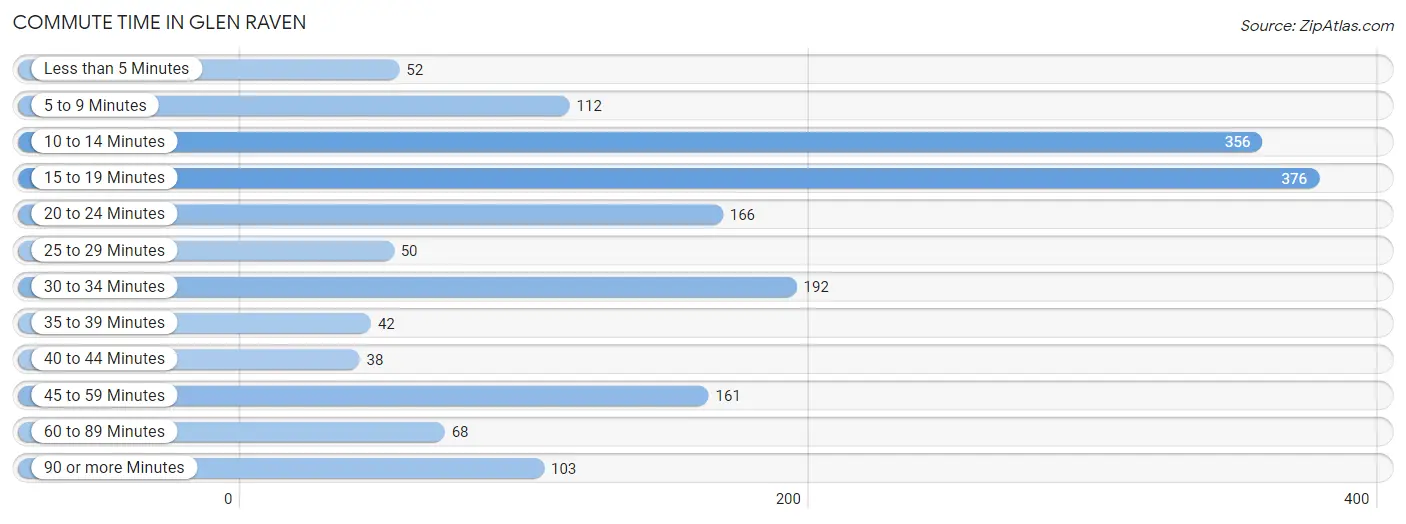
| Commute Time | # Commuters | % Commuters |
| Less than 5 Minutes | 52 | 3.0% |
| 5 to 9 Minutes | 112 | 6.5% |
| 10 to 14 Minutes | 356 | 20.7% |
| 15 to 19 Minutes | 376 | 21.9% |
| 20 to 24 Minutes | 166 | 9.7% |
| 25 to 29 Minutes | 50 | 2.9% |
| 30 to 34 Minutes | 192 | 11.2% |
| 35 to 39 Minutes | 42 | 2.5% |
| 40 to 44 Minutes | 38 | 2.2% |
| 45 to 59 Minutes | 161 | 9.4% |
| 60 to 89 Minutes | 68 | 4.0% |
| 90 or more Minutes | 103 | 6.0% |
Commute Time by Sex in Glen Raven
The most common commute times in Glen Raven are 15 to 19 minutes (217 commuters, 24.3%) for males and 10 to 14 minutes (210 commuters, 25.5%) for females.
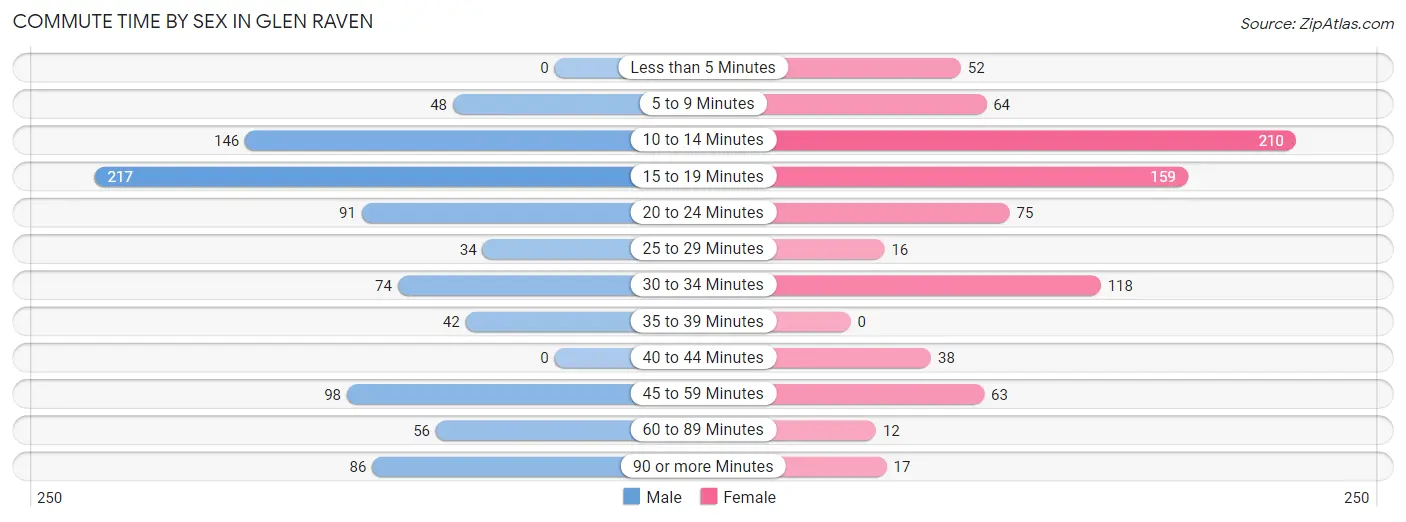
| Commute Time | Male | Female |
| Less than 5 Minutes | 0 (0.0%) | 52 (6.3%) |
| 5 to 9 Minutes | 48 (5.4%) | 64 (7.8%) |
| 10 to 14 Minutes | 146 (16.4%) | 210 (25.5%) |
| 15 to 19 Minutes | 217 (24.3%) | 159 (19.3%) |
| 20 to 24 Minutes | 91 (10.2%) | 75 (9.1%) |
| 25 to 29 Minutes | 34 (3.8%) | 16 (1.9%) |
| 30 to 34 Minutes | 74 (8.3%) | 118 (14.3%) |
| 35 to 39 Minutes | 42 (4.7%) | 0 (0.0%) |
| 40 to 44 Minutes | 0 (0.0%) | 38 (4.6%) |
| 45 to 59 Minutes | 98 (11.0%) | 63 (7.6%) |
| 60 to 89 Minutes | 56 (6.3%) | 12 (1.5%) |
| 90 or more Minutes | 86 (9.6%) | 17 (2.1%) |
Time of Departure to Work by Sex in Glen Raven
The most frequent times of departure to work in Glen Raven are 7:00 AM to 7:29 AM (239, 26.8%) for males and 7:00 AM to 7:29 AM (148, 18.0%) for females.
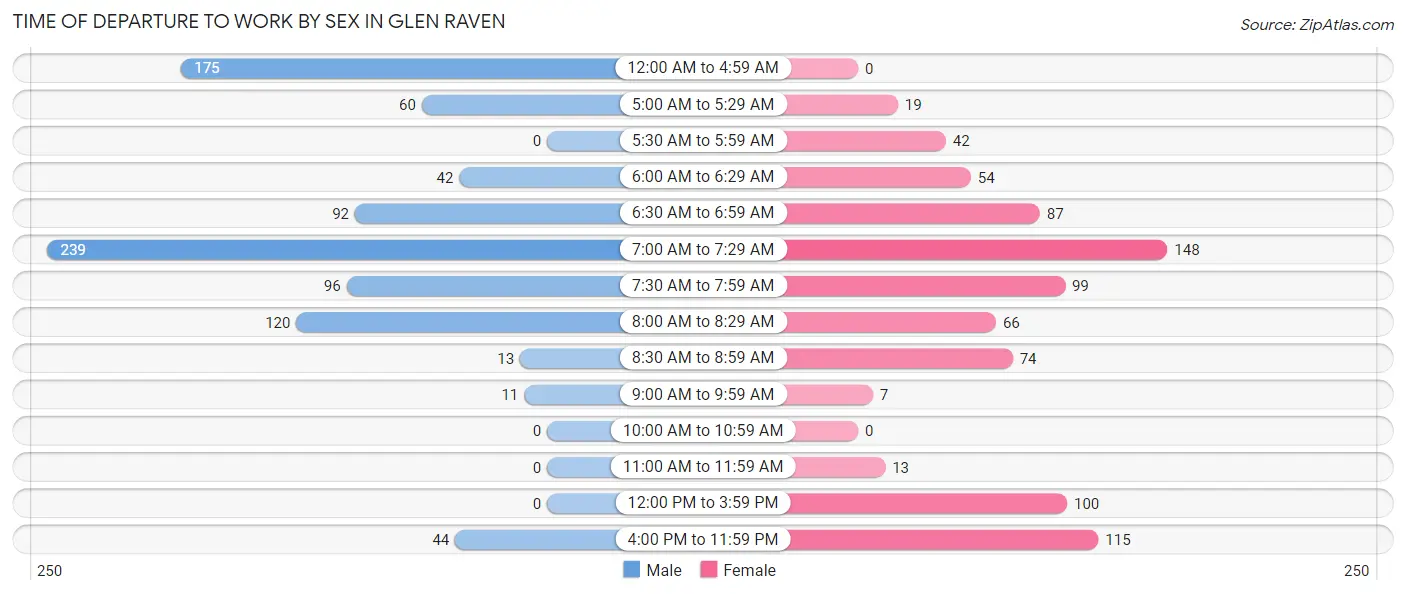
| Time of Departure | Male | Female |
| 12:00 AM to 4:59 AM | 175 (19.6%) | 0 (0.0%) |
| 5:00 AM to 5:29 AM | 60 (6.7%) | 19 (2.3%) |
| 5:30 AM to 5:59 AM | 0 (0.0%) | 42 (5.1%) |
| 6:00 AM to 6:29 AM | 42 (4.7%) | 54 (6.6%) |
| 6:30 AM to 6:59 AM | 92 (10.3%) | 87 (10.6%) |
| 7:00 AM to 7:29 AM | 239 (26.8%) | 148 (18.0%) |
| 7:30 AM to 7:59 AM | 96 (10.8%) | 99 (12.0%) |
| 8:00 AM to 8:29 AM | 120 (13.5%) | 66 (8.0%) |
| 8:30 AM to 8:59 AM | 13 (1.5%) | 74 (9.0%) |
| 9:00 AM to 9:59 AM | 11 (1.2%) | 7 (0.9%) |
| 10:00 AM to 10:59 AM | 0 (0.0%) | 0 (0.0%) |
| 11:00 AM to 11:59 AM | 0 (0.0%) | 13 (1.6%) |
| 12:00 PM to 3:59 PM | 0 (0.0%) | 100 (12.1%) |
| 4:00 PM to 11:59 PM | 44 (4.9%) | 115 (14.0%) |
| Total | 892 (100.0%) | 824 (100.0%) |
Housing Occupancy in Glen Raven
Occupancy by Ownership in Glen Raven
Of the total 1,249 dwellings in Glen Raven, owner-occupied units account for 943 (75.5%), while renter-occupied units make up 306 (24.5%).
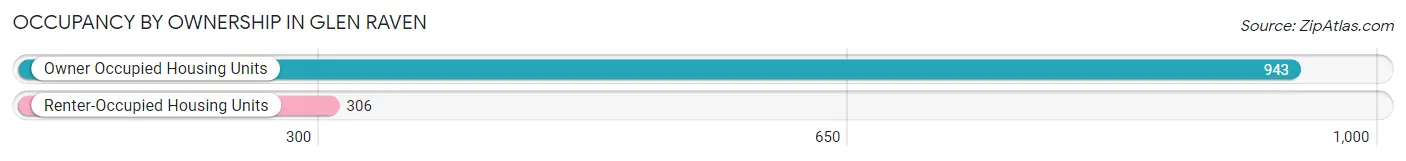
| Occupancy | # Housing Units | % Housing Units |
| Owner Occupied Housing Units | 943 | 75.5% |
| Renter-Occupied Housing Units | 306 | 24.5% |
| Total Occupied Housing Units | 1,249 | 100.0% |
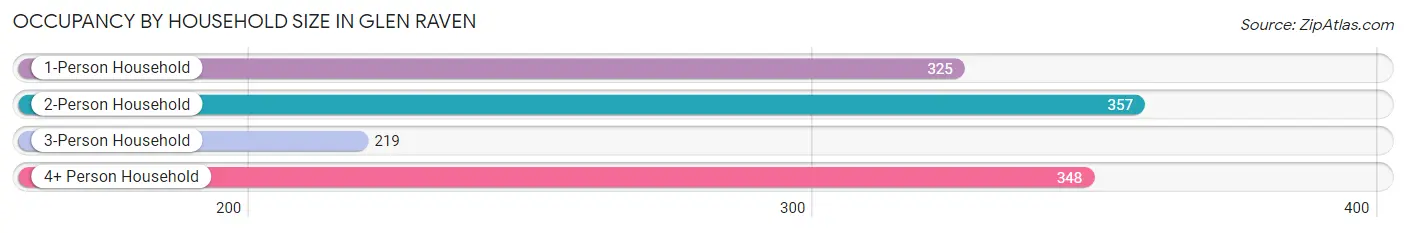
Occupancy by Household Size in Glen Raven
| Household Size | # Housing Units | % Housing Units |
| 1-Person Household | 325 | 26.0% |
| 2-Person Household | 357 | 28.6% |
| 3-Person Household | 219 | 17.5% |
| 4+ Person Household | 348 | 27.9% |
| Total Housing Units | 1,249 | 100.0% |
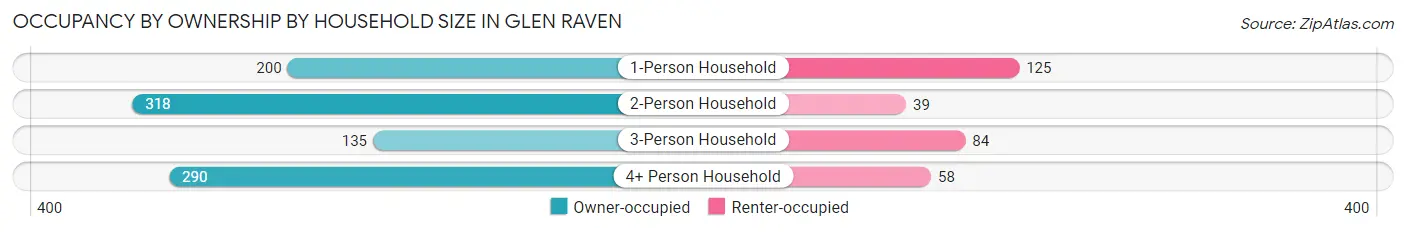
Occupancy by Ownership by Household Size in Glen Raven
| Household Size | Owner-occupied | Renter-occupied |
| 1-Person Household | 200 (61.5%) | 125 (38.5%) |
| 2-Person Household | 318 (89.1%) | 39 (10.9%) |
| 3-Person Household | 135 (61.6%) | 84 (38.4%) |
| 4+ Person Household | 290 (83.3%) | 58 (16.7%) |
| Total Housing Units | 943 (75.5%) | 306 (24.5%) |
Occupancy by Educational Attainment in Glen Raven
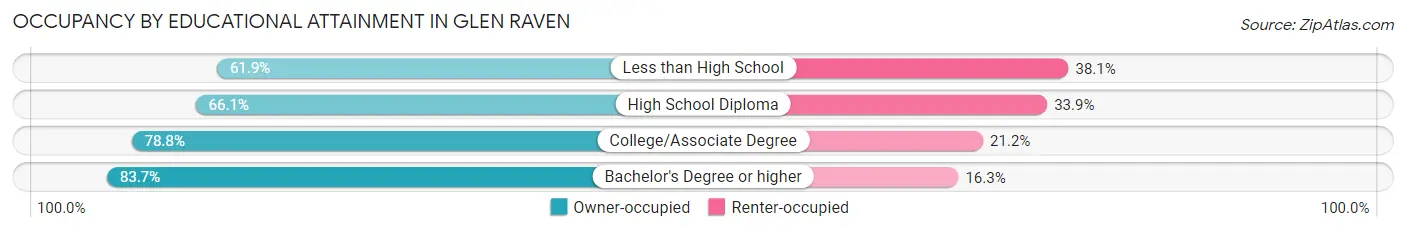
| Household Size | Owner-occupied | Renter-occupied |
| Less than High School | 60 (61.9%) | 37 (38.1%) |
| High School Diploma | 189 (66.1%) | 97 (33.9%) |
| College/Associate Degree | 494 (78.8%) | 133 (21.2%) |
| Bachelor's Degree or higher | 200 (83.7%) | 39 (16.3%) |
Occupancy by Age of Householder in Glen Raven
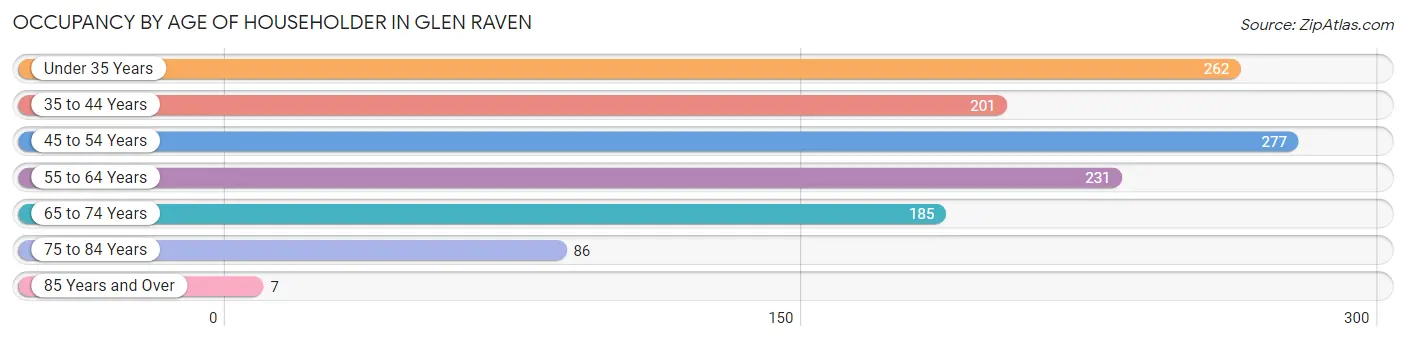
| Age Bracket | # Households | % Households |
| Under 35 Years | 262 | 21.0% |
| 35 to 44 Years | 201 | 16.1% |
| 45 to 54 Years | 277 | 22.2% |
| 55 to 64 Years | 231 | 18.5% |
| 65 to 74 Years | 185 | 14.8% |
| 75 to 84 Years | 86 | 6.9% |
| 85 Years and Over | 7 | 0.6% |
| Total | 1,249 | 100.0% |
Housing Finances in Glen Raven
Median Income by Occupancy in Glen Raven
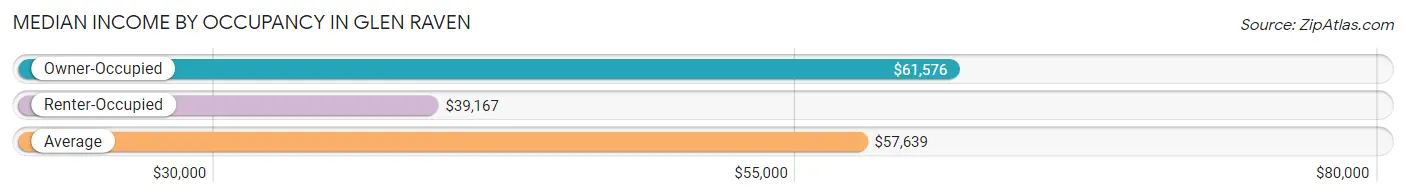
| Occupancy Type | # Households | Median Income |
| Owner-Occupied | 943 (75.5%) | $61,576 |
| Renter-Occupied | 306 (24.5%) | $39,167 |
| Average | 1,249 (100.0%) | $57,639 |
Occupancy by Householder Income Bracket in Glen Raven
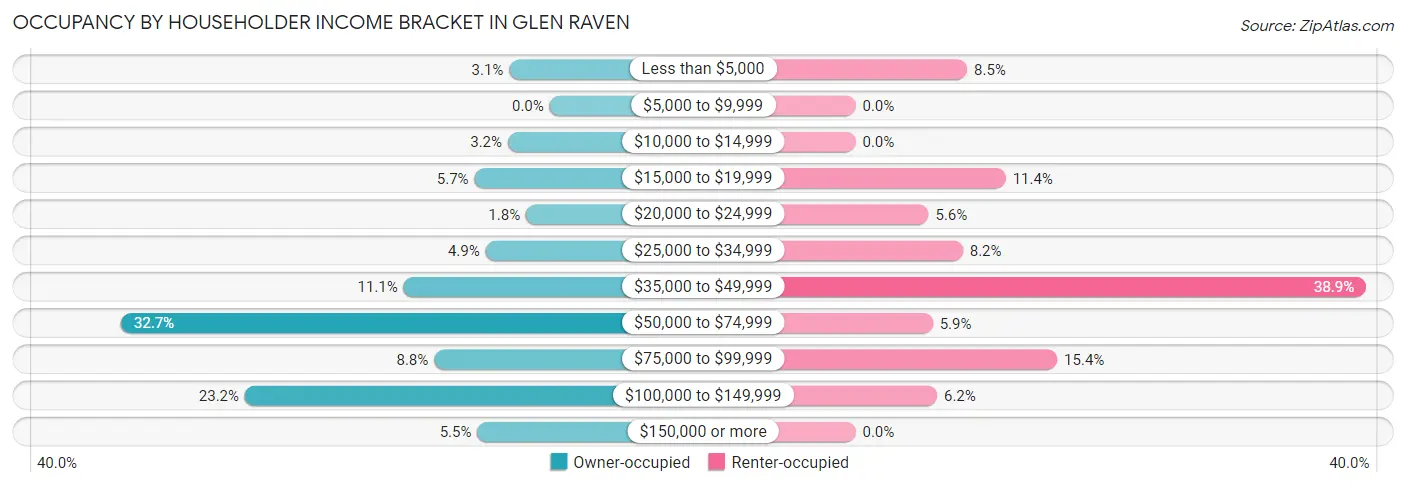
| Income Bracket | Owner-occupied | Renter-occupied |
| Less than $5,000 | 29 (3.1%) | 26 (8.5%) |
| $5,000 to $9,999 | 0 (0.0%) | 0 (0.0%) |
| $10,000 to $14,999 | 30 (3.2%) | 0 (0.0%) |
| $15,000 to $19,999 | 54 (5.7%) | 35 (11.4%) |
| $20,000 to $24,999 | 17 (1.8%) | 17 (5.6%) |
| $25,000 to $34,999 | 46 (4.9%) | 25 (8.2%) |
| $35,000 to $49,999 | 105 (11.1%) | 119 (38.9%) |
| $50,000 to $74,999 | 308 (32.7%) | 18 (5.9%) |
| $75,000 to $99,999 | 83 (8.8%) | 47 (15.4%) |
| $100,000 to $149,999 | 219 (23.2%) | 19 (6.2%) |
| $150,000 or more | 52 (5.5%) | 0 (0.0%) |
| Total | 943 (100.0%) | 306 (100.0%) |
Monthly Housing Cost Tiers in Glen Raven
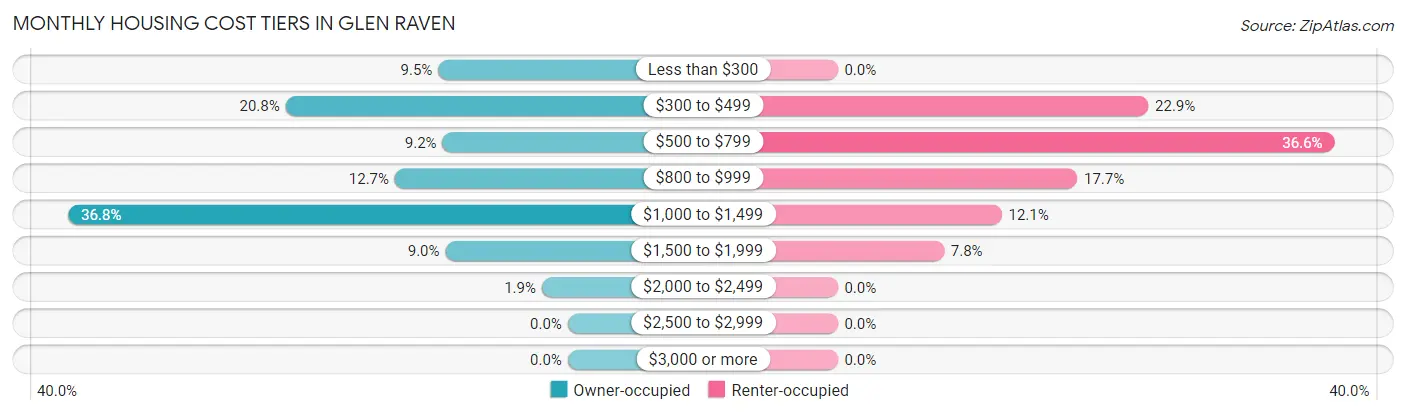
| Monthly Cost | Owner-occupied | Renter-occupied |
| Less than $300 | 90 (9.5%) | 0 (0.0%) |
| $300 to $499 | 196 (20.8%) | 70 (22.9%) |
| $500 to $799 | 87 (9.2%) | 112 (36.6%) |
| $800 to $999 | 120 (12.7%) | 54 (17.6%) |
| $1,000 to $1,499 | 347 (36.8%) | 37 (12.1%) |
| $1,500 to $1,999 | 85 (9.0%) | 24 (7.8%) |
| $2,000 to $2,499 | 18 (1.9%) | 0 (0.0%) |
| $2,500 to $2,999 | 0 (0.0%) | 0 (0.0%) |
| $3,000 or more | 0 (0.0%) | 0 (0.0%) |
| Total | 943 (100.0%) | 306 (100.0%) |
Physical Housing Characteristics in Glen Raven
Housing Structures in Glen Raven
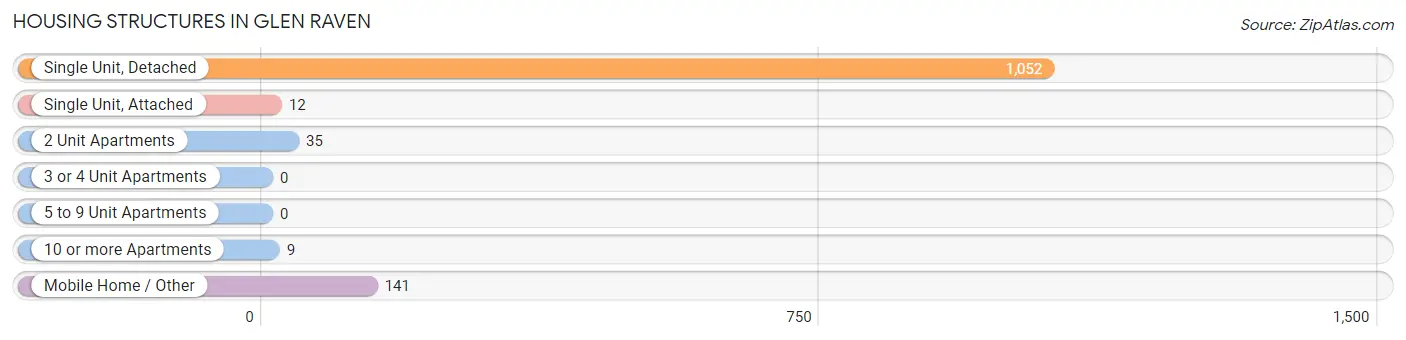
| Structure Type | # Housing Units | % Housing Units |
| Single Unit, Detached | 1,052 | 84.2% |
| Single Unit, Attached | 12 | 1.0% |
| 2 Unit Apartments | 35 | 2.8% |
| 3 or 4 Unit Apartments | 0 | 0.0% |
| 5 to 9 Unit Apartments | 0 | 0.0% |
| 10 or more Apartments | 9 | 0.7% |
| Mobile Home / Other | 141 | 11.3% |
| Total | 1,249 | 100.0% |
Housing Structures by Occupancy in Glen Raven
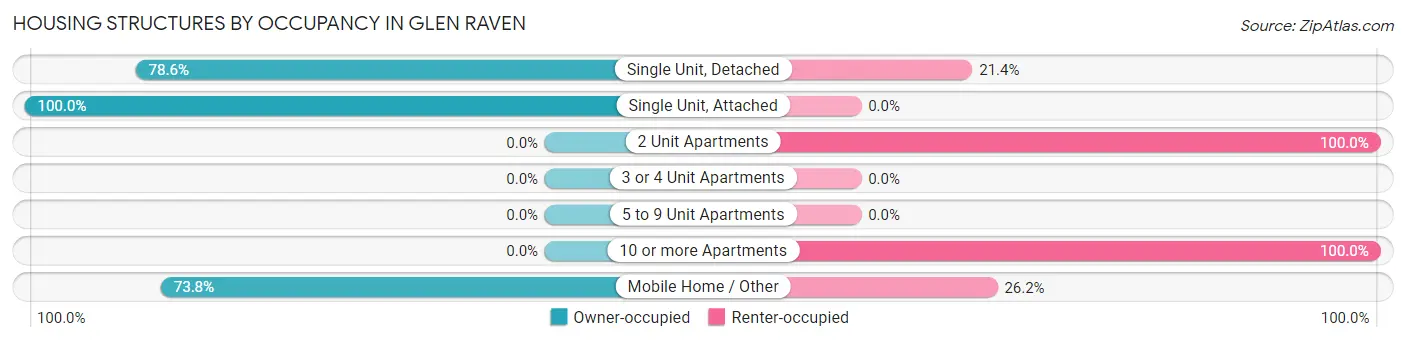
| Structure Type | Owner-occupied | Renter-occupied |
| Single Unit, Detached | 827 (78.6%) | 225 (21.4%) |
| Single Unit, Attached | 12 (100.0%) | 0 (0.0%) |
| 2 Unit Apartments | 0 (0.0%) | 35 (100.0%) |
| 3 or 4 Unit Apartments | 0 (0.0%) | 0 (0.0%) |
| 5 to 9 Unit Apartments | 0 (0.0%) | 0 (0.0%) |
| 10 or more Apartments | 0 (0.0%) | 9 (100.0%) |
| Mobile Home / Other | 104 (73.8%) | 37 (26.2%) |
| Total | 943 (75.5%) | 306 (24.5%) |
Housing Structures by Number of Rooms in Glen Raven
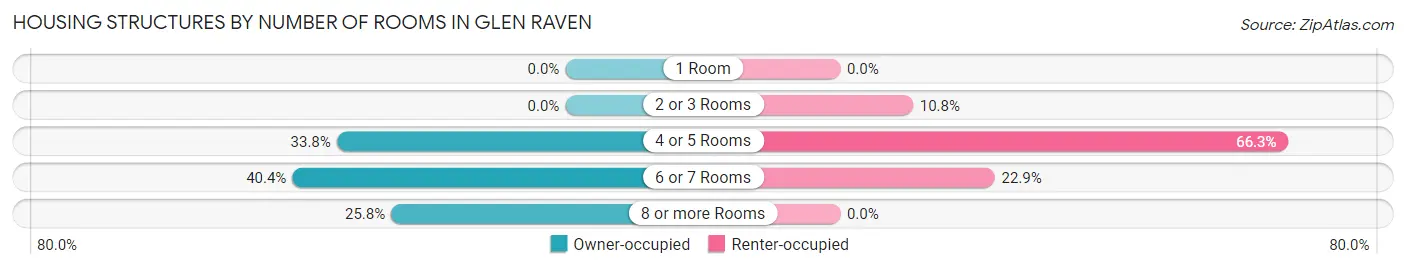
| Number of Rooms | Owner-occupied | Renter-occupied |
| 1 Room | 0 (0.0%) | 0 (0.0%) |
| 2 or 3 Rooms | 0 (0.0%) | 33 (10.8%) |
| 4 or 5 Rooms | 319 (33.8%) | 203 (66.3%) |
| 6 or 7 Rooms | 381 (40.4%) | 70 (22.9%) |
| 8 or more Rooms | 243 (25.8%) | 0 (0.0%) |
| Total | 943 (100.0%) | 306 (100.0%) |
Housing Structure by Heating Type in Glen Raven
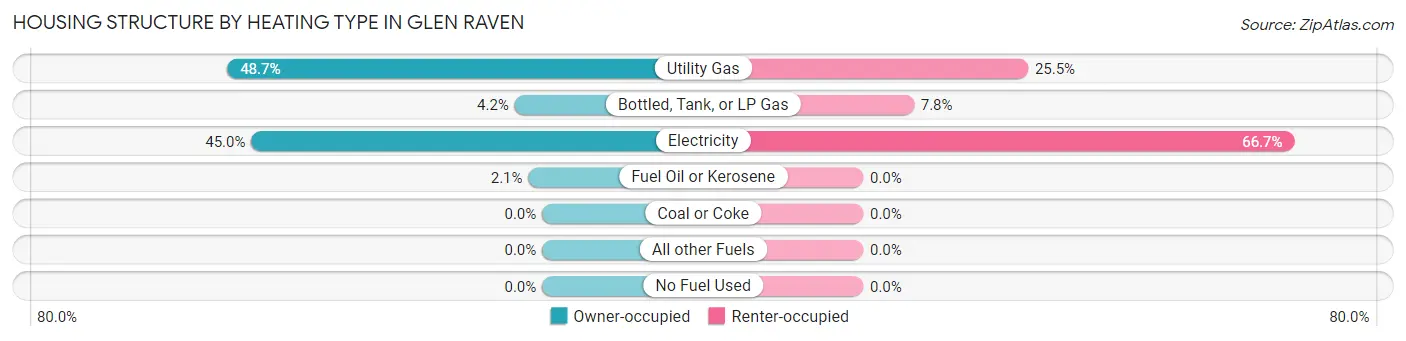
| Heating Type | Owner-occupied | Renter-occupied |
| Utility Gas | 459 (48.7%) | 78 (25.5%) |
| Bottled, Tank, or LP Gas | 40 (4.2%) | 24 (7.8%) |
| Electricity | 424 (45.0%) | 204 (66.7%) |
| Fuel Oil or Kerosene | 20 (2.1%) | 0 (0.0%) |
| Coal or Coke | 0 (0.0%) | 0 (0.0%) |
| All other Fuels | 0 (0.0%) | 0 (0.0%) |
| No Fuel Used | 0 (0.0%) | 0 (0.0%) |
| Total | 943 (100.0%) | 306 (100.0%) |
Household Vehicle Usage in Glen Raven
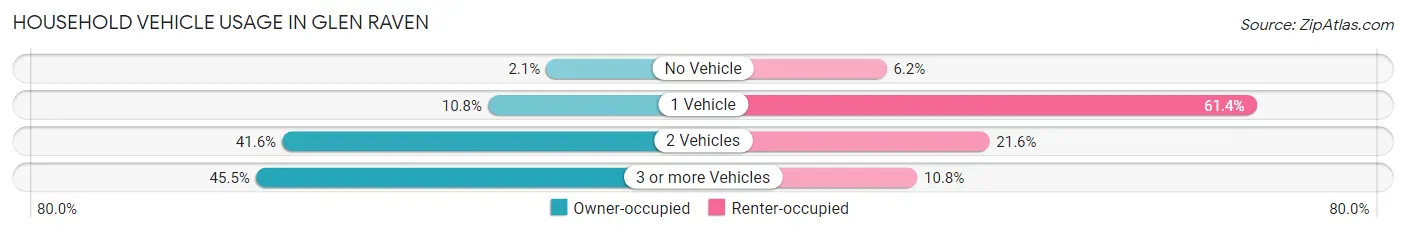
| Vehicles per Household | Owner-occupied | Renter-occupied |
| No Vehicle | 20 (2.1%) | 19 (6.2%) |
| 1 Vehicle | 102 (10.8%) | 188 (61.4%) |
| 2 Vehicles | 392 (41.6%) | 66 (21.6%) |
| 3 or more Vehicles | 429 (45.5%) | 33 (10.8%) |
| Total | 943 (100.0%) | 306 (100.0%) |
Real Estate & Mortgages in Glen Raven
Real Estate and Mortgage Overview in Glen Raven
| Characteristic | Without Mortgage | With Mortgage |
| Housing Units | 289 | 654 |
| Median Property Value | $161,100 | $194,300 |
| Median Household Income | $52,708 | $20 |
| Monthly Housing Costs | $343 | $0 |
| Real Estate Taxes | $1,267 | $60 |
Property Value by Mortgage Status in Glen Raven
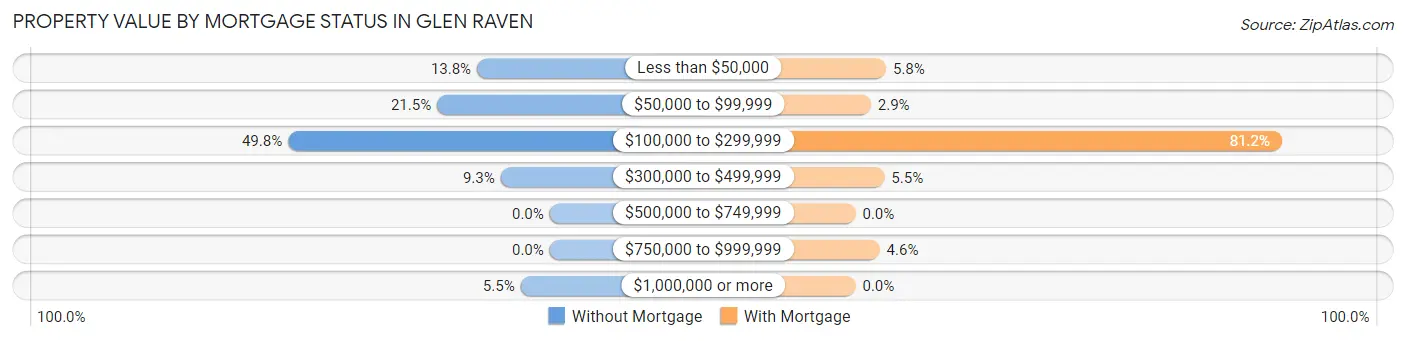
| Property Value | Without Mortgage | With Mortgage |
| Less than $50,000 | 40 (13.8%) | 38 (5.8%) |
| $50,000 to $99,999 | 62 (21.4%) | 19 (2.9%) |
| $100,000 to $299,999 | 144 (49.8%) | 531 (81.2%) |
| $300,000 to $499,999 | 27 (9.3%) | 36 (5.5%) |
| $500,000 to $749,999 | 0 (0.0%) | 0 (0.0%) |
| $750,000 to $999,999 | 0 (0.0%) | 30 (4.6%) |
| $1,000,000 or more | 16 (5.5%) | 0 (0.0%) |
| Total | 289 (100.0%) | 654 (100.0%) |
Household Income by Mortgage Status in Glen Raven
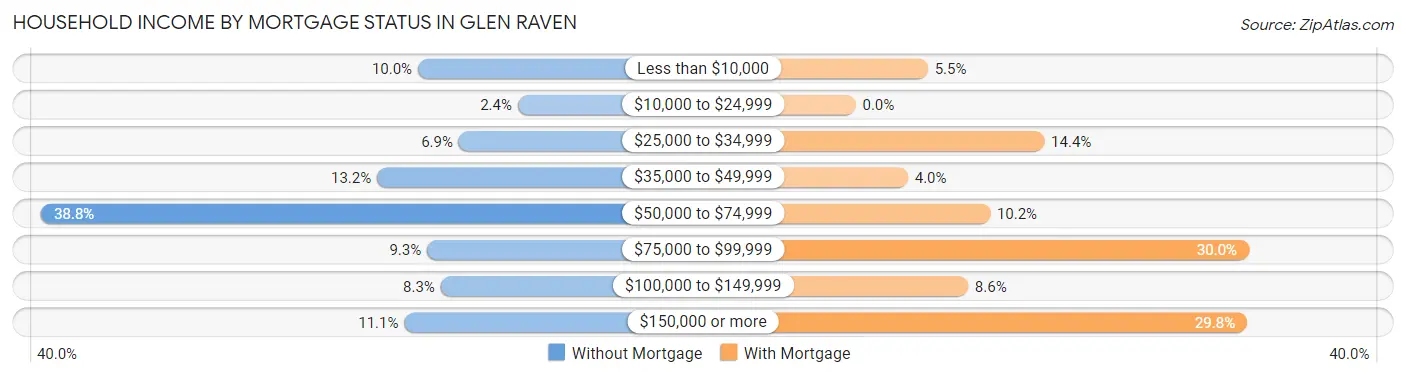
| Household Income | Without Mortgage | With Mortgage |
| Less than $10,000 | 29 (10.0%) | 36 (5.5%) |
| $10,000 to $24,999 | 7 (2.4%) | 0 (0.0%) |
| $25,000 to $34,999 | 20 (6.9%) | 94 (14.4%) |
| $35,000 to $49,999 | 38 (13.2%) | 26 (4.0%) |
| $50,000 to $74,999 | 112 (38.8%) | 67 (10.2%) |
| $75,000 to $99,999 | 27 (9.3%) | 196 (30.0%) |
| $100,000 to $149,999 | 24 (8.3%) | 56 (8.6%) |
| $150,000 or more | 32 (11.1%) | 195 (29.8%) |
| Total | 289 (100.0%) | 654 (100.0%) |
Property Value to Household Income Ratio in Glen Raven
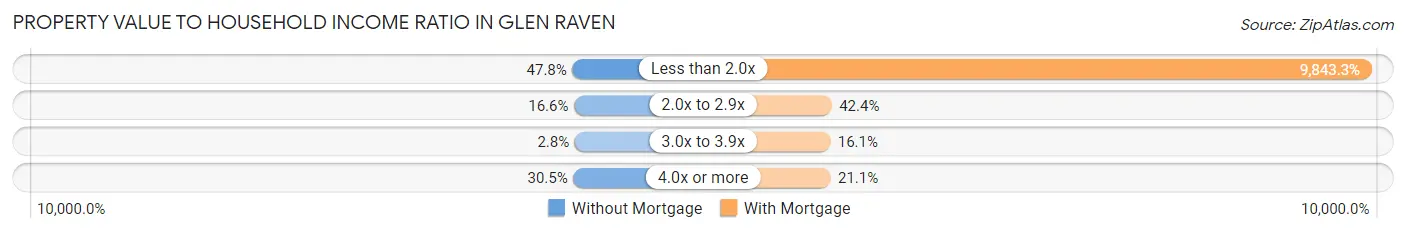
| Value-to-Income Ratio | Without Mortgage | With Mortgage |
| Less than 2.0x | 138 (47.7%) | 64,375 (9,843.3%) |
| 2.0x to 2.9x | 48 (16.6%) | 277 (42.3%) |
| 3.0x to 3.9x | 8 (2.8%) | 105 (16.1%) |
| 4.0x or more | 88 (30.4%) | 138 (21.1%) |
| Total | 289 (100.0%) | 654 (100.0%) |
Real Estate Taxes by Mortgage Status in Glen Raven
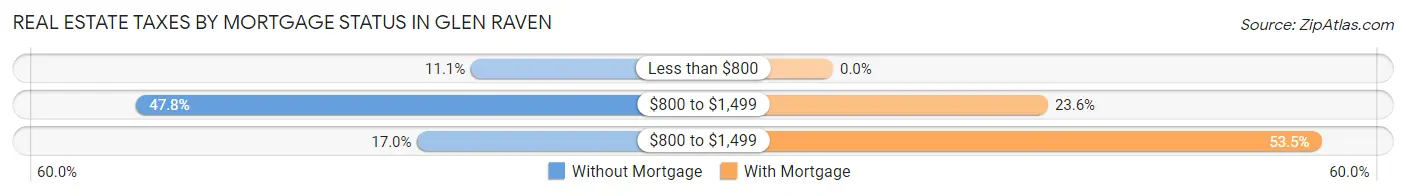
| Property Taxes | Without Mortgage | With Mortgage |
| Less than $800 | 32 (11.1%) | 0 (0.0%) |
| $800 to $1,499 | 138 (47.7%) | 154 (23.5%) |
| $800 to $1,499 | 49 (17.0%) | 350 (53.5%) |
| Total | 289 (100.0%) | 654 (100.0%) |
Health & Disability in Glen Raven
Health Insurance Coverage by Age in Glen Raven
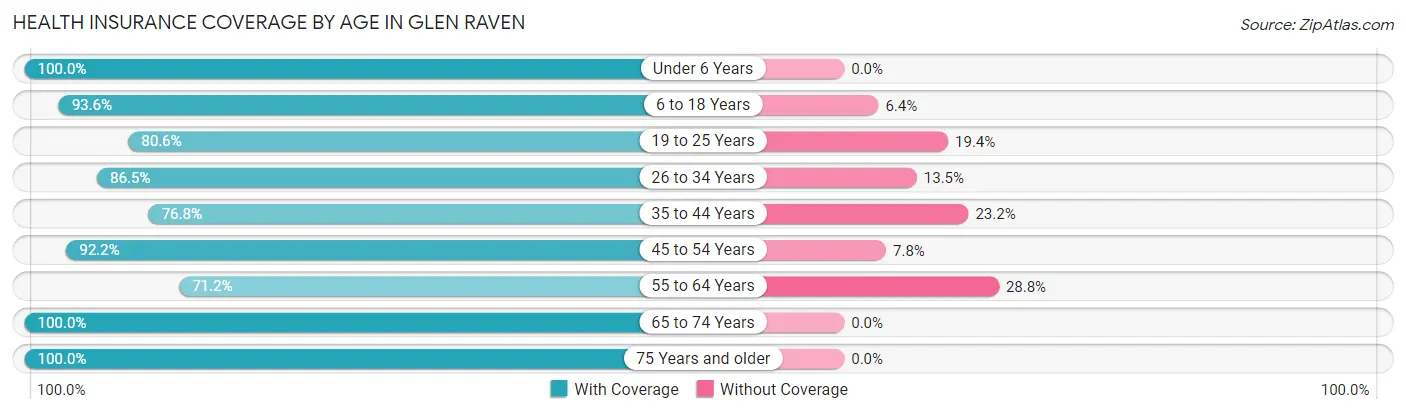
| Age Bracket | With Coverage | Without Coverage |
| Under 6 Years | 321 (100.0%) | 0 (0.0%) |
| 6 to 18 Years | 720 (93.6%) | 49 (6.4%) |
| 19 to 25 Years | 304 (80.6%) | 73 (19.4%) |
| 26 to 34 Years | 441 (86.5%) | 69 (13.5%) |
| 35 to 44 Years | 282 (76.8%) | 85 (23.2%) |
| 45 to 54 Years | 485 (92.2%) | 41 (7.8%) |
| 55 to 64 Years | 269 (71.2%) | 109 (28.8%) |
| 65 to 74 Years | 335 (100.0%) | 0 (0.0%) |
| 75 Years and older | 127 (100.0%) | 0 (0.0%) |
| Total | 3,284 (88.5%) | 426 (11.5%) |
Health Insurance Coverage by Citizenship Status in Glen Raven
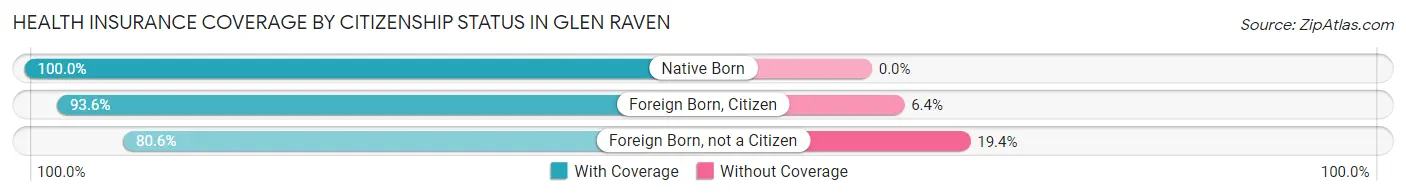
| Citizenship Status | With Coverage | Without Coverage |
| Native Born | 321 (100.0%) | 0 (0.0%) |
| Foreign Born, Citizen | 720 (93.6%) | 49 (6.4%) |
| Foreign Born, not a Citizen | 304 (80.6%) | 73 (19.4%) |
Health Insurance Coverage by Household Income in Glen Raven
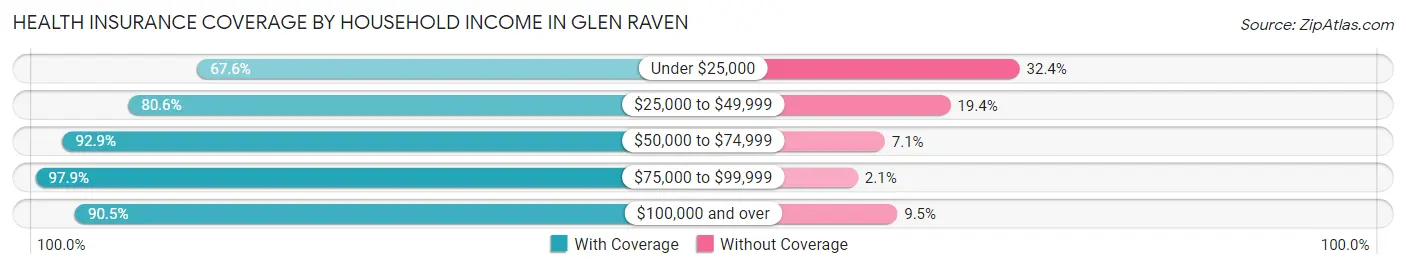
| Household Income | With Coverage | Without Coverage |
| Under $25,000 | 190 (67.6%) | 91 (32.4%) |
| $25,000 to $49,999 | 680 (80.6%) | 164 (19.4%) |
| $50,000 to $74,999 | 820 (92.9%) | 63 (7.1%) |
| $75,000 to $99,999 | 658 (97.9%) | 14 (2.1%) |
| $100,000 and over | 900 (90.5%) | 94 (9.5%) |
Public vs Private Health Insurance Coverage by Age in Glen Raven
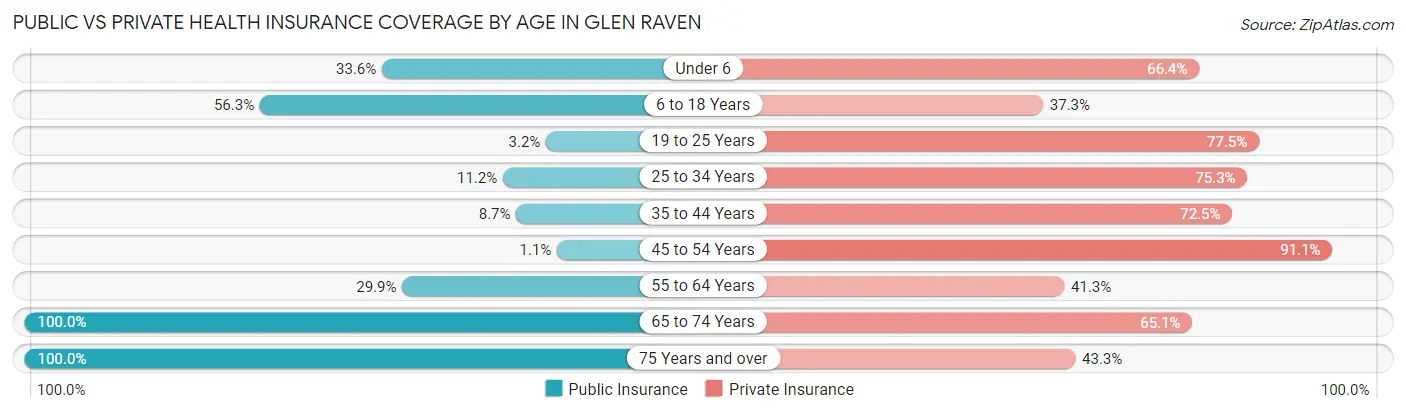
| Age Bracket | Public Insurance | Private Insurance |
| Under 6 | 108 (33.6%) | 213 (66.4%) |
| 6 to 18 Years | 433 (56.3%) | 287 (37.3%) |
| 19 to 25 Years | 12 (3.2%) | 292 (77.4%) |
| 25 to 34 Years | 57 (11.2%) | 384 (75.3%) |
| 35 to 44 Years | 32 (8.7%) | 266 (72.5%) |
| 45 to 54 Years | 6 (1.1%) | 479 (91.1%) |
| 55 to 64 Years | 113 (29.9%) | 156 (41.3%) |
| 65 to 74 Years | 335 (100.0%) | 218 (65.1%) |
| 75 Years and over | 127 (100.0%) | 55 (43.3%) |
| Total | 1,223 (33.0%) | 2,350 (63.3%) |
Disability Status by Sex by Age in Glen Raven
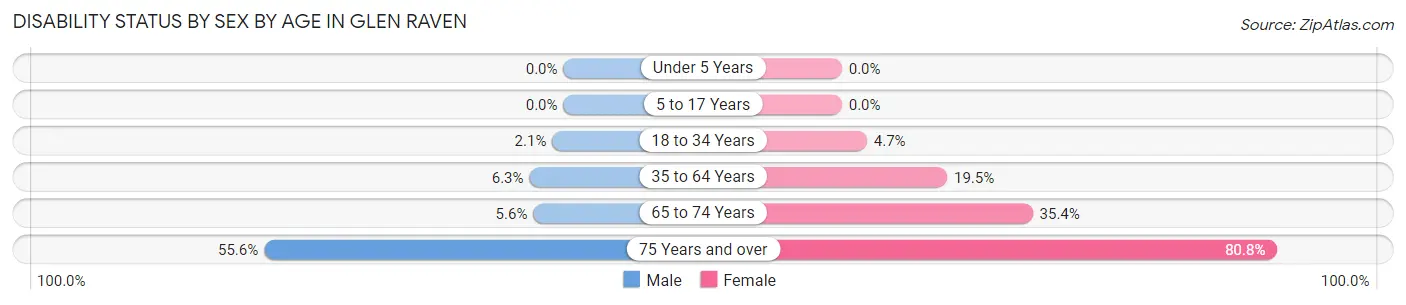
| Age Bracket | Male | Female |
| Under 5 Years | 0 (0.0%) | 0 (0.0%) |
| 5 to 17 Years | 0 (0.0%) | 0 (0.0%) |
| 18 to 34 Years | 9 (2.1%) | 24 (4.6%) |
| 35 to 64 Years | 45 (6.3%) | 109 (19.5%) |
| 65 to 74 Years | 8 (5.6%) | 68 (35.4%) |
| 75 Years and over | 30 (55.6%) | 59 (80.8%) |
Disability Class by Sex by Age in Glen Raven
Disability Class: Hearing Difficulty
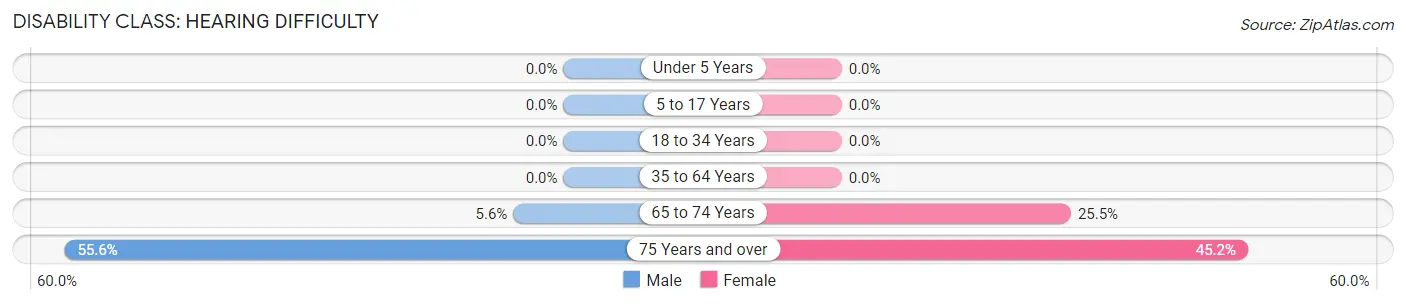
| Age Bracket | Male | Female |
| Under 5 Years | 0 (0.0%) | 0 (0.0%) |
| 5 to 17 Years | 0 (0.0%) | 0 (0.0%) |
| 18 to 34 Years | 0 (0.0%) | 0 (0.0%) |
| 35 to 64 Years | 0 (0.0%) | 0 (0.0%) |
| 65 to 74 Years | 8 (5.6%) | 49 (25.5%) |
| 75 Years and over | 30 (55.6%) | 33 (45.2%) |
Disability Class: Vision Difficulty
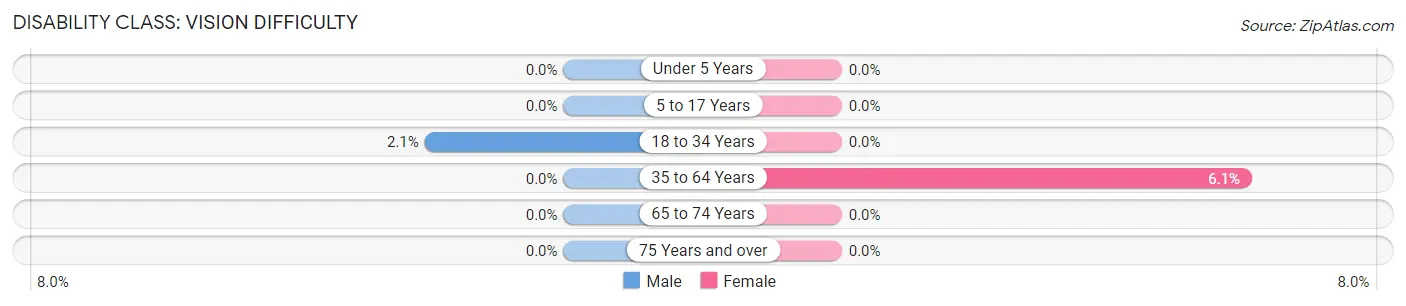
| Age Bracket | Male | Female |
| Under 5 Years | 0 (0.0%) | 0 (0.0%) |
| 5 to 17 Years | 0 (0.0%) | 0 (0.0%) |
| 18 to 34 Years | 9 (2.1%) | 0 (0.0%) |
| 35 to 64 Years | 0 (0.0%) | 34 (6.1%) |
| 65 to 74 Years | 0 (0.0%) | 0 (0.0%) |
| 75 Years and over | 0 (0.0%) | 0 (0.0%) |
Disability Class: Cognitive Difficulty
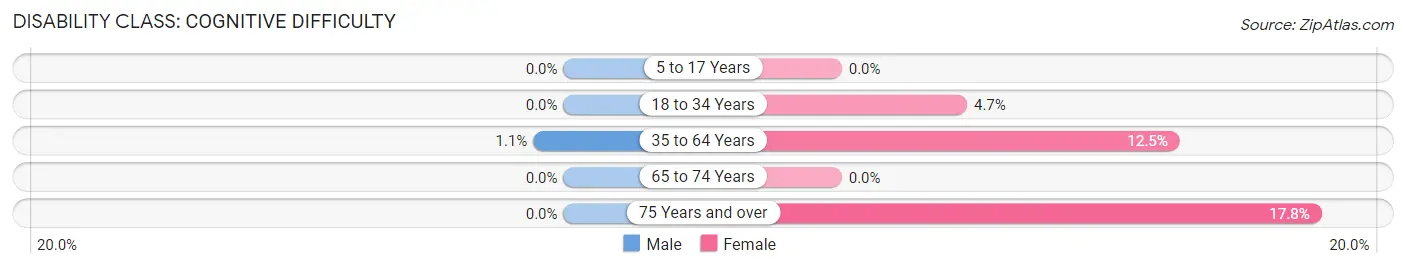
| Age Bracket | Male | Female |
| 5 to 17 Years | 0 (0.0%) | 0 (0.0%) |
| 18 to 34 Years | 0 (0.0%) | 24 (4.6%) |
| 35 to 64 Years | 8 (1.1%) | 70 (12.5%) |
| 65 to 74 Years | 0 (0.0%) | 0 (0.0%) |
| 75 Years and over | 0 (0.0%) | 13 (17.8%) |
Disability Class: Ambulatory Difficulty
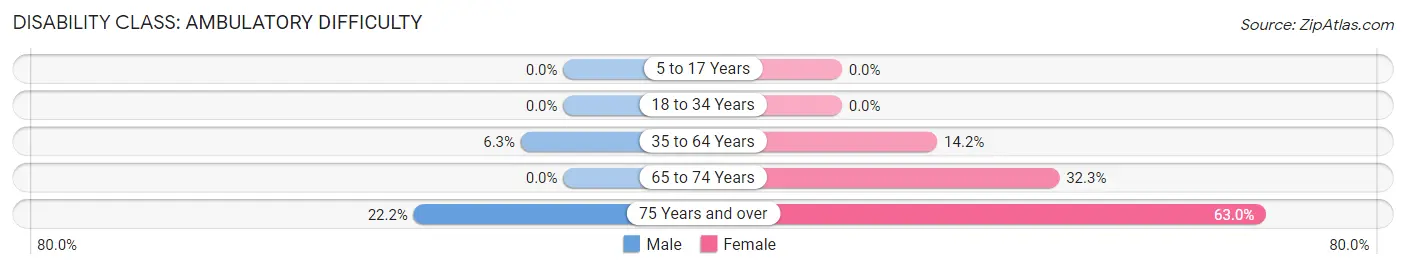
| Age Bracket | Male | Female |
| 5 to 17 Years | 0 (0.0%) | 0 (0.0%) |
| 18 to 34 Years | 0 (0.0%) | 0 (0.0%) |
| 35 to 64 Years | 45 (6.3%) | 79 (14.2%) |
| 65 to 74 Years | 0 (0.0%) | 62 (32.3%) |
| 75 Years and over | 12 (22.2%) | 46 (63.0%) |
Disability Class: Self-Care Difficulty
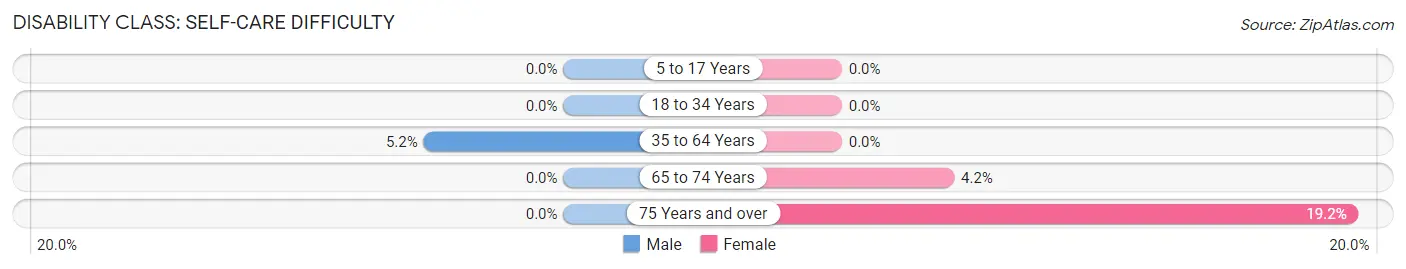
| Age Bracket | Male | Female |
| 5 to 17 Years | 0 (0.0%) | 0 (0.0%) |
| 18 to 34 Years | 0 (0.0%) | 0 (0.0%) |
| 35 to 64 Years | 37 (5.2%) | 0 (0.0%) |
| 65 to 74 Years | 0 (0.0%) | 8 (4.2%) |
| 75 Years and over | 0 (0.0%) | 14 (19.2%) |
Technology Access in Glen Raven
Computing Device Access in Glen Raven
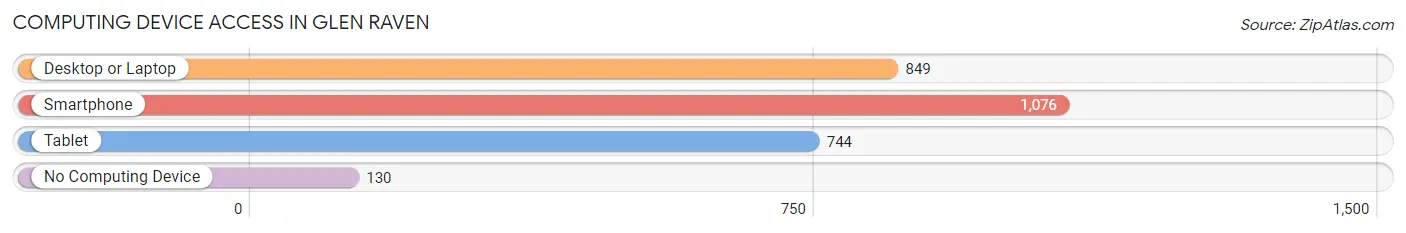
| Device Type | # Households | % Households |
| Desktop or Laptop | 849 | 68.0% |
| Smartphone | 1,076 | 86.2% |
| Tablet | 744 | 59.6% |
| No Computing Device | 130 | 10.4% |
| Total | 1,249 | 100.0% |
Internet Access in Glen Raven
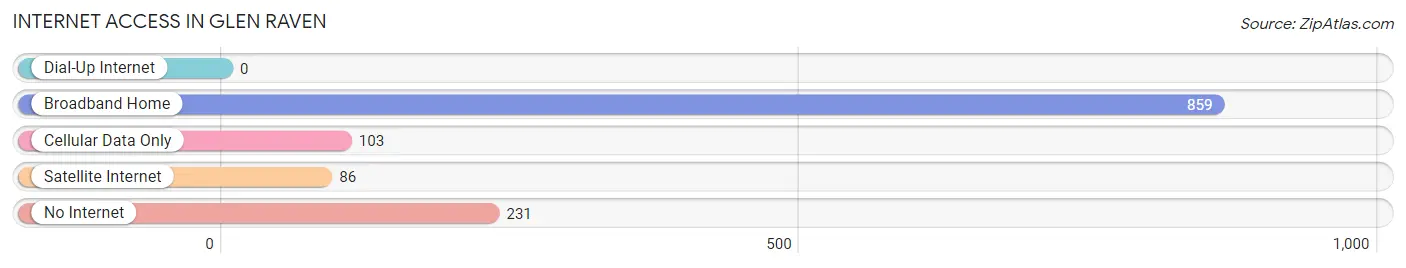
| Internet Type | # Households | % Households |
| Dial-Up Internet | 0 | 0.0% |
| Broadband Home | 859 | 68.8% |
| Cellular Data Only | 103 | 8.3% |
| Satellite Internet | 86 | 6.9% |
| No Internet | 231 | 18.5% |
| Total | 1,249 | 100.0% |
Glen Raven Summary
Glen Raven, North Carolina is a small town located in Alamance County, North Carolina. It is situated on the banks of the Haw River, and is part of the Burlington-Alamance Metropolitan Statistical Area. The town was founded in 1881 by John D. Holt, who named it after his daughter, Glen Raven Holt. The town has a population of approximately 2,000 people, and is known for its small-town charm and friendly atmosphere.
Geography
Glen Raven is located in the Piedmont region of North Carolina, and is situated on the banks of the Haw River. The town is located approximately 25 miles east of Greensboro, and is part of the Burlington-Alamance Metropolitan Statistical Area. The town is surrounded by rolling hills and farmland, and is home to several small lakes and streams. The climate in Glen Raven is mild, with temperatures ranging from the mid-50s in the winter to the mid-80s in the summer.
Economy
Glen Raven is home to several small businesses, including a grocery store, a hardware store, and a few restaurants. The town is also home to Glen Raven Technical Fabrics, a textile manufacturer that produces fabrics for a variety of industries, including automotive, outdoor, and medical. The company has been in operation since 1887, and is one of the largest employers in the area.
Demographics
As of the 2010 census, the population of Glen Raven was 2,000 people. The racial makeup of the town was 94.2% White, 2.2% African American, 0.7% Native American, 0.7% Asian, 0.2% Pacific Islander, and 1.9% from other races. The median household income in Glen Raven was $41,250, and the median age was 40.7 years.
Conclusion
Glen Raven, North Carolina is a small town located in Alamance County, North Carolina. It is situated on the banks of the Haw River, and is part of the Burlington-Alamance Metropolitan Statistical Area. The town has a population of approximately 2,000 people, and is known for its small-town charm and friendly atmosphere. The economy of Glen Raven is largely based on small businesses and the textile industry, and the town has a diverse population with a median household income of $41,250.
Common Questions
What is the Total Population of Glen Raven?
Total Population of Glen Raven is 3,710.
What is the Total Male Population of Glen Raven?
Total Male Population of Glen Raven is 1,798.
What is the Total Female Population of Glen Raven?
Total Female Population of Glen Raven is 1,912.
What is the Ratio of Males per 100 Females in Glen Raven?
There are 94.04 Males per 100 Females in Glen Raven.
What is the Ratio of Females per 100 Males in Glen Raven?
There are 106.34 Females per 100 Males in Glen Raven.
What is the Median Population Age in Glen Raven?
Median Population Age in Glen Raven is 32.0 Years.
What is the Average Family Size in Glen Raven
Average Family Size in Glen Raven is 3.5 People.
What is the Average Household Size in Glen Raven
Average Household Size in Glen Raven is 2.9 People.
What is Per Capita Income in Glen Raven?
Per Capita income in Glen Raven is $24,514.
What is the Median Family Income in Glen Raven?
Median Family Income in Glen Raven is $61,867.
What is the Median Household income in Glen Raven?
Median Household Income in Glen Raven is $57,639.
What is Income or Wage Gap in Glen Raven?
Income or Wage Gap in Glen Raven is 44.2%.
Women in Glen Raven earn 55.8 cents for every dollar earned by a man.
What is Family Income Deficit in Glen Raven?
Family Income Deficit in Glen Raven is $2,316.
Families that are below poverty line in Glen Raven earn $2,316 less on average than the poverty threshold level.
What is Inequality or Gini Index in Glen Raven?
Inequality or Gini Index in Glen Raven is 0.36.
How Large is the Labor Force in Glen Raven?
There are 1,847 People in the Labor Forcein in Glen Raven.
What is the Percentage of People in the Labor Force in Glen Raven?
65.0% of People are in the Labor Force in Glen Raven.
What is the Unemployment Rate in Glen Raven?
Unemployment Rate in Glen Raven is 3.7%.