East Gull Lake, MN
East Gull Lake Map
East Gull Lake Overview
1,027
TOTAL POPULATION
484
MALE POPULATION
543
FEMALE POPULATION
89.13
MALES / 100 FEMALES
112.19
FEMALES / 100 MALES
47.2
MEDIAN AGE
2.9
AVG FAMILY SIZE
2.6
AVG HOUSEHOLD SIZE
$51,309
PER CAPITA INCOME
$112,344
AVG FAMILY INCOME
$109,750
AVG HOUSEHOLD INCOME
42.0%
WAGE / INCOME GAP [ % ]
58.0¢/ $1
WAGE / INCOME GAP [ $ ]
0.41
INEQUALITY / GINI INDEX
525
LABOR FORCE [ PEOPLE ]
61.4%
PERCENT IN LABOR FORCE
2.9%
UNEMPLOYMENT RATE
East Gull Lake Area Codes
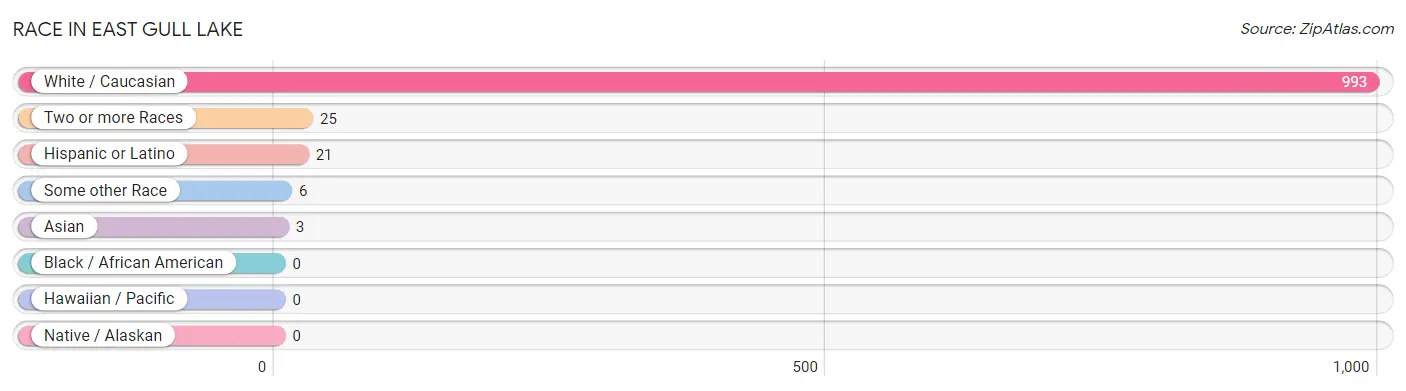
Race in East Gull Lake
The most populous races in East Gull Lake are White / Caucasian (993 | 96.7%), Two or more Races (25 | 2.4%), and Hispanic or Latino (21 | 2.0%).
| Race | # Population | % Population |
| Asian | 3 | 0.3% |
| Black / African American | 0 | 0.0% |
| Hawaiian / Pacific | 0 | 0.0% |
| Hispanic or Latino | 21 | 2.0% |
| Native / Alaskan | 0 | 0.0% |
| White / Caucasian | 993 | 96.7% |
| Two or more Races | 25 | 2.4% |
| Some other Race | 6 | 0.6% |
| Total | 1,027 | 100.0% |
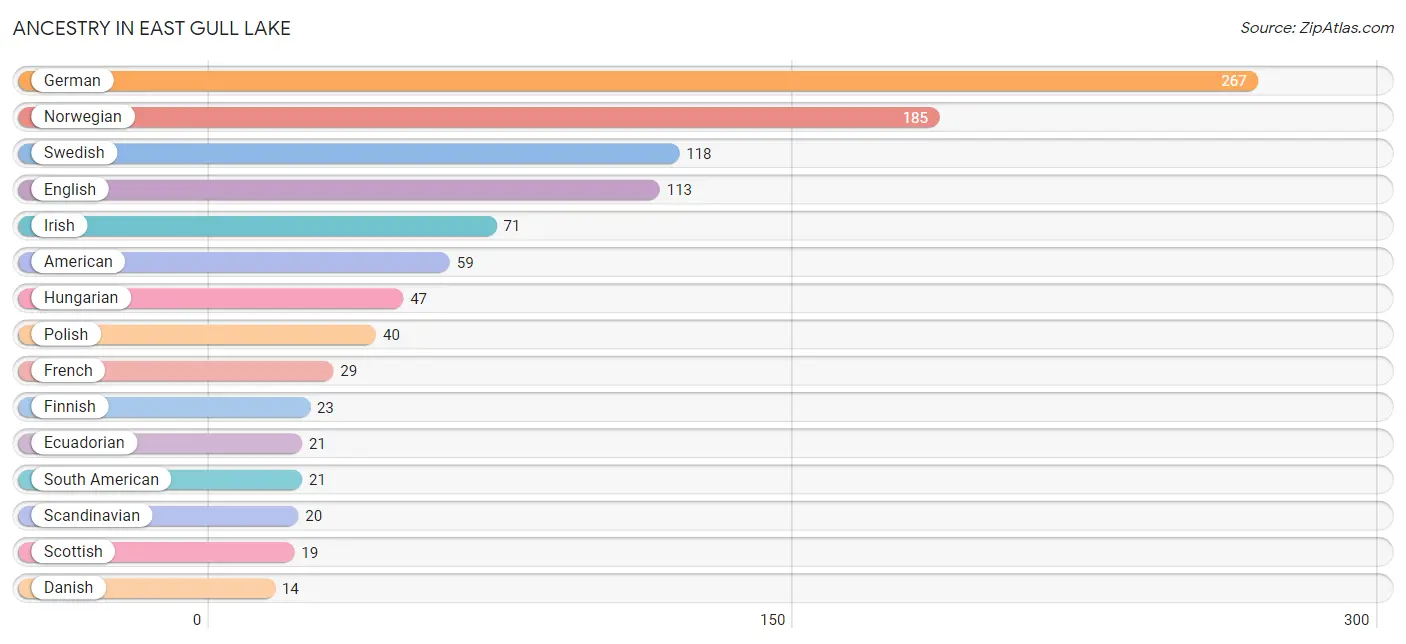
Ancestry in East Gull Lake
The most populous ancestries reported in East Gull Lake are German (267 | 26.0%), Norwegian (185 | 18.0%), Swedish (118 | 11.5%), English (113 | 11.0%), and Irish (71 | 6.9%), together accounting for 73.4% of all East Gull Lake residents.
| Ancestry | # Population | % Population |
| American | 59 | 5.7% |
| Belgian | 2 | 0.2% |
| Burmese | 3 | 0.3% |
| Czech | 9 | 0.9% |
| Czechoslovakian | 4 | 0.4% |
| Danish | 14 | 1.4% |
| Dutch | 2 | 0.2% |
| Ecuadorian | 21 | 2.0% |
| English | 113 | 11.0% |
| Finnish | 23 | 2.2% |
| French | 29 | 2.8% |
| German | 267 | 26.0% |
| Hungarian | 47 | 4.6% |
| Irish | 71 | 6.9% |
| Italian | 10 | 1.0% |
| Norwegian | 185 | 18.0% |
| Polish | 40 | 3.9% |
| Scandinavian | 20 | 1.9% |
| Scottish | 19 | 1.8% |
| Slovene | 10 | 1.0% |
| South American | 21 | 2.0% |
| Swedish | 118 | 11.5% |
| Swiss | 5 | 0.5% |
| Turkish | 12 | 1.2% |
| Ukrainian | 3 | 0.3% |
| Welsh | 3 | 0.3% | View All 26 Rows |
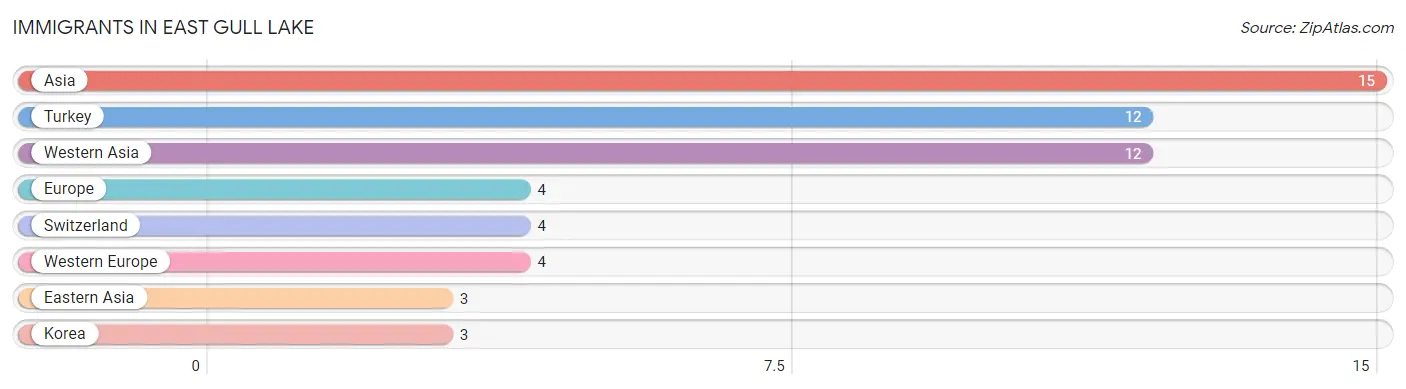
Immigrants in East Gull Lake
The most numerous immigrant groups reported in East Gull Lake came from Asia (15 | 1.5%), Turkey (12 | 1.2%), Western Asia (12 | 1.2%), Europe (4 | 0.4%), and Switzerland (4 | 0.4%), together accounting for 4.6% of all East Gull Lake residents.
| Immigration Origin | # Population | % Population |
| Asia | 15 | 1.5% |
| Eastern Asia | 3 | 0.3% |
| Europe | 4 | 0.4% |
| Korea | 3 | 0.3% |
| Switzerland | 4 | 0.4% |
| Turkey | 12 | 1.2% |
| Western Asia | 12 | 1.2% |
| Western Europe | 4 | 0.4% | View All 8 Rows |
Sex and Age in East Gull Lake
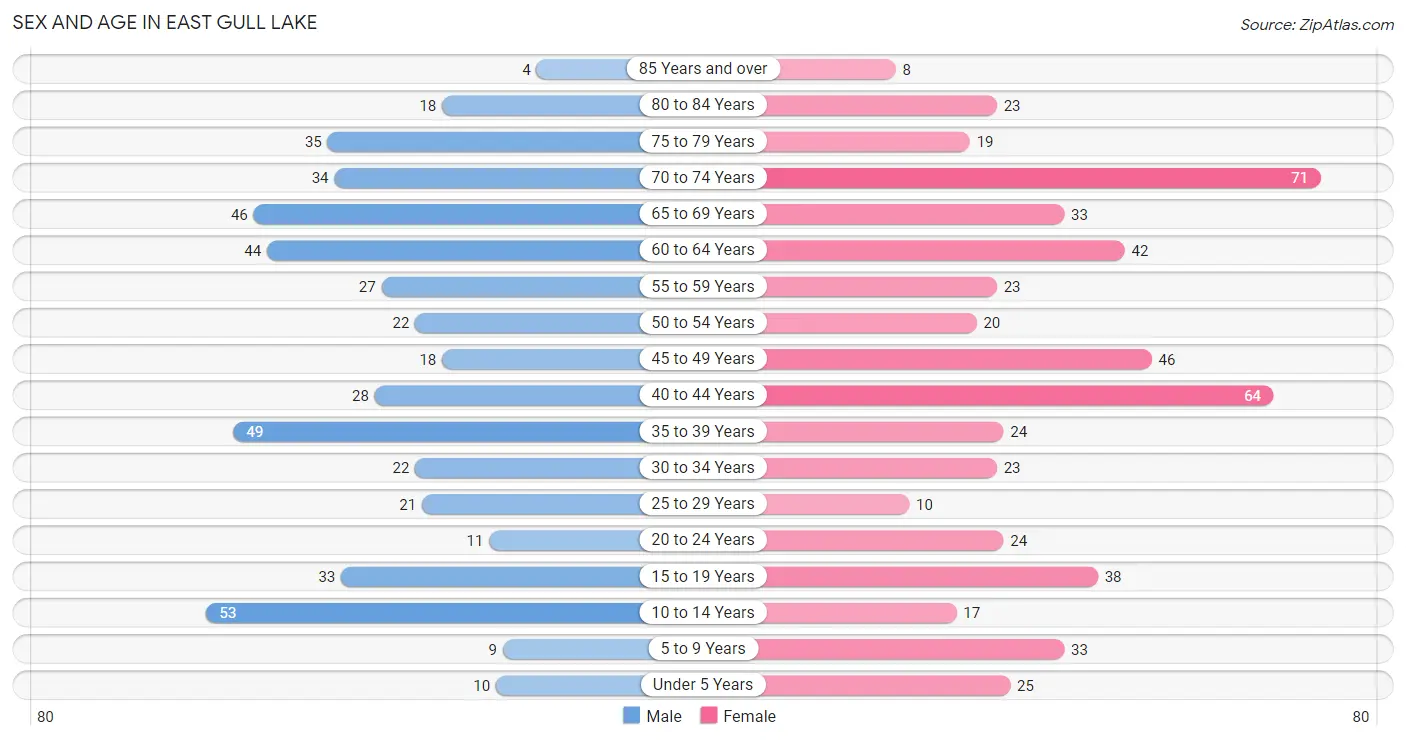
Sex and Age in East Gull Lake
The most populous age groups in East Gull Lake are 10 to 14 Years (53 | 11.0%) for men and 70 to 74 Years (71 | 13.1%) for women.
| Age Bracket | Male | Female |
| Under 5 Years | 10 (2.1%) | 25 (4.6%) |
| 5 to 9 Years | 9 (1.9%) | 33 (6.1%) |
| 10 to 14 Years | 53 (11.0%) | 17 (3.1%) |
| 15 to 19 Years | 33 (6.8%) | 38 (7.0%) |
| 20 to 24 Years | 11 (2.3%) | 24 (4.4%) |
| 25 to 29 Years | 21 (4.3%) | 10 (1.8%) |
| 30 to 34 Years | 22 (4.5%) | 23 (4.2%) |
| 35 to 39 Years | 49 (10.1%) | 24 (4.4%) |
| 40 to 44 Years | 28 (5.8%) | 64 (11.8%) |
| 45 to 49 Years | 18 (3.7%) | 46 (8.5%) |
| 50 to 54 Years | 22 (4.5%) | 20 (3.7%) |
| 55 to 59 Years | 27 (5.6%) | 23 (4.2%) |
| 60 to 64 Years | 44 (9.1%) | 42 (7.7%) |
| 65 to 69 Years | 46 (9.5%) | 33 (6.1%) |
| 70 to 74 Years | 34 (7.0%) | 71 (13.1%) |
| 75 to 79 Years | 35 (7.2%) | 19 (3.5%) |
| 80 to 84 Years | 18 (3.7%) | 23 (4.2%) |
| 85 Years and over | 4 (0.8%) | 8 (1.5%) |
| Total | 484 (100.0%) | 543 (100.0%) |
Families and Households in East Gull Lake
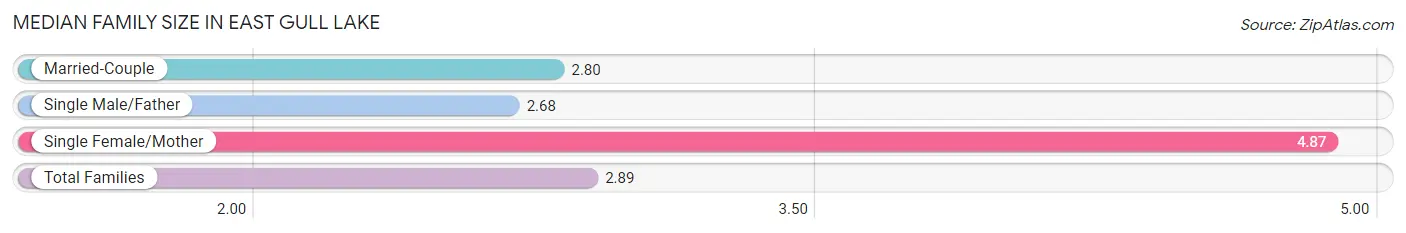
Median Family Size in East Gull Lake
The median family size in East Gull Lake is 2.89 persons per family, with single female/mother families (15 | 4.8%) accounting for the largest median family size of 4.87 persons per family. On the other hand, single male/father families (25 | 8.0%) represent the smallest median family size with 2.68 persons per family.
| Family Type | # Families | Family Size |
| Married-Couple | 273 (87.2%) | 2.80 |
| Single Male/Father | 25 (8.0%) | 2.68 |
| Single Female/Mother | 15 (4.8%) | 4.87 |
| Total Families | 313 (100.0%) | 2.89 |
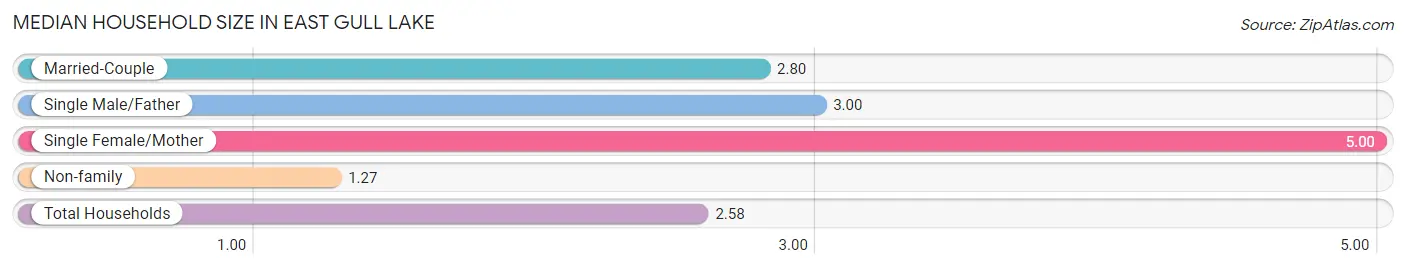
Median Household Size in East Gull Lake
The median household size in East Gull Lake is 2.58 persons per household, with single female/mother households (15 | 3.8%) accounting for the largest median household size of 5 persons per household. non-family households (82 | 20.8%) represent the smallest median household size with 1.27 persons per household.
| Household Type | # Households | Household Size |
| Married-Couple | 273 (69.1%) | 2.80 |
| Single Male/Father | 25 (6.3%) | 3.00 |
| Single Female/Mother | 15 (3.8%) | 5.00 |
| Non-family | 82 (20.8%) | 1.27 |
| Total Households | 395 (100.0%) | 2.58 |
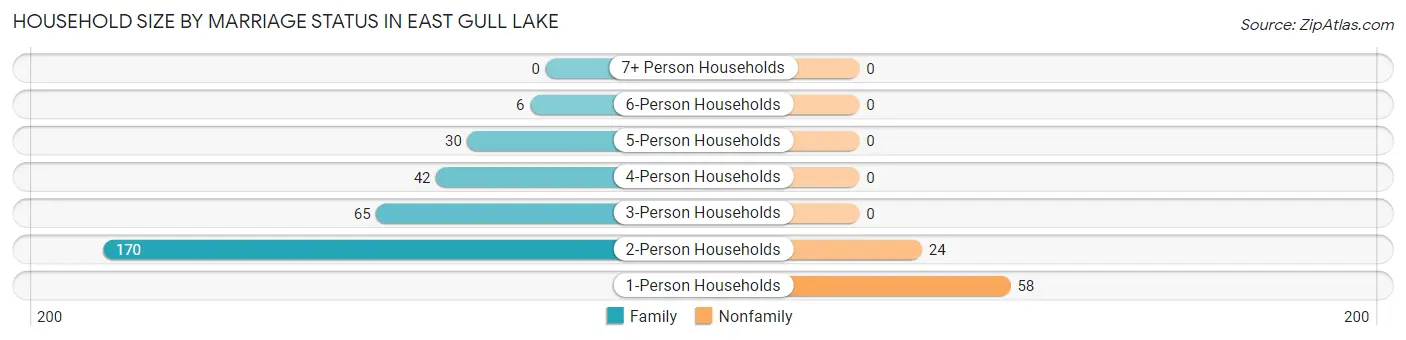
Household Size by Marriage Status in East Gull Lake
Out of a total of 395 households in East Gull Lake, 313 (79.2%) are family households, while 82 (20.8%) are nonfamily households. The most numerous type of family households are 2-person households, comprising 170, and the most common type of nonfamily households are 1-person households, comprising 58.
| Household Size | Family Households | Nonfamily Households |
| 1-Person Households | - | 58 (14.7%) |
| 2-Person Households | 170 (43.0%) | 24 (6.1%) |
| 3-Person Households | 65 (16.5%) | 0 (0.0%) |
| 4-Person Households | 42 (10.6%) | 0 (0.0%) |
| 5-Person Households | 30 (7.6%) | 0 (0.0%) |
| 6-Person Households | 6 (1.5%) | 0 (0.0%) |
| 7+ Person Households | 0 (0.0%) | 0 (0.0%) |
| Total | 313 (79.2%) | 82 (20.8%) |
Female Fertility in East Gull Lake
Fertility by Age in East Gull Lake
Average fertility rate in East Gull Lake is 21.0 births per 1,000 women. Women in the age bracket of 20 to 34 years have the highest fertility rate with 88.0 births per 1,000 women. Women in the age bracket of 20 to 34 years acount for 100.0% of all women with births.
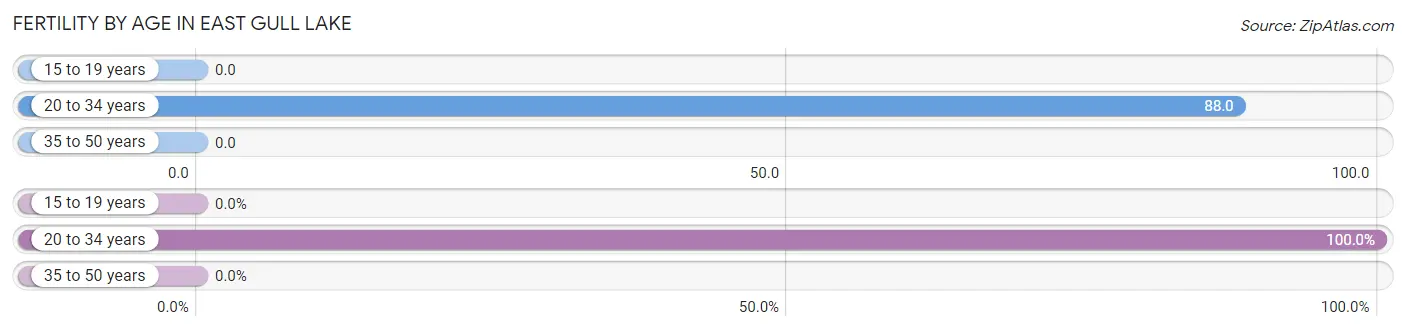
| Age Bracket | Women with Births | Births / 1,000 Women |
| 15 to 19 years | 0 (0.0%) | 0.0 |
| 20 to 34 years | 5 (100.0%) | 88.0 |
| 35 to 50 years | 0 (0.0%) | 0.0 |
| Total | 5 (100.0%) | 21.0 |
Fertility by Age by Marriage Status in East Gull Lake
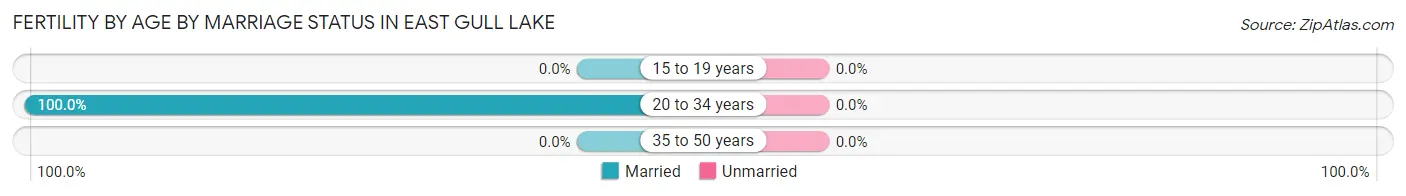
| Age Bracket | Married | Unmarried |
| 15 to 19 years | 0 (0.0%) | 0 (0.0%) |
| 20 to 34 years | 5 (100.0%) | 0 (0.0%) |
| 35 to 50 years | 0 (0.0%) | 0 (0.0%) |
| Total | 5 (100.0%) | 0 (0.0%) |
Fertility by Education in East Gull Lake
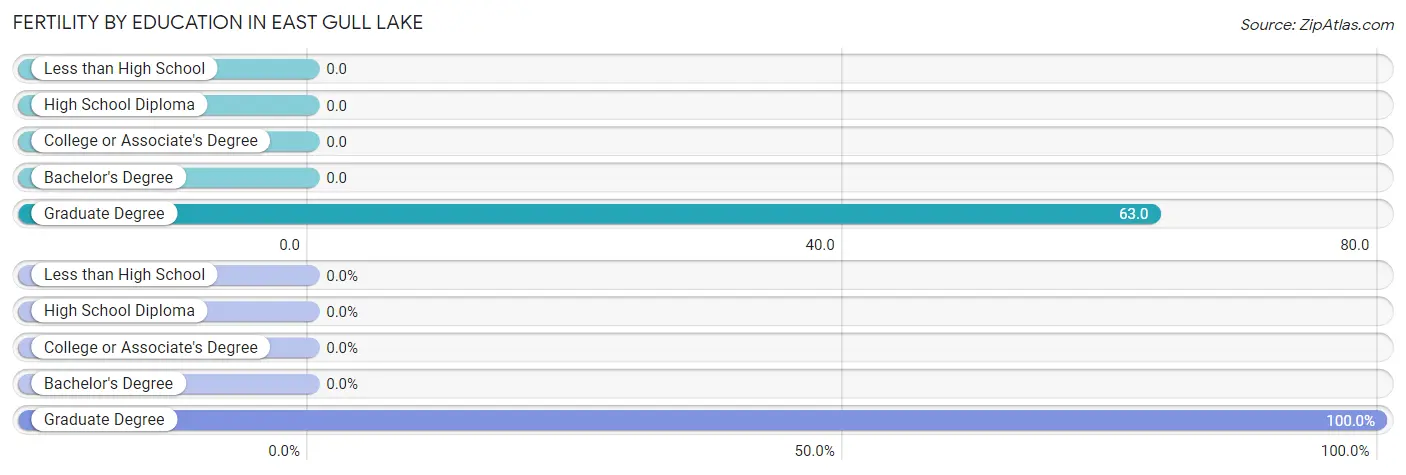
| Educational Attainment | Women with Births | Births / 1,000 Women |
| Less than High School | 0 (0.0%) | 0.0 |
| High School Diploma | 0 (0.0%) | 0.0 |
| College or Associate's Degree | 0 (0.0%) | 0.0 |
| Bachelor's Degree | 0 (0.0%) | 0.0 |
| Graduate Degree | 5 (100.0%) | 63.0 |
| Total | 5 (100.0%) | 21.0 |
Fertility by Education by Marriage Status in East Gull Lake
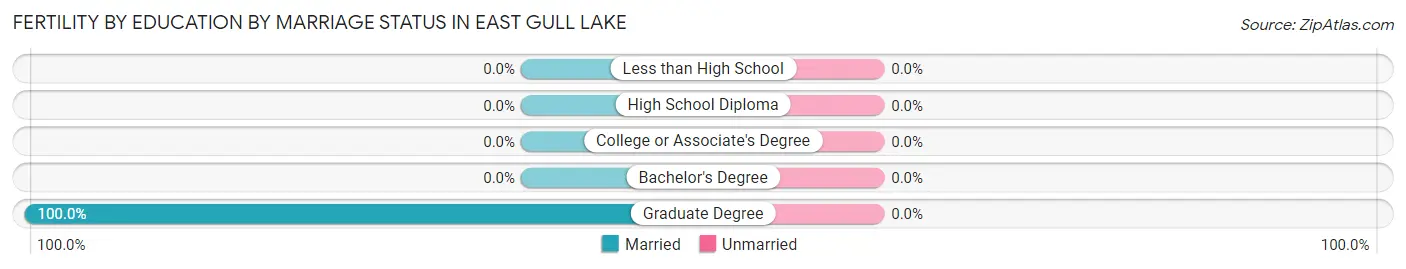
| Educational Attainment | Married | Unmarried |
| Less than High School | 0 (0.0%) | 0 (0.0%) |
| High School Diploma | 0 (0.0%) | 0 (0.0%) |
| College or Associate's Degree | 0 (0.0%) | 0 (0.0%) |
| Bachelor's Degree | 0 (0.0%) | 0 (0.0%) |
| Graduate Degree | 5 (100.0%) | 0 (0.0%) |
| Total | 5 (100.0%) | 0 (0.0%) |
Income in East Gull Lake
Income Overview in East Gull Lake
Per Capita Income in East Gull Lake is $51,309, while median incomes of families and households are $112,344 and $109,750 respectively.
| Characteristic | Number | Measure |
| Per Capita Income | 1,027 | $51,309 |
| Median Family Income | 313 | $112,344 |
| Mean Family Income | 313 | $142,969 |
| Median Household Income | 395 | $109,750 |
| Mean Household Income | 395 | $131,547 |
| Income Deficit | 313 | $0 |
| Wage / Income Gap (%) | 1,027 | 41.99% |
| Wage / Income Gap ($) | 1,027 | 58.01¢ per $1 |
| Gini / Inequality Index | 1,027 | 0.41 |
Earnings by Sex in East Gull Lake
Average Earnings in East Gull Lake are $50,250, $62,083 for men and $36,016 for women, a difference of 42.0%.
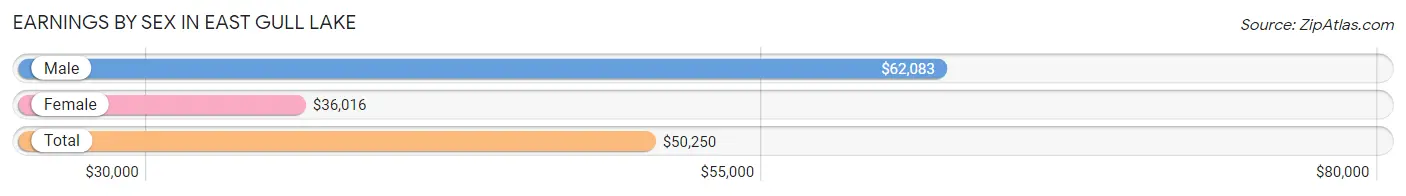
| Sex | Number | Average Earnings |
| Male | 263 (48.0%) | $62,083 |
| Female | 285 (52.0%) | $36,016 |
| Total | 548 (100.0%) | $50,250 |
Earnings by Sex by Income Bracket in East Gull Lake
The most common earnings brackets in East Gull Lake are $100,000+ for men (60 | 22.8%) and $20,000 to $22,499 for women (43 | 15.1%).
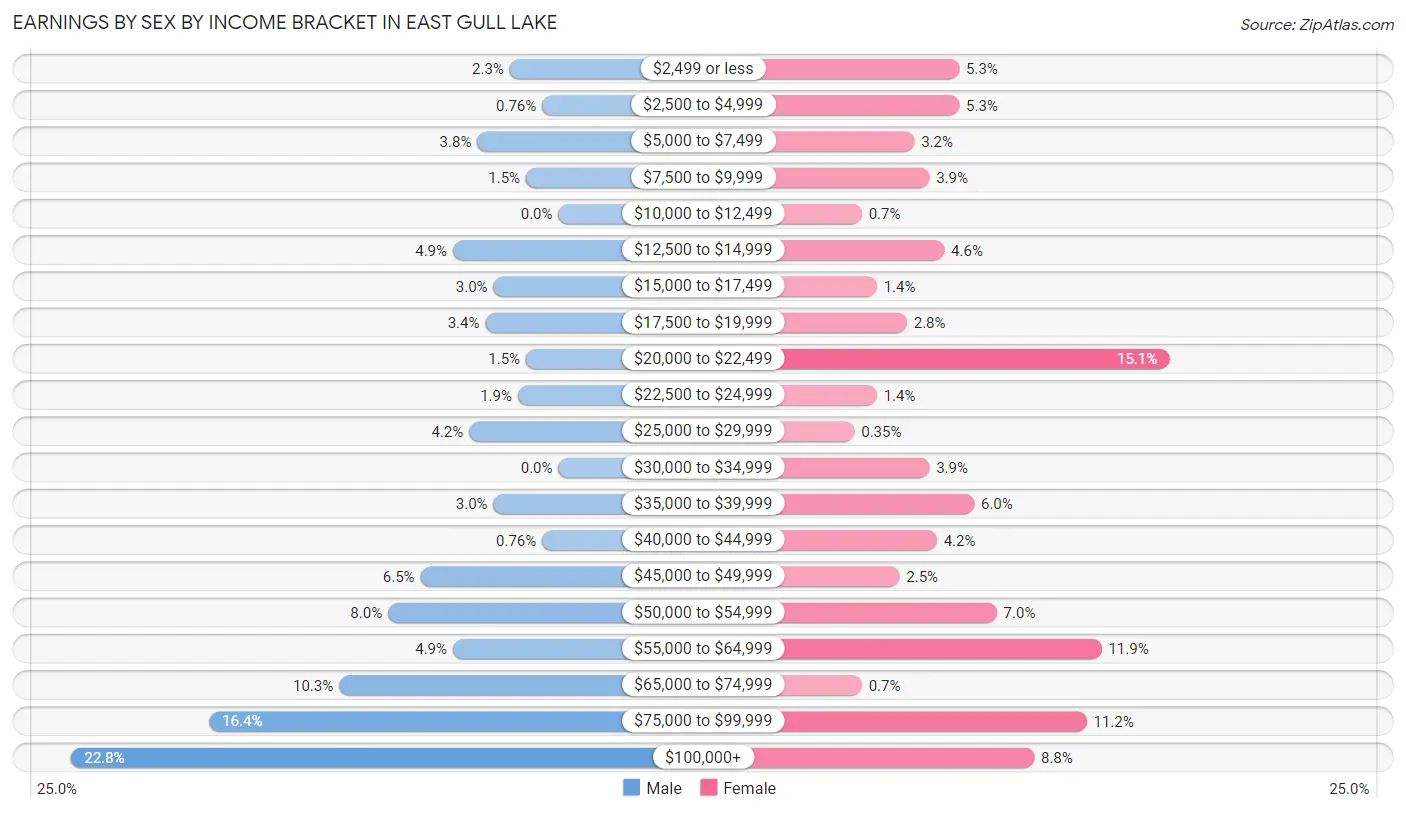
| Income | Male | Female |
| $2,499 or less | 6 (2.3%) | 15 (5.3%) |
| $2,500 to $4,999 | 2 (0.8%) | 15 (5.3%) |
| $5,000 to $7,499 | 10 (3.8%) | 9 (3.2%) |
| $7,500 to $9,999 | 4 (1.5%) | 11 (3.9%) |
| $10,000 to $12,499 | 0 (0.0%) | 2 (0.7%) |
| $12,500 to $14,999 | 13 (4.9%) | 13 (4.6%) |
| $15,000 to $17,499 | 8 (3.0%) | 4 (1.4%) |
| $17,500 to $19,999 | 9 (3.4%) | 8 (2.8%) |
| $20,000 to $22,499 | 4 (1.5%) | 43 (15.1%) |
| $22,500 to $24,999 | 5 (1.9%) | 4 (1.4%) |
| $25,000 to $29,999 | 11 (4.2%) | 1 (0.4%) |
| $30,000 to $34,999 | 0 (0.0%) | 11 (3.9%) |
| $35,000 to $39,999 | 8 (3.0%) | 17 (6.0%) |
| $40,000 to $44,999 | 2 (0.8%) | 12 (4.2%) |
| $45,000 to $49,999 | 17 (6.5%) | 7 (2.5%) |
| $50,000 to $54,999 | 21 (8.0%) | 20 (7.0%) |
| $55,000 to $64,999 | 13 (4.9%) | 34 (11.9%) |
| $65,000 to $74,999 | 27 (10.3%) | 2 (0.7%) |
| $75,000 to $99,999 | 43 (16.4%) | 32 (11.2%) |
| $100,000+ | 60 (22.8%) | 25 (8.8%) |
| Total | 263 (100.0%) | 285 (100.0%) |
Earnings by Sex by Educational Attainment in East Gull Lake
Average earnings in East Gull Lake are $72,596 for men and $44,167 for women, a difference of 39.2%. Men with an educational attainment of graduate degree enjoy the highest average annual earnings of $89,250, while those with high school diploma education earn the least with $53,636. Women with an educational attainment of bachelor's degree earn the most with the average annual earnings of $56,176, while those with high school diploma education have the smallest earnings of $34,583.
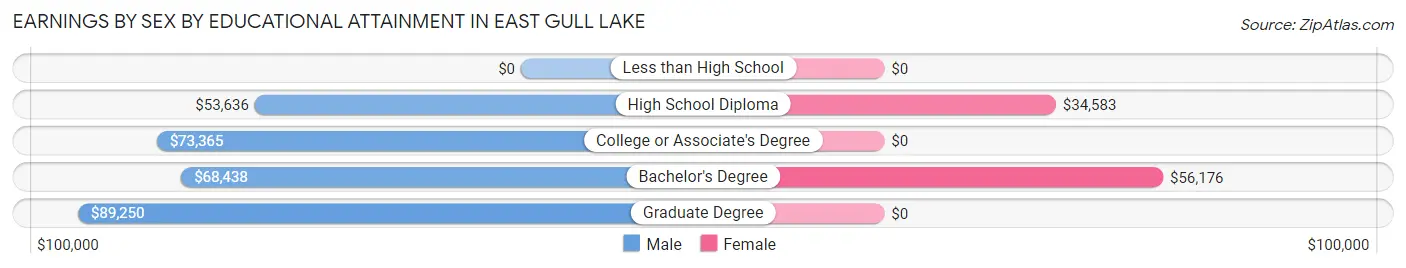
| Educational Attainment | Male Income | Female Income |
| Less than High School | - | - |
| High School Diploma | $53,636 | $34,583 |
| College or Associate's Degree | $73,365 | $0 |
| Bachelor's Degree | $68,438 | $56,176 |
| Graduate Degree | $89,250 | $0 |
| Total | $72,596 | $44,167 |
Family Income in East Gull Lake
Family Income Brackets in East Gull Lake
According to the East Gull Lake family income data, there are 84 families falling into the $100,000 to $149,999 income range, which is the most common income bracket and makes up 26.8% of all families.
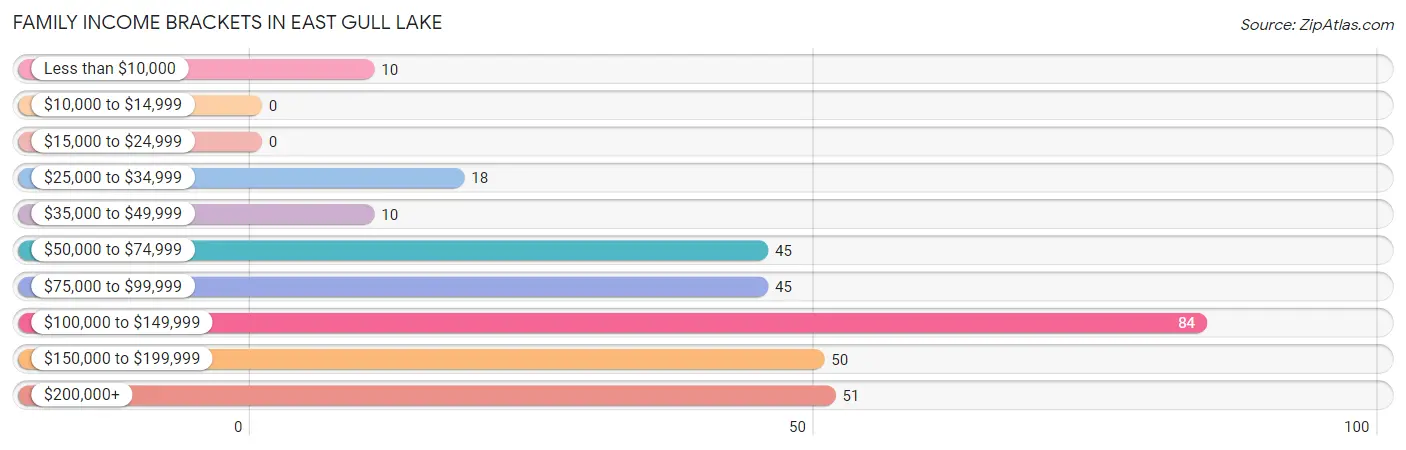
| Income Bracket | # Families | % Families |
| Less than $10,000 | 10 | 3.2% |
| $10,000 to $14,999 | 0 | 0.0% |
| $15,000 to $24,999 | 0 | 0.0% |
| $25,000 to $34,999 | 18 | 5.8% |
| $35,000 to $49,999 | 10 | 3.2% |
| $50,000 to $74,999 | 45 | 14.4% |
| $75,000 to $99,999 | 45 | 14.4% |
| $100,000 to $149,999 | 84 | 26.8% |
| $150,000 to $199,999 | 50 | 16.0% |
| $200,000+ | 51 | 16.3% |
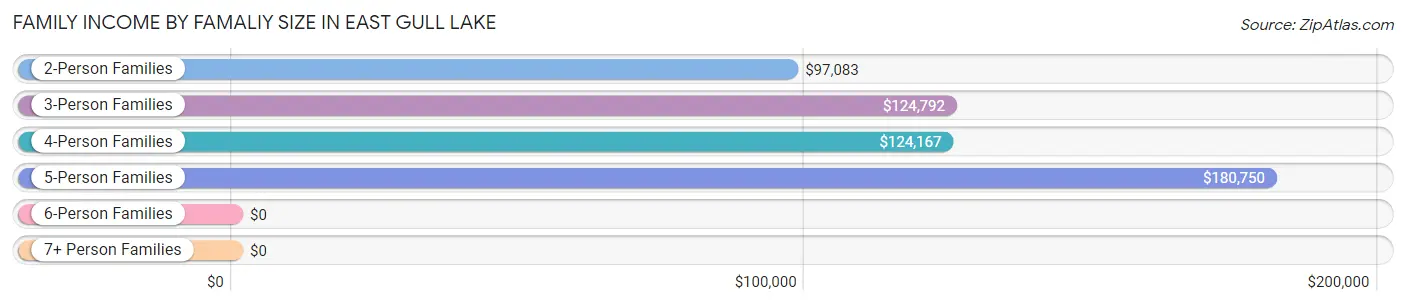
Family Income by Famaliy Size in East Gull Lake
5-person families (28 | 8.9%) account for the highest median family income in East Gull Lake with $180,750 per family, while 2-person families (170 | 54.3%) have the highest median income of $48,542 per family member.
| Income Bracket | # Families | Median Income |
| 2-Person Families | 170 (54.3%) | $97,083 |
| 3-Person Families | 69 (22.0%) | $124,792 |
| 4-Person Families | 42 (13.4%) | $124,167 |
| 5-Person Families | 28 (8.9%) | $180,750 |
| 6-Person Families | 4 (1.3%) | $0 |
| 7+ Person Families | 0 (0.0%) | $0 |
| Total | 313 (100.0%) | $112,344 |
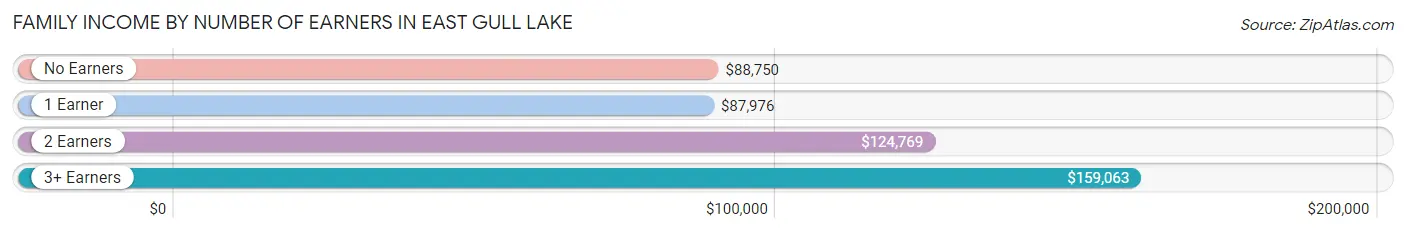
Family Income by Number of Earners in East Gull Lake
The median family income in East Gull Lake is $112,344, with families comprising 3+ earners (32) having the highest median family income of $159,063, while families with 1 earner (70) have the lowest median family income of $87,976, accounting for 10.2% and 22.4% of families, respectively.
| Number of Earners | # Families | Median Income |
| No Earners | 86 (27.5%) | $88,750 |
| 1 Earner | 70 (22.4%) | $87,976 |
| 2 Earners | 125 (39.9%) | $124,769 |
| 3+ Earners | 32 (10.2%) | $159,063 |
| Total | 313 (100.0%) | $112,344 |
Household Income in East Gull Lake
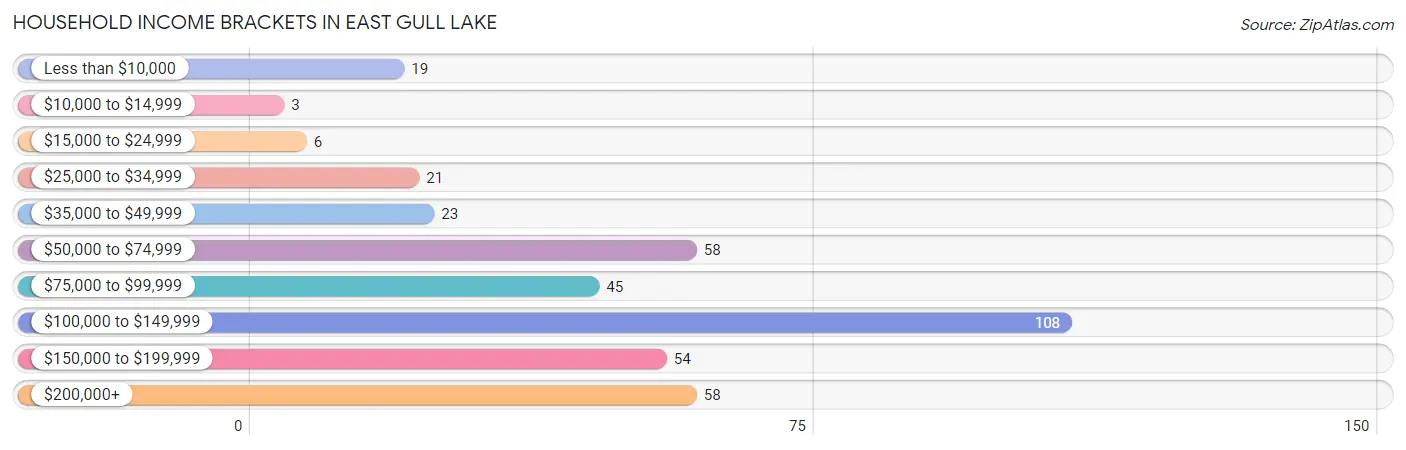
Household Income Brackets in East Gull Lake
With 108 households falling in the category, the $100,000 to $149,999 income range is the most frequent in East Gull Lake, accounting for 27.3% of all households. In contrast, only 3 households (0.8%) fall into the $10,000 to $14,999 income bracket, making it the least populous group.
| Income Bracket | # Households | % Households |
| Less than $10,000 | 19 | 4.8% |
| $10,000 to $14,999 | 3 | 0.8% |
| $15,000 to $24,999 | 6 | 1.5% |
| $25,000 to $34,999 | 21 | 5.3% |
| $35,000 to $49,999 | 23 | 5.8% |
| $50,000 to $74,999 | 58 | 14.7% |
| $75,000 to $99,999 | 45 | 11.4% |
| $100,000 to $149,999 | 108 | 27.3% |
| $150,000 to $199,999 | 54 | 13.7% |
| $200,000+ | 58 | 14.7% |
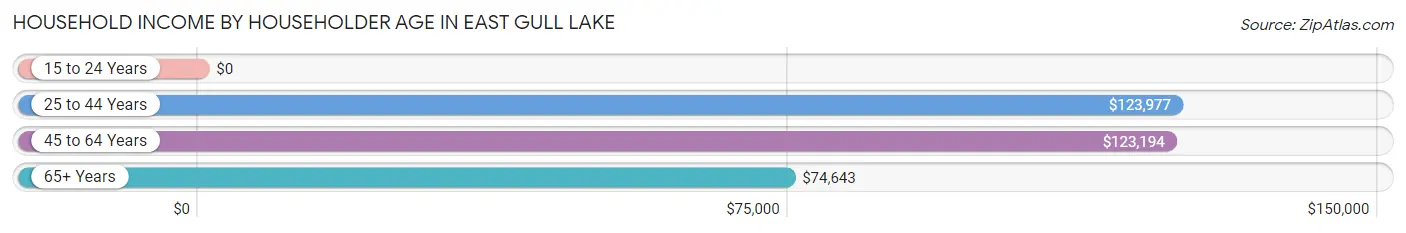
Household Income by Householder Age in East Gull Lake
The median household income in East Gull Lake is $109,750, with the highest median household income of $123,977 found in the 25 to 44 years age bracket for the primary householder. A total of 98 households (24.8%) fall into this category.
| Income Bracket | # Households | Median Income |
| 15 to 24 Years | 0 (0.0%) | $0 |
| 25 to 44 Years | 98 (24.8%) | $123,977 |
| 45 to 64 Years | 141 (35.7%) | $123,194 |
| 65+ Years | 156 (39.5%) | $74,643 |
| Total | 395 (100.0%) | $109,750 |
Poverty in East Gull Lake
Income Below Poverty by Sex and Age in East Gull Lake
With 3.1% poverty level for males and 4.4% for females among the residents of East Gull Lake, 55 to 64 year old males and 55 to 64 year old females are the most vulnerable to poverty, with 9 males (12.7%) and 14 females (21.5%) in their respective age groups living below the poverty level.
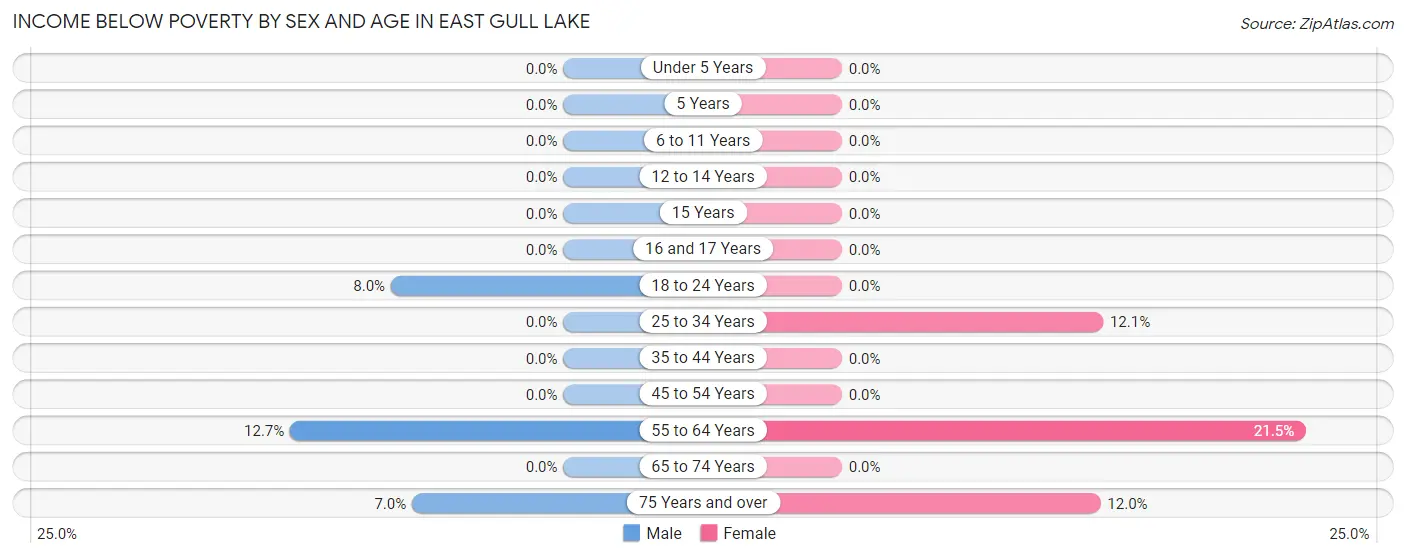
| Age Bracket | Male | Female |
| Under 5 Years | 0 (0.0%) | 0 (0.0%) |
| 5 Years | 0 (0.0%) | 0 (0.0%) |
| 6 to 11 Years | 0 (0.0%) | 0 (0.0%) |
| 12 to 14 Years | 0 (0.0%) | 0 (0.0%) |
| 15 Years | 0 (0.0%) | 0 (0.0%) |
| 16 and 17 Years | 0 (0.0%) | 0 (0.0%) |
| 18 to 24 Years | 2 (8.0%) | 0 (0.0%) |
| 25 to 34 Years | 0 (0.0%) | 4 (12.1%) |
| 35 to 44 Years | 0 (0.0%) | 0 (0.0%) |
| 45 to 54 Years | 0 (0.0%) | 0 (0.0%) |
| 55 to 64 Years | 9 (12.7%) | 14 (21.5%) |
| 65 to 74 Years | 0 (0.0%) | 0 (0.0%) |
| 75 Years and over | 4 (7.0%) | 6 (12.0%) |
| Total | 15 (3.1%) | 24 (4.4%) |
Income Above Poverty by Sex and Age in East Gull Lake
According to the poverty statistics in East Gull Lake, males aged under 5 years and females aged under 5 years are the age groups that are most secure financially, with 100.0% of males and 100.0% of females in these age groups living above the poverty line.
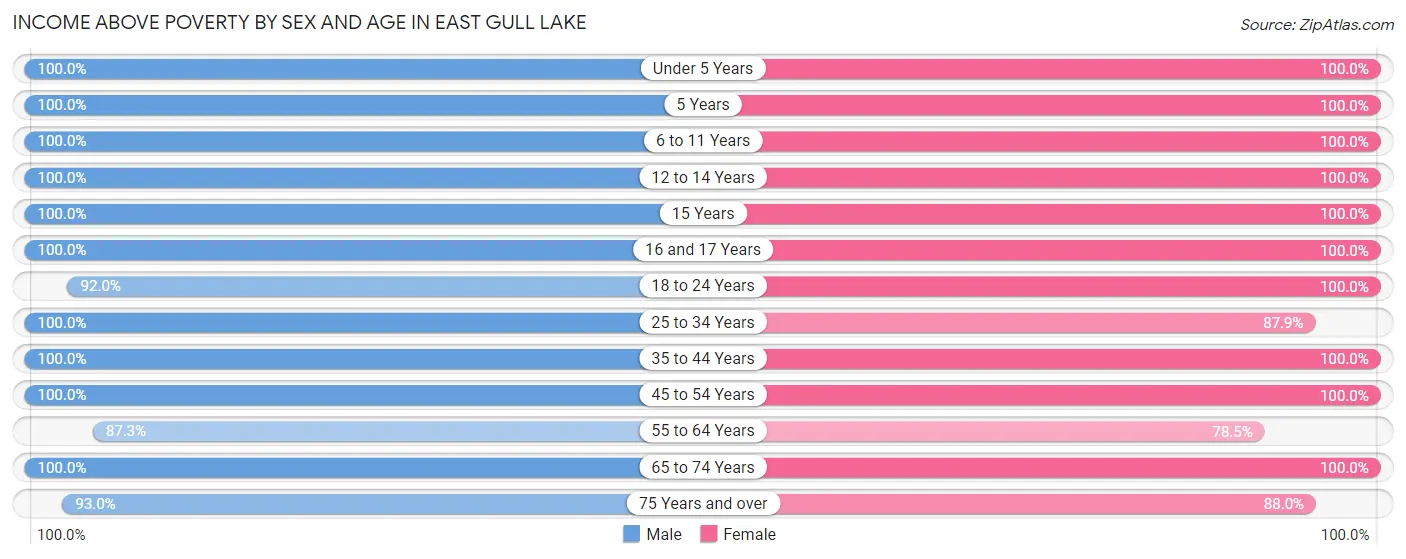
| Age Bracket | Male | Female |
| Under 5 Years | 10 (100.0%) | 25 (100.0%) |
| 5 Years | 3 (100.0%) | 4 (100.0%) |
| 6 to 11 Years | 26 (100.0%) | 32 (100.0%) |
| 12 to 14 Years | 33 (100.0%) | 10 (100.0%) |
| 15 Years | 12 (100.0%) | 13 (100.0%) |
| 16 and 17 Years | 7 (100.0%) | 22 (100.0%) |
| 18 to 24 Years | 23 (92.0%) | 27 (100.0%) |
| 25 to 34 Years | 43 (100.0%) | 29 (87.9%) |
| 35 to 44 Years | 77 (100.0%) | 88 (100.0%) |
| 45 to 54 Years | 40 (100.0%) | 66 (100.0%) |
| 55 to 64 Years | 62 (87.3%) | 51 (78.5%) |
| 65 to 74 Years | 80 (100.0%) | 104 (100.0%) |
| 75 Years and over | 53 (93.0%) | 44 (88.0%) |
| Total | 469 (96.9%) | 515 (95.6%) |
Income Below Poverty Among Married-Couple Families in East Gull Lake
The poverty statistics for married-couple families in East Gull Lake show that 3.7% or 10 of the total 273 families live below the poverty line. Families with no children have the highest poverty rate of 5.5%, comprising of 10 families. On the other hand, families with 1 or 2 children have the lowest poverty rate of 0.0%, which includes 0 families.
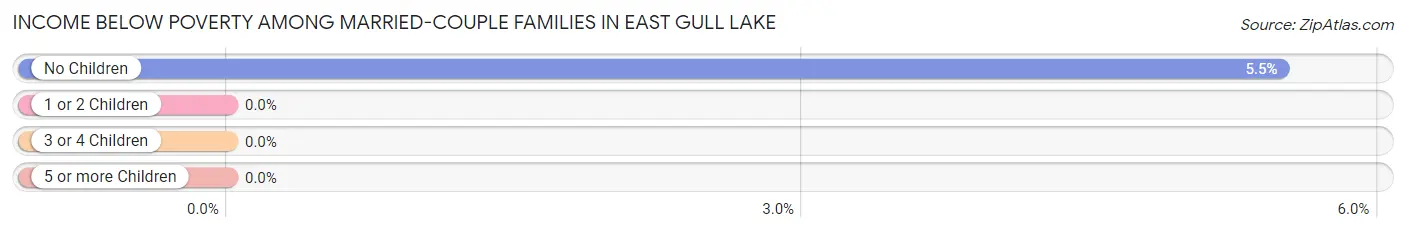
| Children | Above Poverty | Below Poverty |
| No Children | 172 (94.5%) | 10 (5.5%) |
| 1 or 2 Children | 70 (100.0%) | 0 (0.0%) |
| 3 or 4 Children | 21 (100.0%) | 0 (0.0%) |
| 5 or more Children | 0 (0.0%) | 0 (0.0%) |
| Total | 263 (96.3%) | 10 (3.7%) |
Income Below Poverty Among Single-Parent Households in East Gull Lake
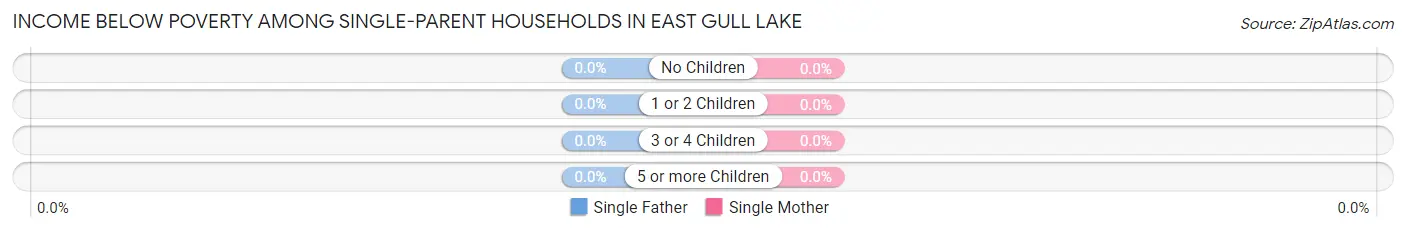
| Children | Single Father | Single Mother |
| No Children | 0 (0.0%) | 0 (0.0%) |
| 1 or 2 Children | 0 (0.0%) | 0 (0.0%) |
| 3 or 4 Children | 0 (0.0%) | 0 (0.0%) |
| 5 or more Children | 0 (0.0%) | 0 (0.0%) |
| Total | 0 (0.0%) | 0 (0.0%) |
Income Below Poverty Among Married-Couple vs Single-Parent Households in East Gull Lake
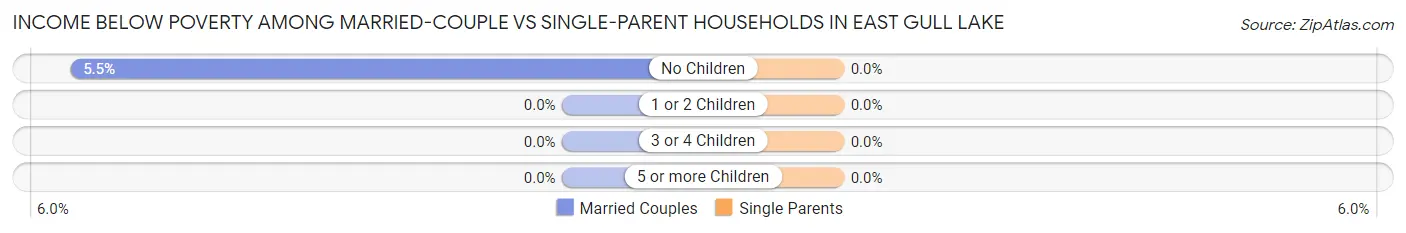
| Children | Married-Couple Families | Single-Parent Households |
| No Children | 10 (5.5%) | 0 (0.0%) |
| 1 or 2 Children | 0 (0.0%) | 0 (0.0%) |
| 3 or 4 Children | 0 (0.0%) | 0 (0.0%) |
| 5 or more Children | 0 (0.0%) | 0 (0.0%) |
| Total | 10 (3.7%) | 0 (0.0%) |
Employment Characteristics in East Gull Lake
Employment by Class of Employer in East Gull Lake
Among the 510 employed individuals in East Gull Lake, private company employees (254 | 49.8%), local government employees (89 | 17.4%), and self-employed (incorporated) (76 | 14.9%) make up the most common classes of employment.
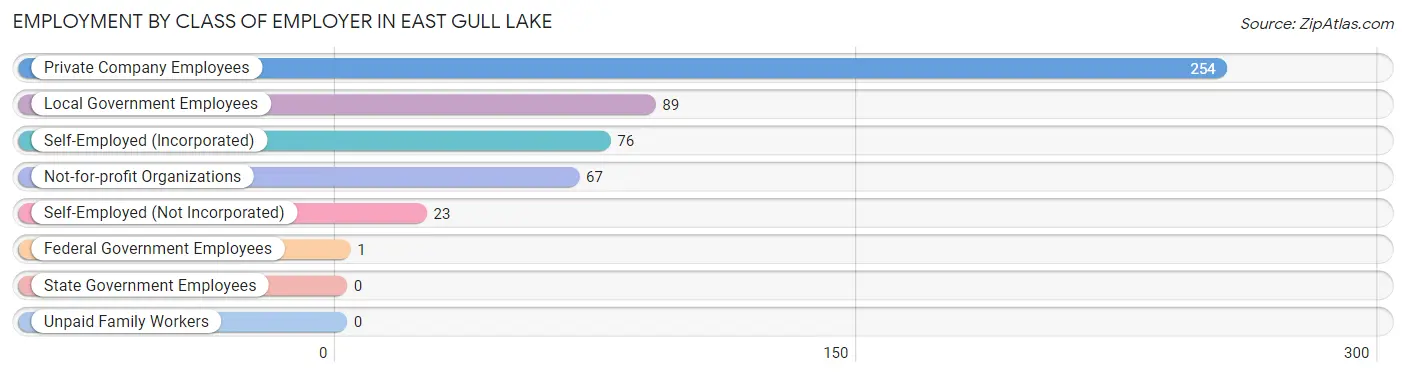
| Employer Class | # Employees | % Employees |
| Private Company Employees | 254 | 49.8% |
| Self-Employed (Incorporated) | 76 | 14.9% |
| Self-Employed (Not Incorporated) | 23 | 4.5% |
| Not-for-profit Organizations | 67 | 13.1% |
| Local Government Employees | 89 | 17.4% |
| State Government Employees | 0 | 0.0% |
| Federal Government Employees | 1 | 0.2% |
| Unpaid Family Workers | 0 | 0.0% |
| Total | 510 | 100.0% |
Employment Status by Age in East Gull Lake
According to the labor force statistics for East Gull Lake, out of the total population over 16 years of age (855), 61.4% or 525 individuals are in the labor force, with 2.9% or 15 of them unemployed. The age group with the highest labor force participation rate is 25 to 29 years, with 100.0% or 31 individuals in the labor force. Within the labor force, the 35 to 44 years age range has the highest percentage of unemployed individuals, with 6.7% or 11 of them being unemployed.
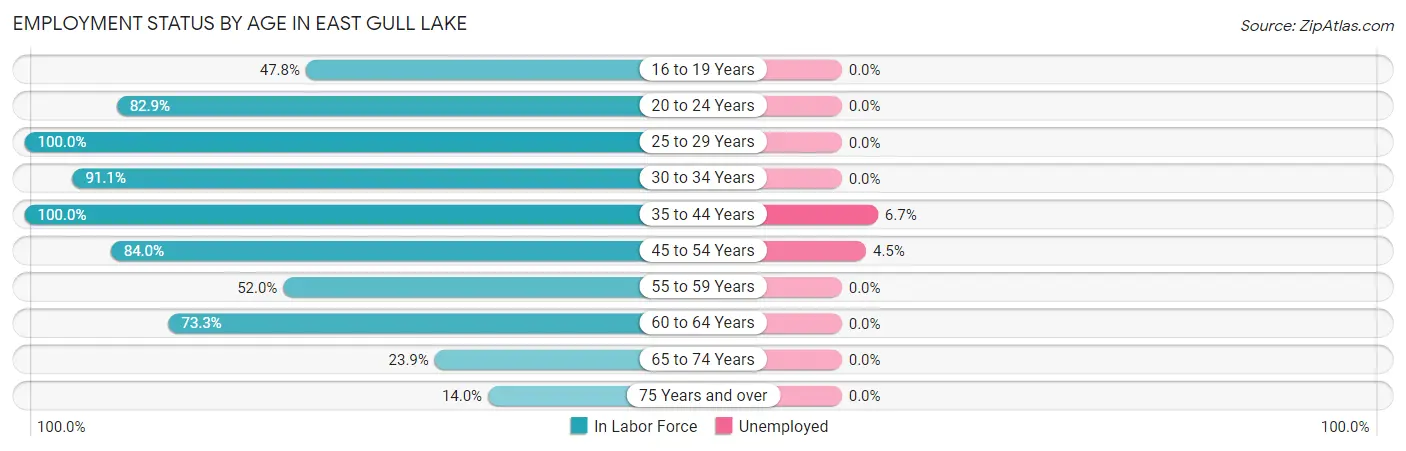
| Age Bracket | In Labor Force | Unemployed |
| 16 to 19 Years | 22 (47.8%) | 0 (0.0%) |
| 20 to 24 Years | 29 (82.9%) | 0 (0.0%) |
| 25 to 29 Years | 31 (100.0%) | 0 (0.0%) |
| 30 to 34 Years | 41 (91.1%) | 0 (0.0%) |
| 35 to 44 Years | 165 (100.0%) | 11 (6.7%) |
| 45 to 54 Years | 89 (84.0%) | 4 (4.5%) |
| 55 to 59 Years | 26 (52.0%) | 0 (0.0%) |
| 60 to 64 Years | 63 (73.3%) | 0 (0.0%) |
| 65 to 74 Years | 44 (23.9%) | 0 (0.0%) |
| 75 Years and over | 15 (14.0%) | 0 (0.0%) |
| Total | 525 (61.4%) | 15 (2.9%) |
Employment Status by Educational Attainment in East Gull Lake
According to labor force statistics for East Gull Lake, 85.9% of individuals (415) out of the total population between 25 and 64 years of age (483) are in the labor force, with 3.6% or 15 of them being unemployed. The group with the highest labor force participation rate are those with the educational attainment of less than high school, with 100.0% or 4 individuals in the labor force. Within the labor force, individuals with college / associate degree education have the highest percentage of unemployment, with 10.7% or 13 of them being unemployed.
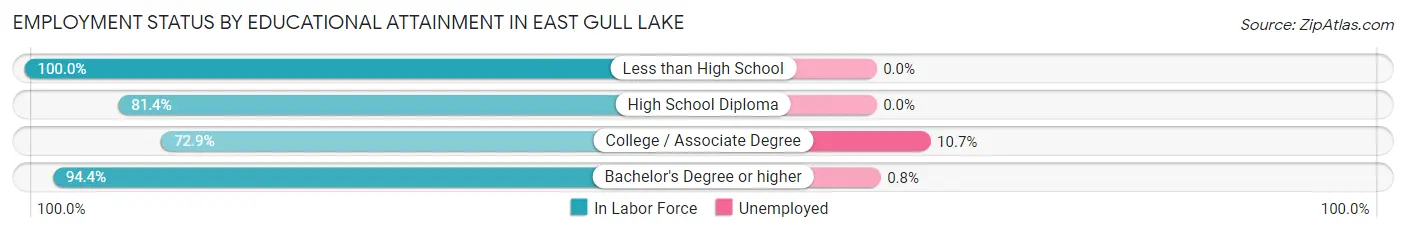
| Educational Attainment | In Labor Force | Unemployed |
| Less than High School | 4 (100.0%) | 0 (0.0%) |
| High School Diploma | 35 (81.4%) | 0 (0.0%) |
| College / Associate Degree | 121 (72.9%) | 18 (10.7%) |
| Bachelor's Degree or higher | 255 (94.4%) | 2 (0.8%) |
| Total | 415 (85.9%) | 17 (3.6%) |
Employment Occupations by Sex in East Gull Lake
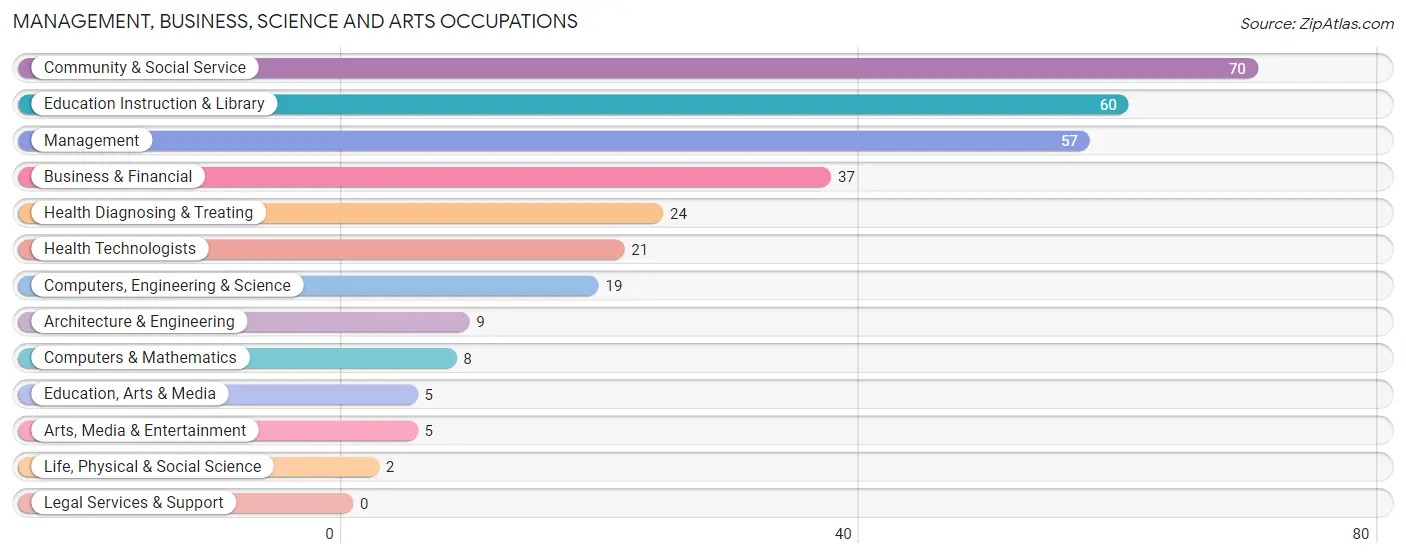
Management, Business, Science and Arts Occupations
The most common Management, Business, Science and Arts occupations in East Gull Lake are Community & Social Service (70 | 13.8%), Education Instruction & Library (60 | 11.8%), Management (57 | 11.2%), Business & Financial (37 | 7.3%), and Health Diagnosing & Treating (24 | 4.7%).
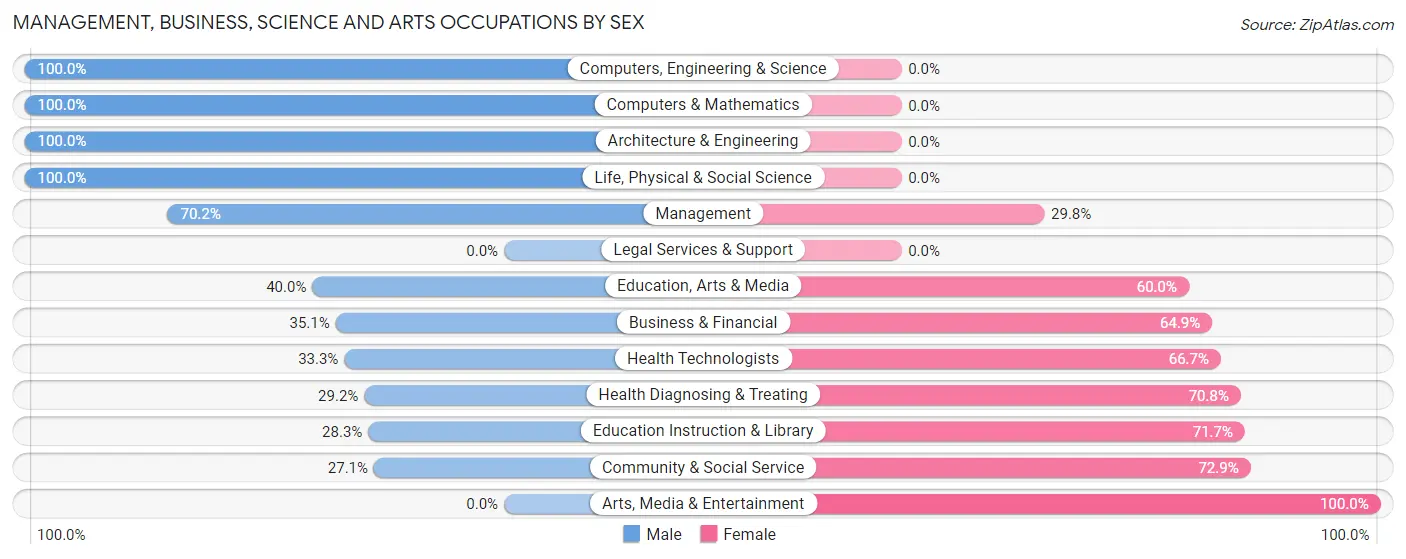
Management, Business, Science and Arts Occupations by Sex
Within the Management, Business, Science and Arts occupations in East Gull Lake, the most male-oriented occupations are Computers, Engineering & Science (100.0%), Computers & Mathematics (100.0%), and Architecture & Engineering (100.0%), while the most female-oriented occupations are Arts, Media & Entertainment (100.0%), Community & Social Service (72.9%), and Education Instruction & Library (71.7%).
| Occupation | Male | Female |
| Management | 40 (70.2%) | 17 (29.8%) |
| Business & Financial | 13 (35.1%) | 24 (64.9%) |
| Computers, Engineering & Science | 19 (100.0%) | 0 (0.0%) |
| Computers & Mathematics | 8 (100.0%) | 0 (0.0%) |
| Architecture & Engineering | 9 (100.0%) | 0 (0.0%) |
| Life, Physical & Social Science | 2 (100.0%) | 0 (0.0%) |
| Community & Social Service | 19 (27.1%) | 51 (72.9%) |
| Education, Arts & Media | 2 (40.0%) | 3 (60.0%) |
| Legal Services & Support | 0 (0.0%) | 0 (0.0%) |
| Education Instruction & Library | 17 (28.3%) | 43 (71.7%) |
| Arts, Media & Entertainment | 0 (0.0%) | 5 (100.0%) |
| Health Diagnosing & Treating | 7 (29.2%) | 17 (70.8%) |
| Health Technologists | 7 (33.3%) | 14 (66.7%) |
| Total (Category) | 98 (47.3%) | 109 (52.7%) |
| Total (Overall) | 250 (49.1%) | 259 (50.9%) |
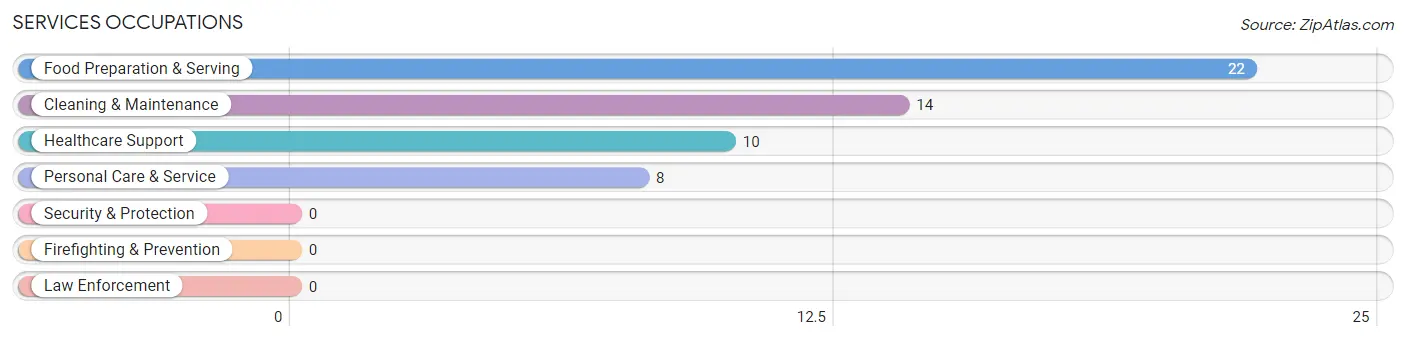
Services Occupations
The most common Services occupations in East Gull Lake are Food Preparation & Serving (22 | 4.3%), Cleaning & Maintenance (14 | 2.8%), Healthcare Support (10 | 2.0%), and Personal Care & Service (8 | 1.6%).
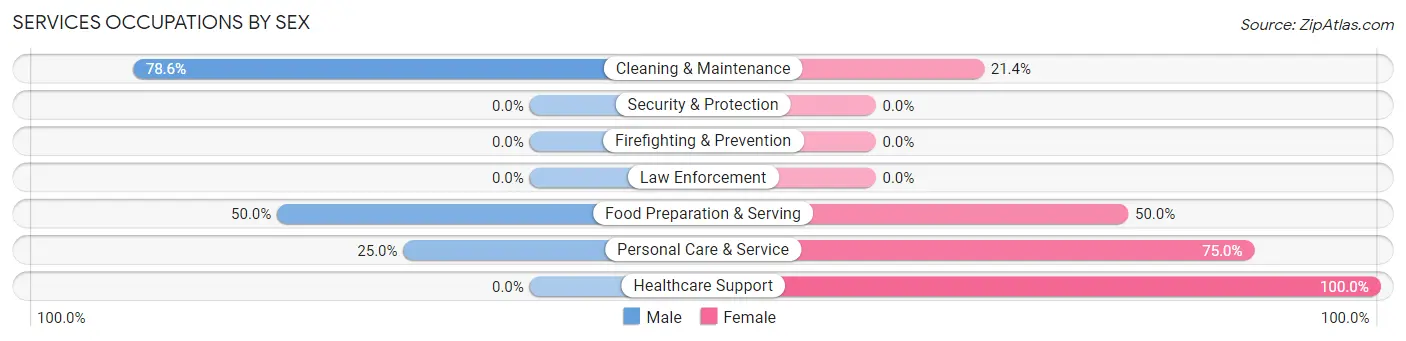
Services Occupations by Sex
Within the Services occupations in East Gull Lake, the most male-oriented occupations are Cleaning & Maintenance (78.6%), Food Preparation & Serving (50.0%), and Personal Care & Service (25.0%), while the most female-oriented occupations are Healthcare Support (100.0%), Personal Care & Service (75.0%), and Food Preparation & Serving (50.0%).
| Occupation | Male | Female |
| Healthcare Support | 0 (0.0%) | 10 (100.0%) |
| Security & Protection | 0 (0.0%) | 0 (0.0%) |
| Firefighting & Prevention | 0 (0.0%) | 0 (0.0%) |
| Law Enforcement | 0 (0.0%) | 0 (0.0%) |
| Food Preparation & Serving | 11 (50.0%) | 11 (50.0%) |
| Cleaning & Maintenance | 11 (78.6%) | 3 (21.4%) |
| Personal Care & Service | 2 (25.0%) | 6 (75.0%) |
| Total (Category) | 24 (44.4%) | 30 (55.6%) |
| Total (Overall) | 250 (49.1%) | 259 (50.9%) |
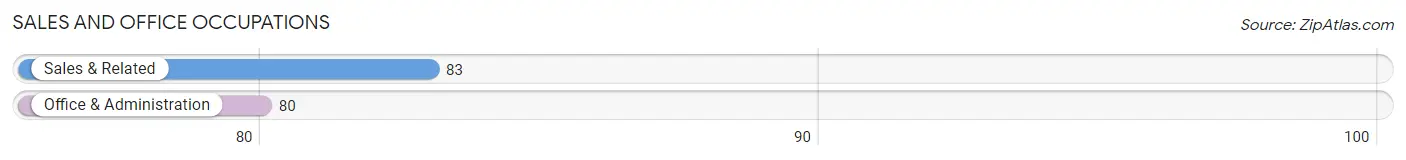
Sales and Office Occupations
The most common Sales and Office occupations in East Gull Lake are Sales & Related (83 | 16.3%), and Office & Administration (80 | 15.7%).
Sales and Office Occupations by Sex
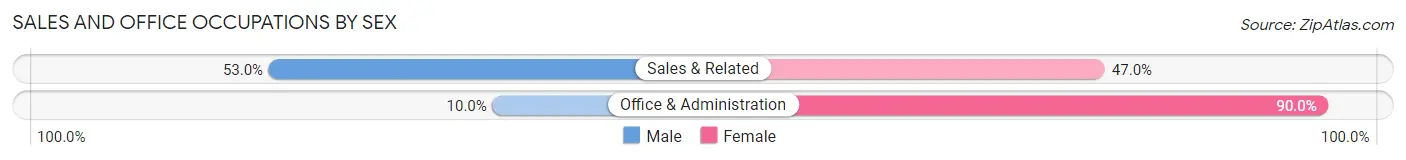
| Occupation | Male | Female |
| Sales & Related | 44 (53.0%) | 39 (47.0%) |
| Office & Administration | 8 (10.0%) | 72 (90.0%) |
| Total (Category) | 52 (31.9%) | 111 (68.1%) |
| Total (Overall) | 250 (49.1%) | 259 (50.9%) |
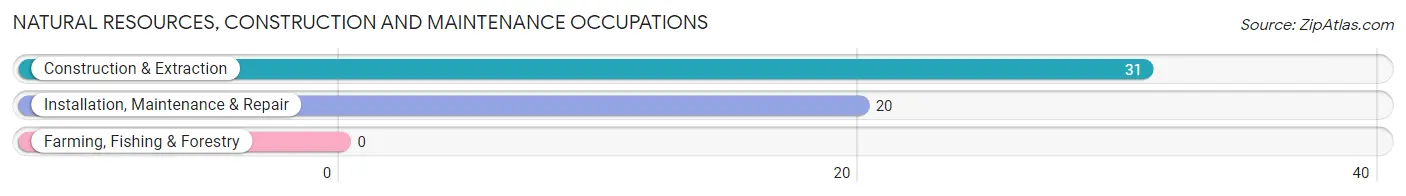
Natural Resources, Construction and Maintenance Occupations
The most common Natural Resources, Construction and Maintenance occupations in East Gull Lake are Construction & Extraction (31 | 6.1%), and Installation, Maintenance & Repair (20 | 3.9%).
Natural Resources, Construction and Maintenance Occupations by Sex
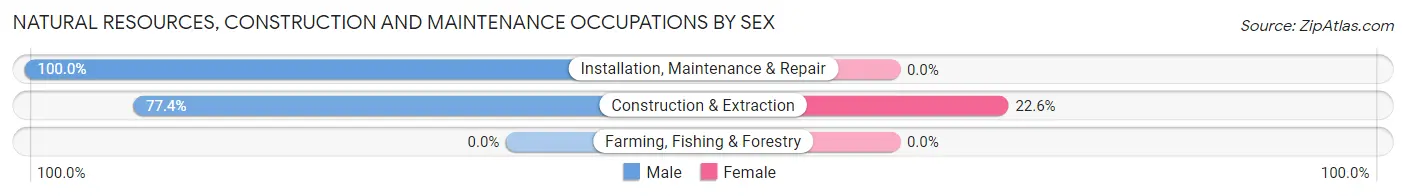
| Occupation | Male | Female |
| Farming, Fishing & Forestry | 0 (0.0%) | 0 (0.0%) |
| Construction & Extraction | 24 (77.4%) | 7 (22.6%) |
| Installation, Maintenance & Repair | 20 (100.0%) | 0 (0.0%) |
| Total (Category) | 44 (86.3%) | 7 (13.7%) |
| Total (Overall) | 250 (49.1%) | 259 (50.9%) |
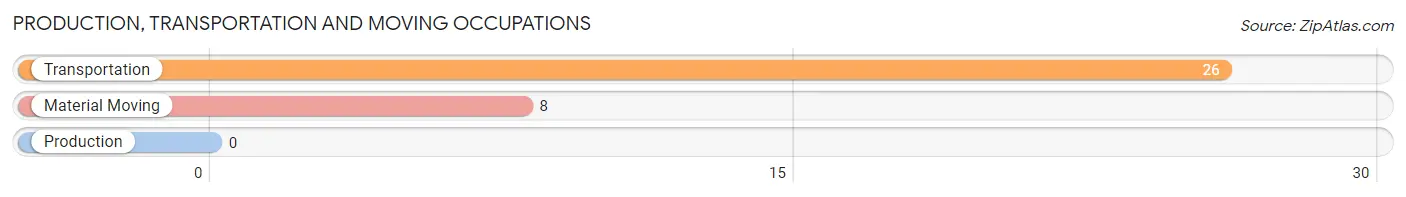
Production, Transportation and Moving Occupations
The most common Production, Transportation and Moving occupations in East Gull Lake are Transportation (26 | 5.1%), and Material Moving (8 | 1.6%).
Production, Transportation and Moving Occupations by Sex
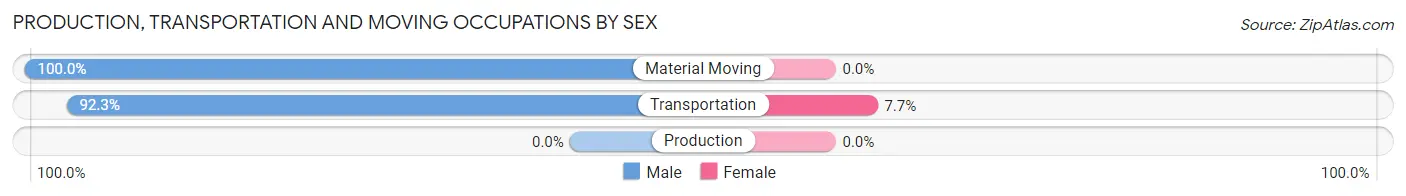
| Occupation | Male | Female |
| Production | 0 (0.0%) | 0 (0.0%) |
| Transportation | 24 (92.3%) | 2 (7.7%) |
| Material Moving | 8 (100.0%) | 0 (0.0%) |
| Total (Category) | 32 (94.1%) | 2 (5.9%) |
| Total (Overall) | 250 (49.1%) | 259 (50.9%) |
Employment Industries by Sex in East Gull Lake
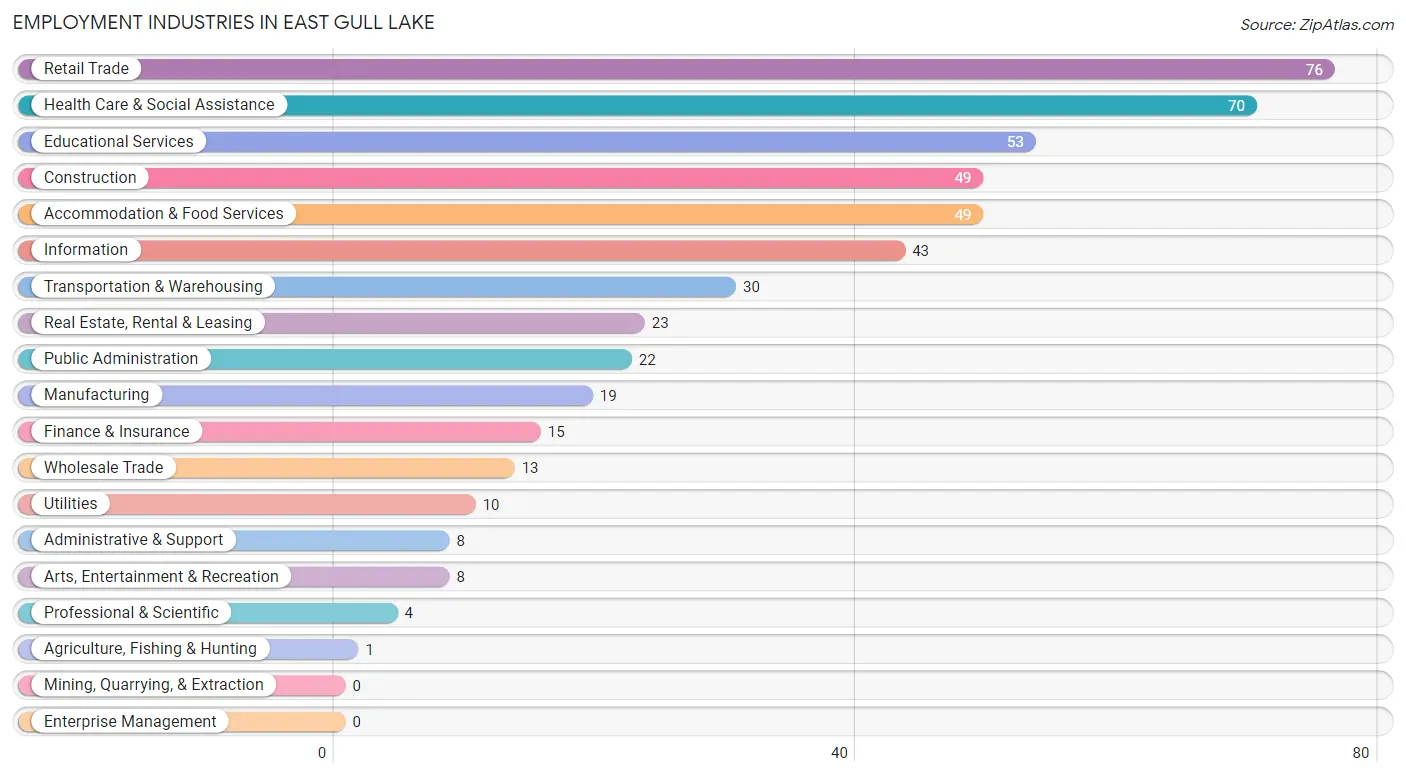
Employment Industries in East Gull Lake
The major employment industries in East Gull Lake include Retail Trade (76 | 14.9%), Health Care & Social Assistance (70 | 13.8%), Educational Services (53 | 10.4%), Construction (49 | 9.6%), and Accommodation & Food Services (49 | 9.6%).
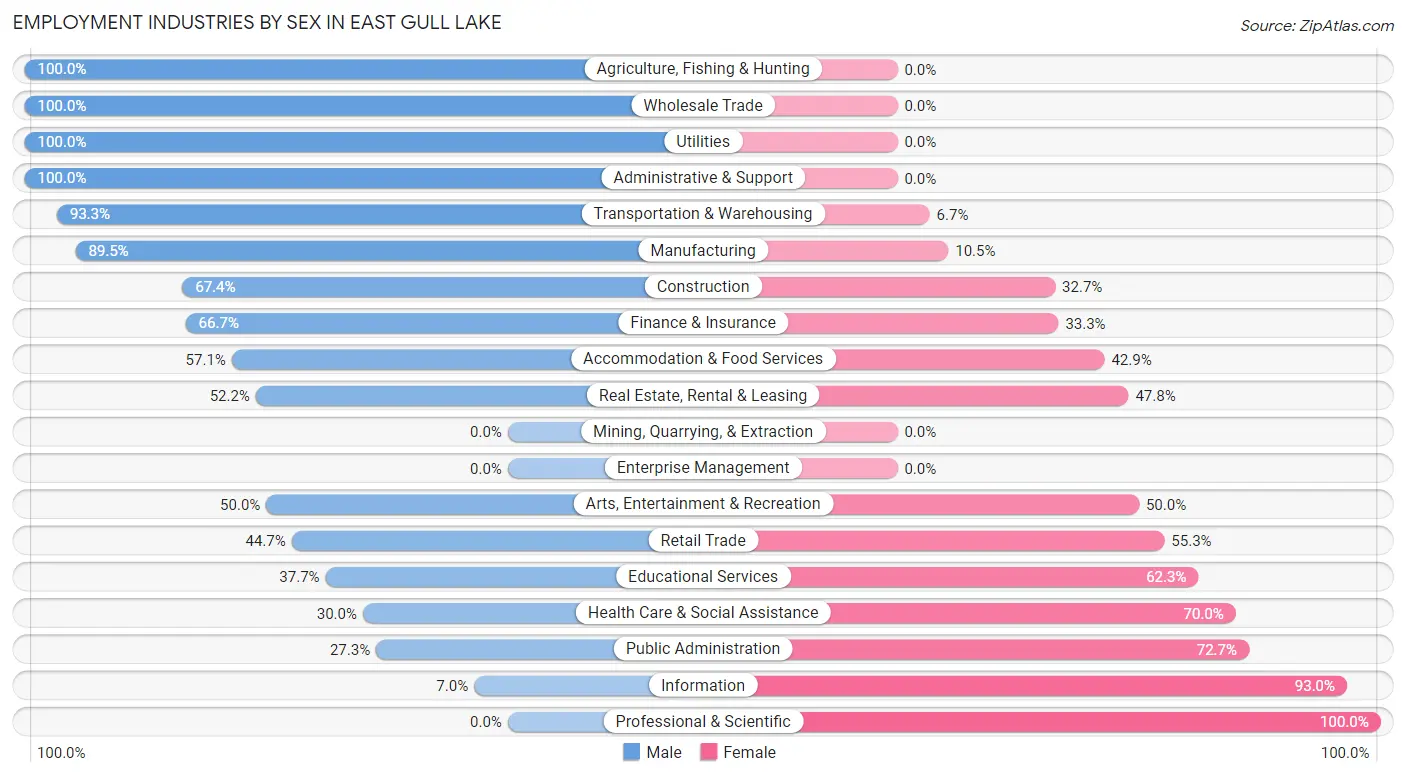
Employment Industries by Sex in East Gull Lake
The East Gull Lake industries that see more men than women are Agriculture, Fishing & Hunting (100.0%), Wholesale Trade (100.0%), and Utilities (100.0%), whereas the industries that tend to have a higher number of women are Professional & Scientific (100.0%), Information (93.0%), and Public Administration (72.7%).
| Industry | Male | Female |
| Agriculture, Fishing & Hunting | 1 (100.0%) | 0 (0.0%) |
| Mining, Quarrying, & Extraction | 0 (0.0%) | 0 (0.0%) |
| Construction | 33 (67.3%) | 16 (32.7%) |
| Manufacturing | 17 (89.5%) | 2 (10.5%) |
| Wholesale Trade | 13 (100.0%) | 0 (0.0%) |
| Retail Trade | 34 (44.7%) | 42 (55.3%) |
| Transportation & Warehousing | 28 (93.3%) | 2 (6.7%) |
| Utilities | 10 (100.0%) | 0 (0.0%) |
| Information | 3 (7.0%) | 40 (93.0%) |
| Finance & Insurance | 10 (66.7%) | 5 (33.3%) |
| Real Estate, Rental & Leasing | 12 (52.2%) | 11 (47.8%) |
| Professional & Scientific | 0 (0.0%) | 4 (100.0%) |
| Enterprise Management | 0 (0.0%) | 0 (0.0%) |
| Administrative & Support | 8 (100.0%) | 0 (0.0%) |
| Educational Services | 20 (37.7%) | 33 (62.3%) |
| Health Care & Social Assistance | 21 (30.0%) | 49 (70.0%) |
| Arts, Entertainment & Recreation | 4 (50.0%) | 4 (50.0%) |
| Accommodation & Food Services | 28 (57.1%) | 21 (42.9%) |
| Public Administration | 6 (27.3%) | 16 (72.7%) |
| Total | 250 (49.1%) | 259 (50.9%) |
Education in East Gull Lake
School Enrollment in East Gull Lake
The most common levels of schooling among the 240 students in East Gull Lake are high school (89 | 37.1%), middle school (50 | 20.8%), and college / undergraduate (44 | 18.3%).
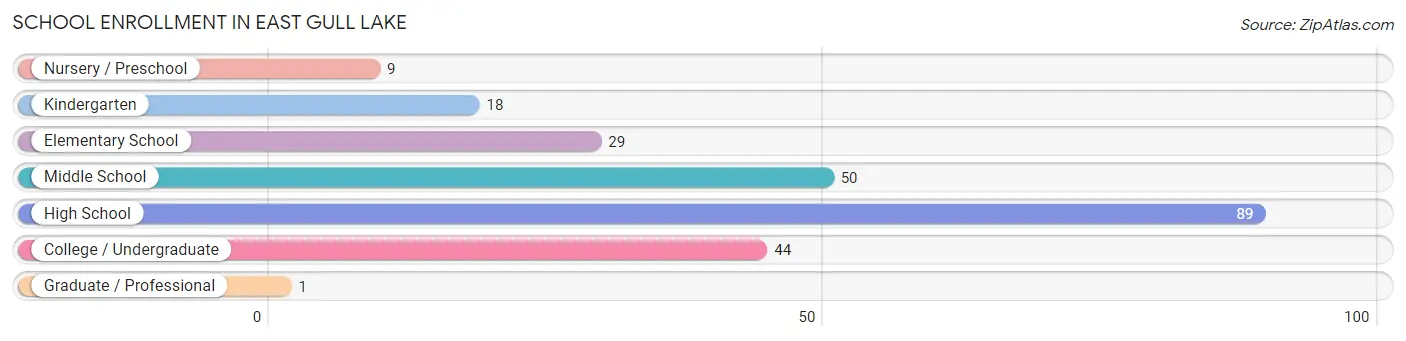
| School Level | # Students | % Students |
| Nursery / Preschool | 9 | 3.7% |
| Kindergarten | 18 | 7.5% |
| Elementary School | 29 | 12.1% |
| Middle School | 50 | 20.8% |
| High School | 89 | 37.1% |
| College / Undergraduate | 44 | 18.3% |
| Graduate / Professional | 1 | 0.4% |
| Total | 240 | 100.0% |
School Enrollment by Age by Funding Source in East Gull Lake
Out of a total of 240 students who are enrolled in schools in East Gull Lake, 31 (12.9%) attend a private institution, while the remaining 209 (87.1%) are enrolled in public schools. The age group of 25 to 34 year olds has the highest likelihood of being enrolled in private schools, with 4 (50.0% in the age bracket) enrolled. Conversely, the age group of 3 to 4 year olds has the lowest likelihood of being enrolled in a private school, with 6 (100.0% in the age bracket) attending a public institution.
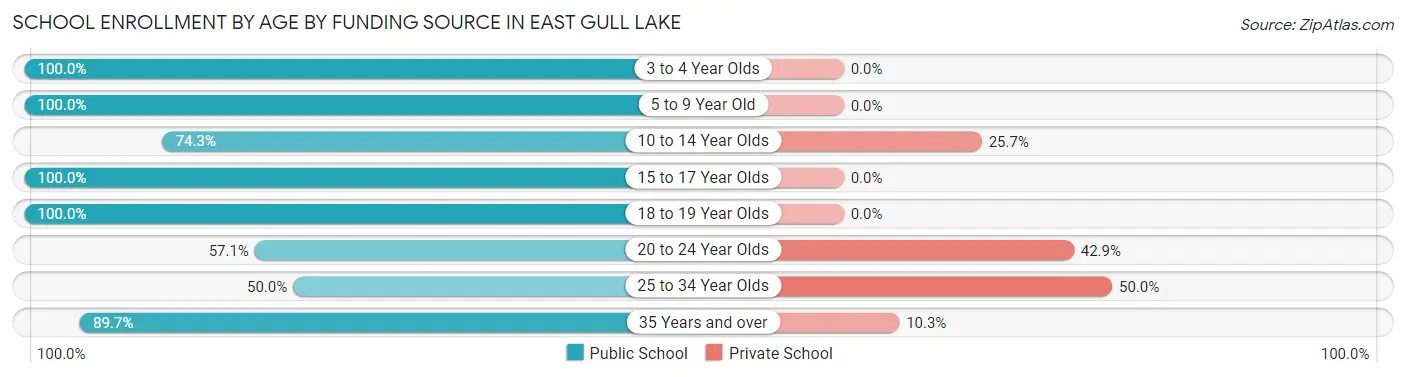
| Age Bracket | Public School | Private School |
| 3 to 4 Year Olds | 6 (100.0%) | 0 (0.0%) |
| 5 to 9 Year Old | 42 (100.0%) | 0 (0.0%) |
| 10 to 14 Year Olds | 52 (74.3%) | 18 (25.7%) |
| 15 to 17 Year Olds | 54 (100.0%) | 0 (0.0%) |
| 18 to 19 Year Olds | 17 (100.0%) | 0 (0.0%) |
| 20 to 24 Year Olds | 8 (57.1%) | 6 (42.9%) |
| 25 to 34 Year Olds | 4 (50.0%) | 4 (50.0%) |
| 35 Years and over | 26 (89.7%) | 3 (10.3%) |
| Total | 209 (87.1%) | 31 (12.9%) |
Educational Attainment by Field of Study in East Gull Lake
Education (90 | 20.7%), business (88 | 20.3%), science & technology (63 | 14.5%), arts & humanities (48 | 11.1%), and bio, nature & agricultural (43 | 9.9%) are the most common fields of study among 434 individuals in East Gull Lake who have obtained a bachelor's degree or higher.
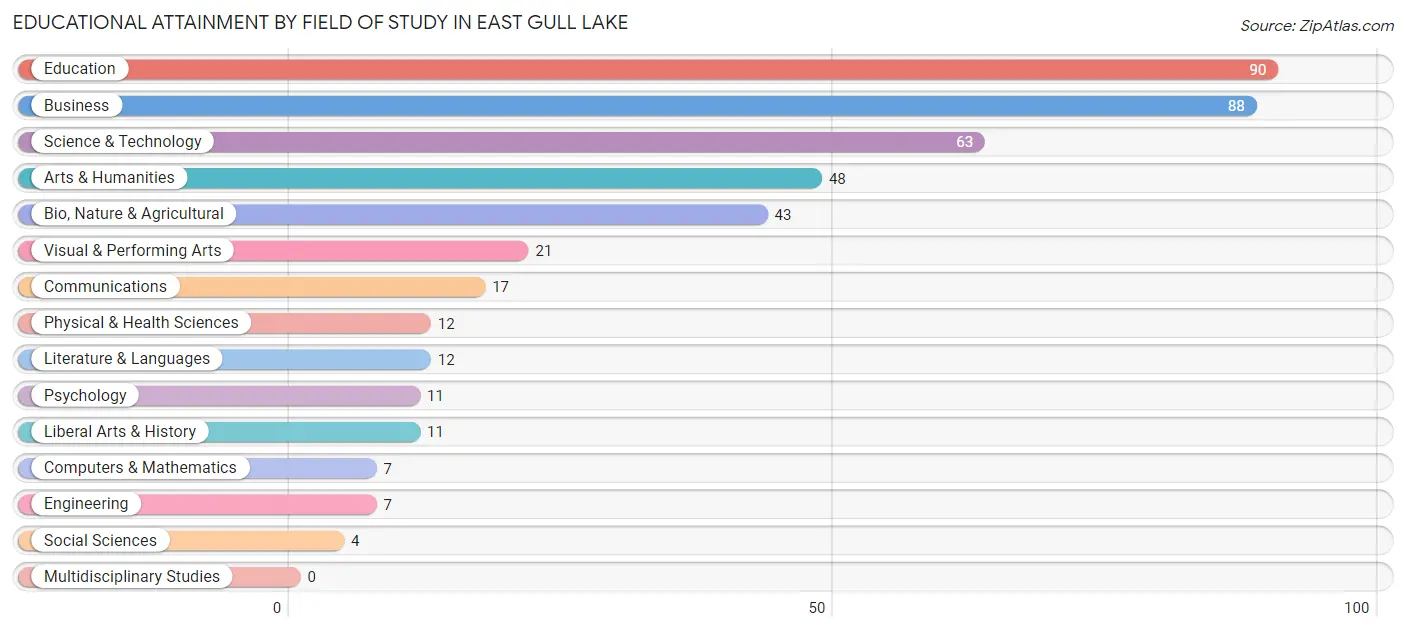
| Field of Study | # Graduates | % Graduates |
| Computers & Mathematics | 7 | 1.6% |
| Bio, Nature & Agricultural | 43 | 9.9% |
| Physical & Health Sciences | 12 | 2.8% |
| Psychology | 11 | 2.5% |
| Social Sciences | 4 | 0.9% |
| Engineering | 7 | 1.6% |
| Multidisciplinary Studies | 0 | 0.0% |
| Science & Technology | 63 | 14.5% |
| Business | 88 | 20.3% |
| Education | 90 | 20.7% |
| Literature & Languages | 12 | 2.8% |
| Liberal Arts & History | 11 | 2.5% |
| Visual & Performing Arts | 21 | 4.8% |
| Communications | 17 | 3.9% |
| Arts & Humanities | 48 | 11.1% |
| Total | 434 | 100.0% |
Transportation & Commute in East Gull Lake
Vehicle Availability by Sex in East Gull Lake
The most prevalent vehicle ownership categories in East Gull Lake are males with 2 vehicles (90, accounting for 36.0%) and females with 2 vehicles (117, making up 35.0%).
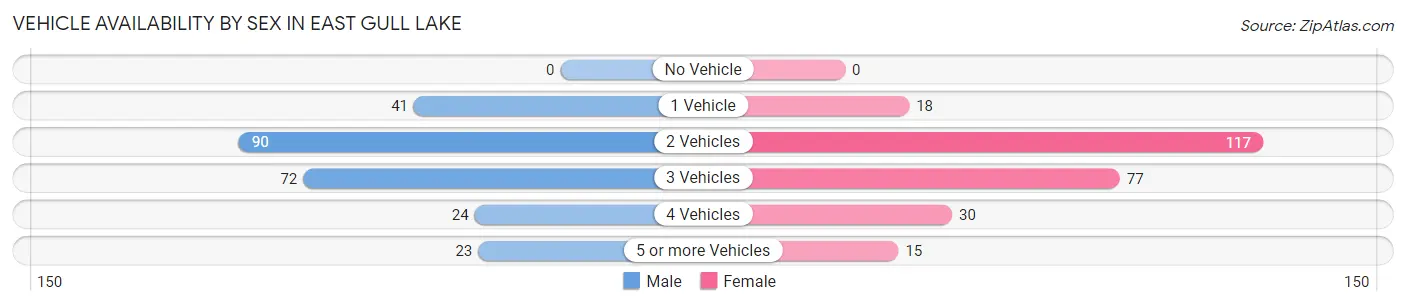
| Vehicles Available | Male | Female |
| No Vehicle | 0 (0.0%) | 0 (0.0%) |
| 1 Vehicle | 41 (16.4%) | 18 (7.0%) |
| 2 Vehicles | 90 (36.0%) | 117 (45.5%) |
| 3 Vehicles | 72 (28.8%) | 77 (30.0%) |
| 4 Vehicles | 24 (9.6%) | 30 (11.7%) |
| 5 or more Vehicles | 23 (9.2%) | 15 (5.8%) |
| Total | 250 (100.0%) | 257 (100.0%) |
Commute Time in East Gull Lake
The most frequently occuring commute durations in East Gull Lake are 15 to 19 minutes (178 commuters, 37.7%), 20 to 24 minutes (84 commuters, 17.8%), and 25 to 29 minutes (46 commuters, 9.8%).
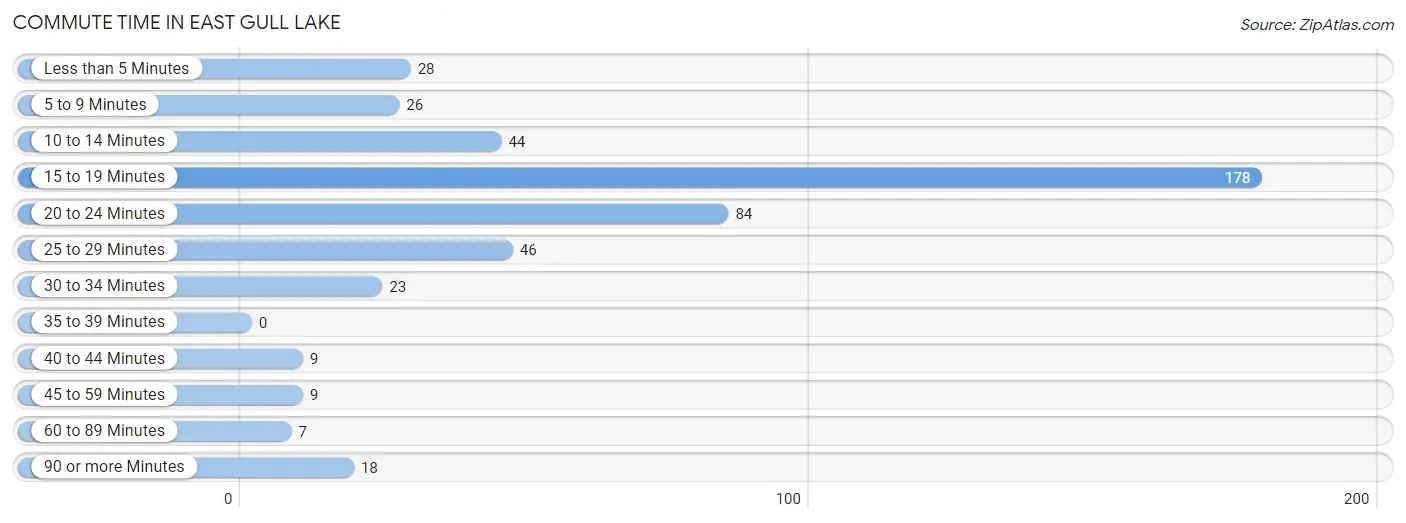
| Commute Time | # Commuters | % Commuters |
| Less than 5 Minutes | 28 | 5.9% |
| 5 to 9 Minutes | 26 | 5.5% |
| 10 to 14 Minutes | 44 | 9.3% |
| 15 to 19 Minutes | 178 | 37.7% |
| 20 to 24 Minutes | 84 | 17.8% |
| 25 to 29 Minutes | 46 | 9.8% |
| 30 to 34 Minutes | 23 | 4.9% |
| 35 to 39 Minutes | 0 | 0.0% |
| 40 to 44 Minutes | 9 | 1.9% |
| 45 to 59 Minutes | 9 | 1.9% |
| 60 to 89 Minutes | 7 | 1.5% |
| 90 or more Minutes | 18 | 3.8% |
Commute Time by Sex in East Gull Lake
The most common commute times in East Gull Lake are 15 to 19 minutes (60 commuters, 25.5%) for males and 15 to 19 minutes (118 commuters, 49.8%) for females.
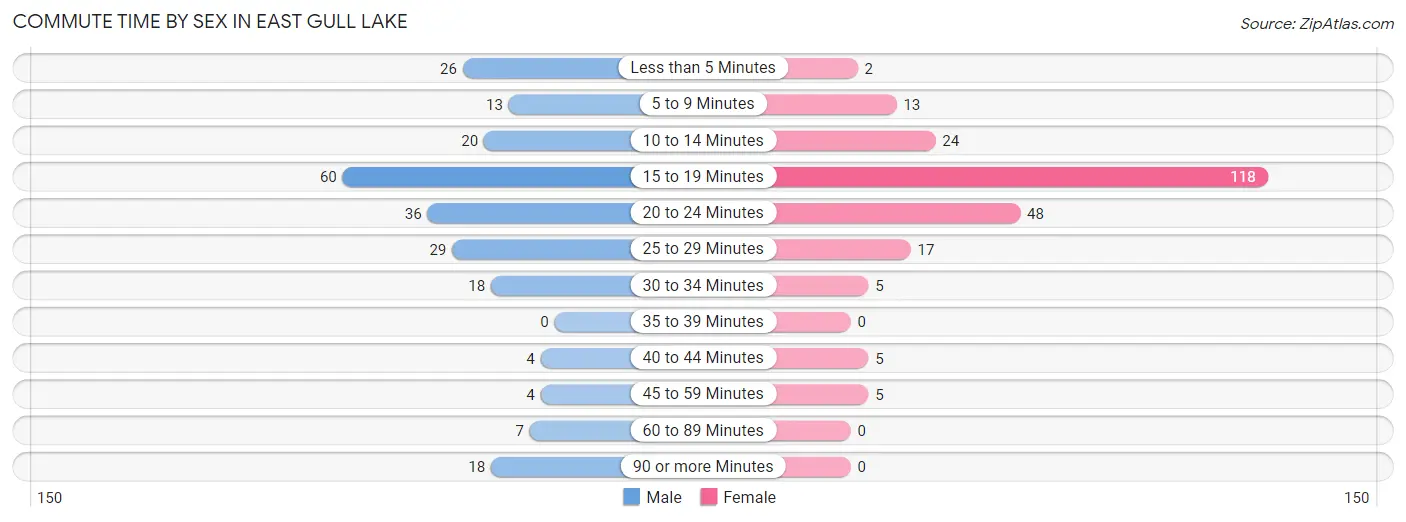
| Commute Time | Male | Female |
| Less than 5 Minutes | 26 (11.1%) | 2 (0.8%) |
| 5 to 9 Minutes | 13 (5.5%) | 13 (5.5%) |
| 10 to 14 Minutes | 20 (8.5%) | 24 (10.1%) |
| 15 to 19 Minutes | 60 (25.5%) | 118 (49.8%) |
| 20 to 24 Minutes | 36 (15.3%) | 48 (20.3%) |
| 25 to 29 Minutes | 29 (12.3%) | 17 (7.2%) |
| 30 to 34 Minutes | 18 (7.7%) | 5 (2.1%) |
| 35 to 39 Minutes | 0 (0.0%) | 0 (0.0%) |
| 40 to 44 Minutes | 4 (1.7%) | 5 (2.1%) |
| 45 to 59 Minutes | 4 (1.7%) | 5 (2.1%) |
| 60 to 89 Minutes | 7 (3.0%) | 0 (0.0%) |
| 90 or more Minutes | 18 (7.7%) | 0 (0.0%) |
Time of Departure to Work by Sex in East Gull Lake
The most frequent times of departure to work in East Gull Lake are 7:00 AM to 7:29 AM (51, 21.7%) for males and 7:00 AM to 7:29 AM (56, 23.6%) for females.
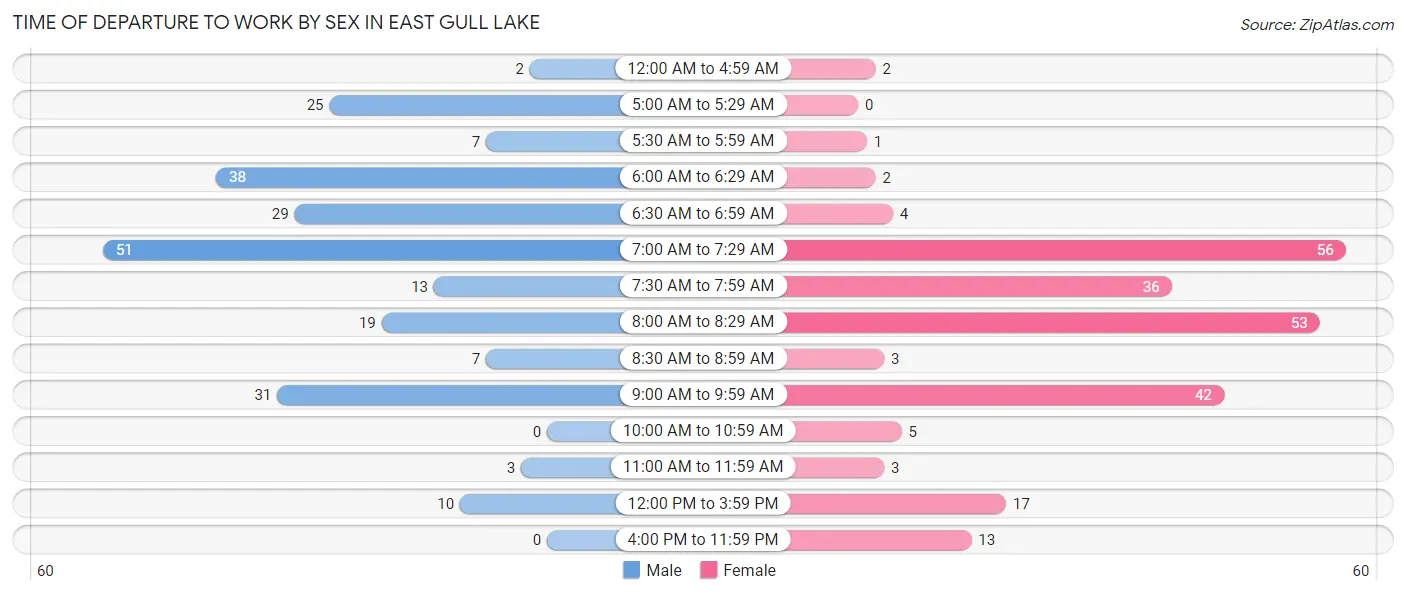
| Time of Departure | Male | Female |
| 12:00 AM to 4:59 AM | 2 (0.9%) | 2 (0.8%) |
| 5:00 AM to 5:29 AM | 25 (10.6%) | 0 (0.0%) |
| 5:30 AM to 5:59 AM | 7 (3.0%) | 1 (0.4%) |
| 6:00 AM to 6:29 AM | 38 (16.2%) | 2 (0.8%) |
| 6:30 AM to 6:59 AM | 29 (12.3%) | 4 (1.7%) |
| 7:00 AM to 7:29 AM | 51 (21.7%) | 56 (23.6%) |
| 7:30 AM to 7:59 AM | 13 (5.5%) | 36 (15.2%) |
| 8:00 AM to 8:29 AM | 19 (8.1%) | 53 (22.4%) |
| 8:30 AM to 8:59 AM | 7 (3.0%) | 3 (1.3%) |
| 9:00 AM to 9:59 AM | 31 (13.2%) | 42 (17.7%) |
| 10:00 AM to 10:59 AM | 0 (0.0%) | 5 (2.1%) |
| 11:00 AM to 11:59 AM | 3 (1.3%) | 3 (1.3%) |
| 12:00 PM to 3:59 PM | 10 (4.3%) | 17 (7.2%) |
| 4:00 PM to 11:59 PM | 0 (0.0%) | 13 (5.5%) |
| Total | 235 (100.0%) | 237 (100.0%) |
Housing Occupancy in East Gull Lake
Occupancy by Ownership in East Gull Lake
Of the total 395 dwellings in East Gull Lake, owner-occupied units account for 347 (87.8%), while renter-occupied units make up 48 (12.1%).
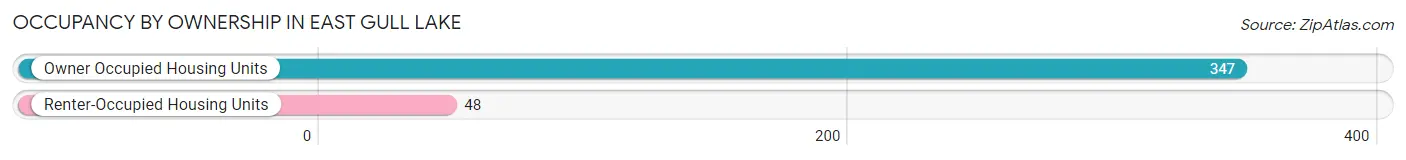
| Occupancy | # Housing Units | % Housing Units |
| Owner Occupied Housing Units | 347 | 87.8% |
| Renter-Occupied Housing Units | 48 | 12.1% |
| Total Occupied Housing Units | 395 | 100.0% |
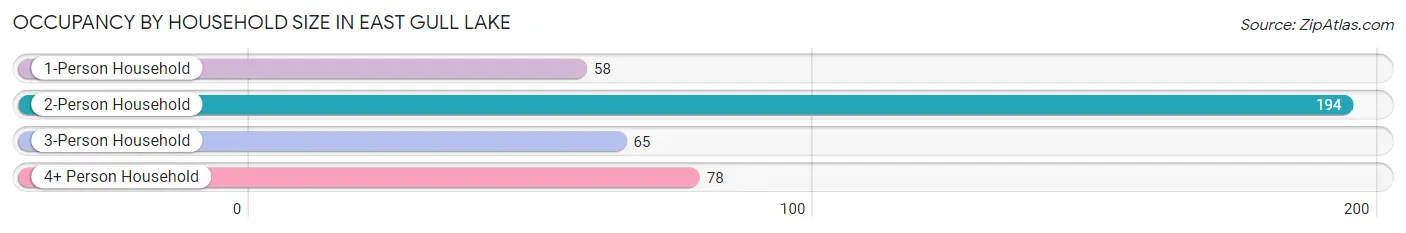
Occupancy by Household Size in East Gull Lake
| Household Size | # Housing Units | % Housing Units |
| 1-Person Household | 58 | 14.7% |
| 2-Person Household | 194 | 49.1% |
| 3-Person Household | 65 | 16.5% |
| 4+ Person Household | 78 | 19.8% |
| Total Housing Units | 395 | 100.0% |
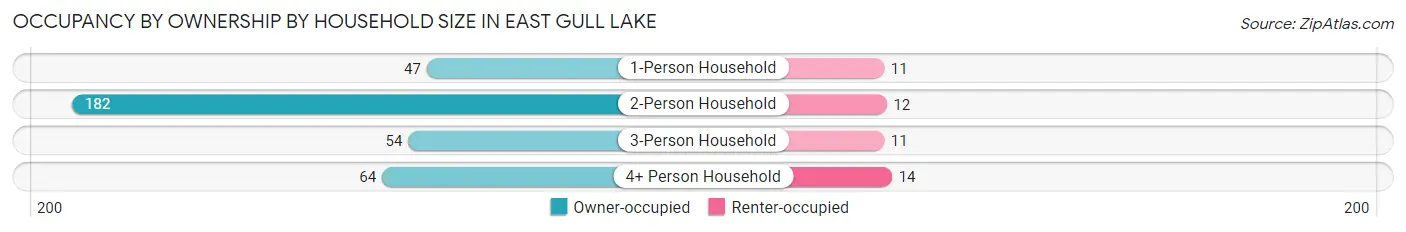
Occupancy by Ownership by Household Size in East Gull Lake
| Household Size | Owner-occupied | Renter-occupied |
| 1-Person Household | 47 (81.0%) | 11 (19.0%) |
| 2-Person Household | 182 (93.8%) | 12 (6.2%) |
| 3-Person Household | 54 (83.1%) | 11 (16.9%) |
| 4+ Person Household | 64 (82.1%) | 14 (17.9%) |
| Total Housing Units | 347 (87.8%) | 48 (12.1%) |
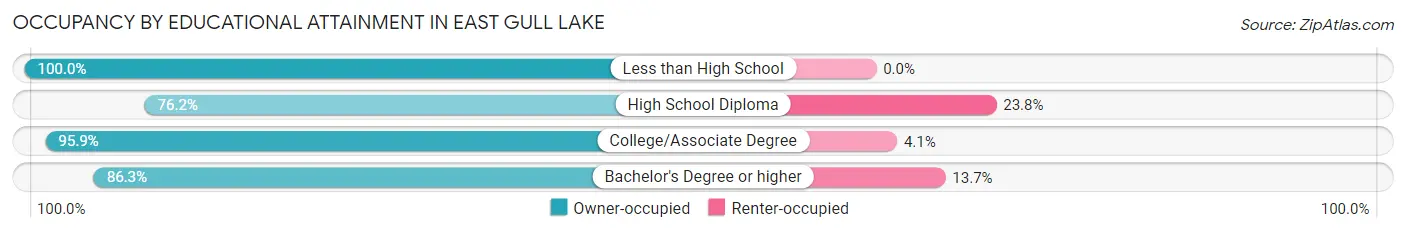
Occupancy by Educational Attainment in East Gull Lake
| Household Size | Owner-occupied | Renter-occupied |
| Less than High School | 7 (100.0%) | 0 (0.0%) |
| High School Diploma | 48 (76.2%) | 15 (23.8%) |
| College/Associate Degree | 116 (95.9%) | 5 (4.1%) |
| Bachelor's Degree or higher | 176 (86.3%) | 28 (13.7%) |
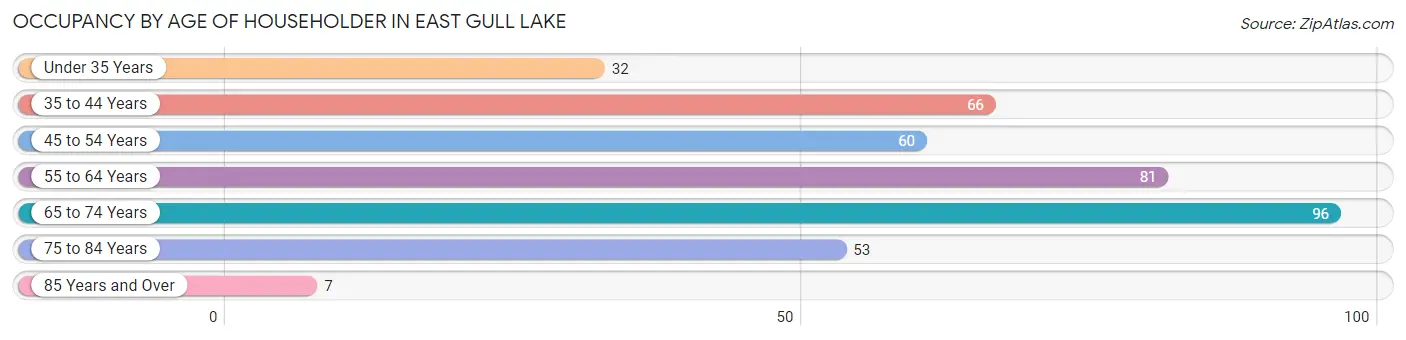
Occupancy by Age of Householder in East Gull Lake
| Age Bracket | # Households | % Households |
| Under 35 Years | 32 | 8.1% |
| 35 to 44 Years | 66 | 16.7% |
| 45 to 54 Years | 60 | 15.2% |
| 55 to 64 Years | 81 | 20.5% |
| 65 to 74 Years | 96 | 24.3% |
| 75 to 84 Years | 53 | 13.4% |
| 85 Years and Over | 7 | 1.8% |
| Total | 395 | 100.0% |
Housing Finances in East Gull Lake
Median Income by Occupancy in East Gull Lake
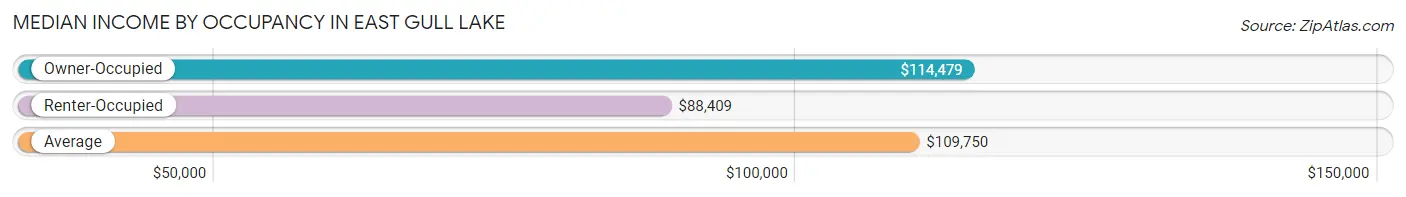
| Occupancy Type | # Households | Median Income |
| Owner-Occupied | 347 (87.8%) | $114,479 |
| Renter-Occupied | 48 (12.1%) | $88,409 |
| Average | 395 (100.0%) | $109,750 |
Occupancy by Householder Income Bracket in East Gull Lake
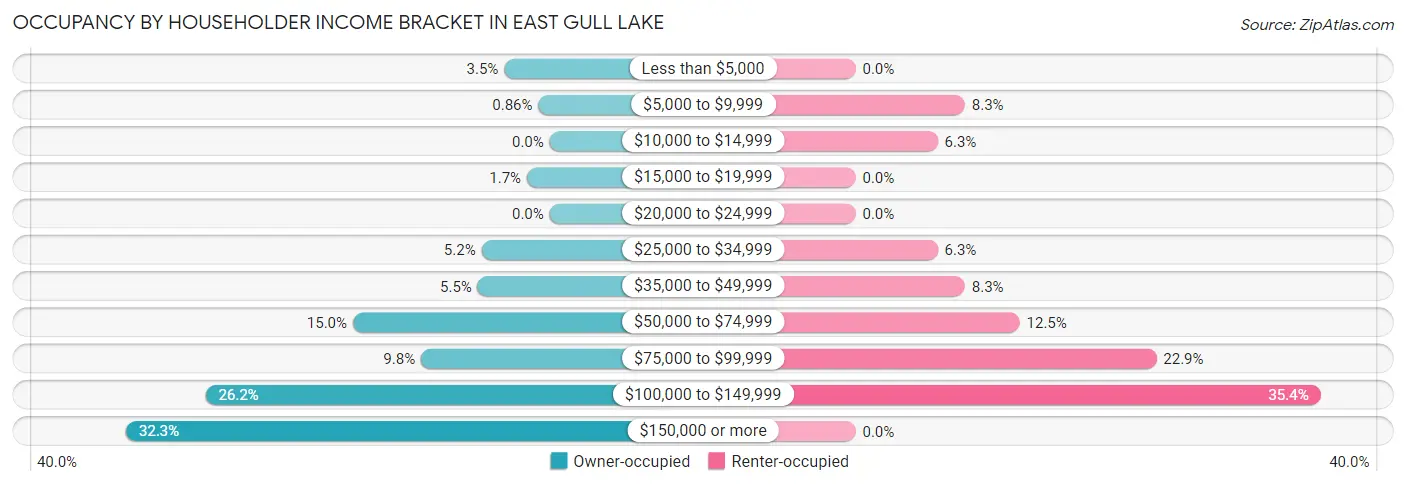
| Income Bracket | Owner-occupied | Renter-occupied |
| Less than $5,000 | 12 (3.5%) | 0 (0.0%) |
| $5,000 to $9,999 | 3 (0.9%) | 4 (8.3%) |
| $10,000 to $14,999 | 0 (0.0%) | 3 (6.2%) |
| $15,000 to $19,999 | 6 (1.7%) | 0 (0.0%) |
| $20,000 to $24,999 | 0 (0.0%) | 0 (0.0%) |
| $25,000 to $34,999 | 18 (5.2%) | 3 (6.2%) |
| $35,000 to $49,999 | 19 (5.5%) | 4 (8.3%) |
| $50,000 to $74,999 | 52 (15.0%) | 6 (12.5%) |
| $75,000 to $99,999 | 34 (9.8%) | 11 (22.9%) |
| $100,000 to $149,999 | 91 (26.2%) | 17 (35.4%) |
| $150,000 or more | 112 (32.3%) | 0 (0.0%) |
| Total | 347 (100.0%) | 48 (100.0%) |
Monthly Housing Cost Tiers in East Gull Lake
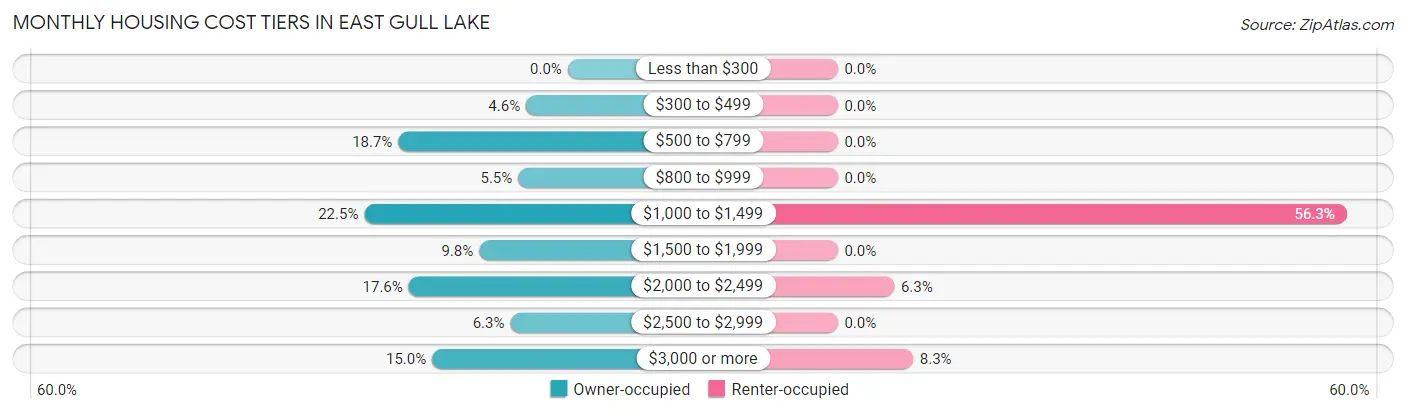
| Monthly Cost | Owner-occupied | Renter-occupied |
| Less than $300 | 0 (0.0%) | 0 (0.0%) |
| $300 to $499 | 16 (4.6%) | 0 (0.0%) |
| $500 to $799 | 65 (18.7%) | 0 (0.0%) |
| $800 to $999 | 19 (5.5%) | 0 (0.0%) |
| $1,000 to $1,499 | 78 (22.5%) | 27 (56.2%) |
| $1,500 to $1,999 | 34 (9.8%) | 0 (0.0%) |
| $2,000 to $2,499 | 61 (17.6%) | 3 (6.2%) |
| $2,500 to $2,999 | 22 (6.3%) | 0 (0.0%) |
| $3,000 or more | 52 (15.0%) | 4 (8.3%) |
| Total | 347 (100.0%) | 48 (100.0%) |
Physical Housing Characteristics in East Gull Lake
Housing Structures in East Gull Lake
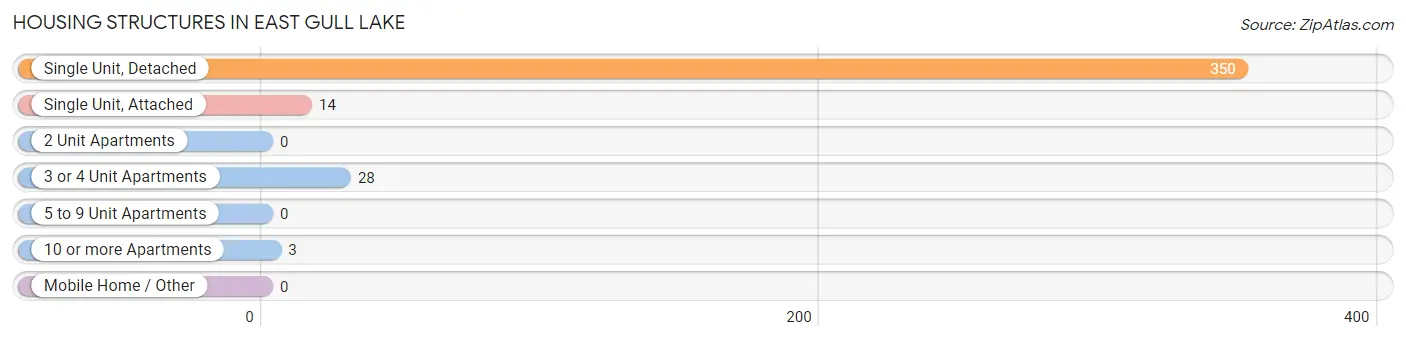
| Structure Type | # Housing Units | % Housing Units |
| Single Unit, Detached | 350 | 88.6% |
| Single Unit, Attached | 14 | 3.5% |
| 2 Unit Apartments | 0 | 0.0% |
| 3 or 4 Unit Apartments | 28 | 7.1% |
| 5 to 9 Unit Apartments | 0 | 0.0% |
| 10 or more Apartments | 3 | 0.8% |
| Mobile Home / Other | 0 | 0.0% |
| Total | 395 | 100.0% |
Housing Structures by Occupancy in East Gull Lake
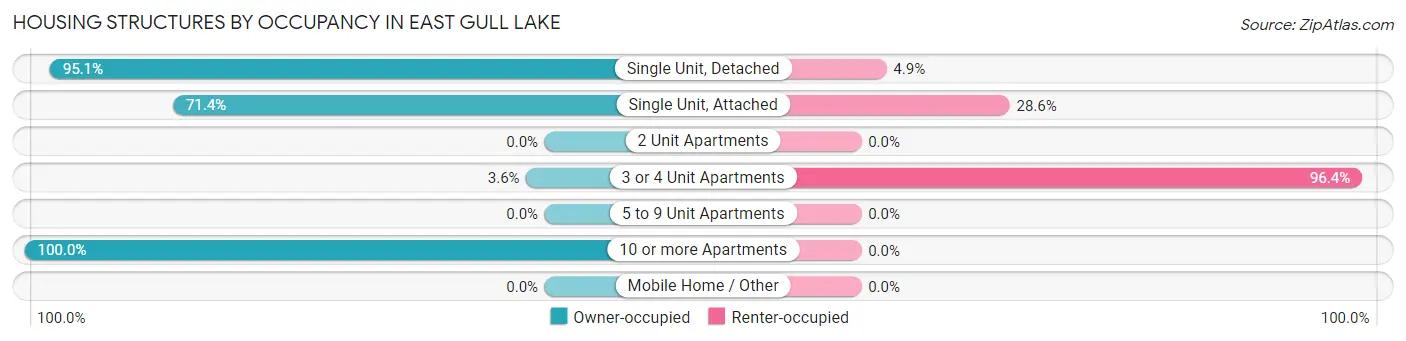
| Structure Type | Owner-occupied | Renter-occupied |
| Single Unit, Detached | 333 (95.1%) | 17 (4.9%) |
| Single Unit, Attached | 10 (71.4%) | 4 (28.6%) |
| 2 Unit Apartments | 0 (0.0%) | 0 (0.0%) |
| 3 or 4 Unit Apartments | 1 (3.6%) | 27 (96.4%) |
| 5 to 9 Unit Apartments | 0 (0.0%) | 0 (0.0%) |
| 10 or more Apartments | 3 (100.0%) | 0 (0.0%) |
| Mobile Home / Other | 0 (0.0%) | 0 (0.0%) |
| Total | 347 (87.8%) | 48 (12.1%) |
Housing Structures by Number of Rooms in East Gull Lake
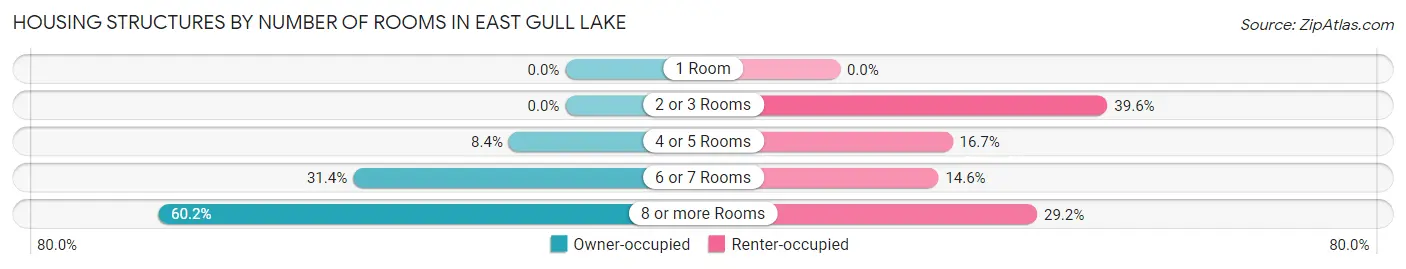
| Number of Rooms | Owner-occupied | Renter-occupied |
| 1 Room | 0 (0.0%) | 0 (0.0%) |
| 2 or 3 Rooms | 0 (0.0%) | 19 (39.6%) |
| 4 or 5 Rooms | 29 (8.4%) | 8 (16.7%) |
| 6 or 7 Rooms | 109 (31.4%) | 7 (14.6%) |
| 8 or more Rooms | 209 (60.2%) | 14 (29.2%) |
| Total | 347 (100.0%) | 48 (100.0%) |
Housing Structure by Heating Type in East Gull Lake
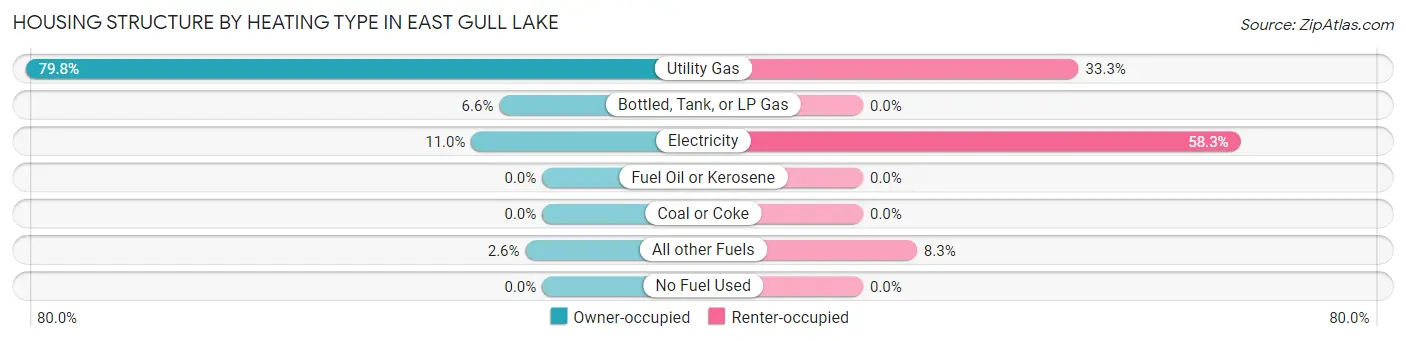
| Heating Type | Owner-occupied | Renter-occupied |
| Utility Gas | 277 (79.8%) | 16 (33.3%) |
| Bottled, Tank, or LP Gas | 23 (6.6%) | 0 (0.0%) |
| Electricity | 38 (11.0%) | 28 (58.3%) |
| Fuel Oil or Kerosene | 0 (0.0%) | 0 (0.0%) |
| Coal or Coke | 0 (0.0%) | 0 (0.0%) |
| All other Fuels | 9 (2.6%) | 4 (8.3%) |
| No Fuel Used | 0 (0.0%) | 0 (0.0%) |
| Total | 347 (100.0%) | 48 (100.0%) |
Household Vehicle Usage in East Gull Lake
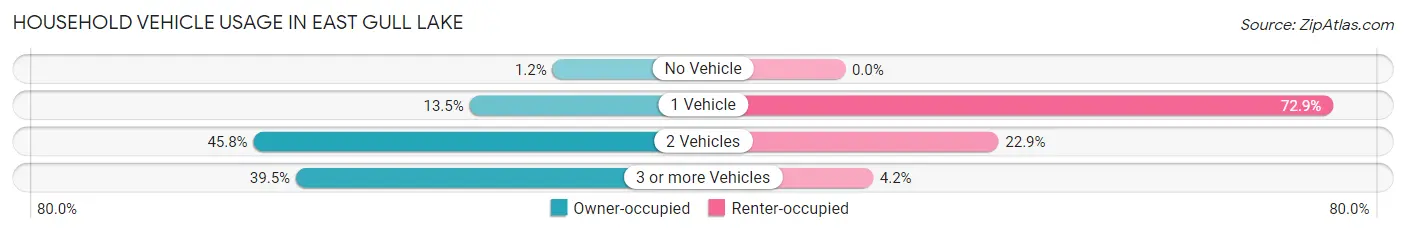
| Vehicles per Household | Owner-occupied | Renter-occupied |
| No Vehicle | 4 (1.1%) | 0 (0.0%) |
| 1 Vehicle | 47 (13.5%) | 35 (72.9%) |
| 2 Vehicles | 159 (45.8%) | 11 (22.9%) |
| 3 or more Vehicles | 137 (39.5%) | 2 (4.2%) |
| Total | 347 (100.0%) | 48 (100.0%) |
Real Estate & Mortgages in East Gull Lake
Real Estate and Mortgage Overview in East Gull Lake
| Characteristic | Without Mortgage | With Mortgage |
| Housing Units | 141 | 206 |
| Median Property Value | $654,200 | $434,800 |
| Median Household Income | $87,083 | $90 |
| Monthly Housing Costs | $774 | $49 |
| Real Estate Taxes | $4,386 | $0 |
Property Value by Mortgage Status in East Gull Lake
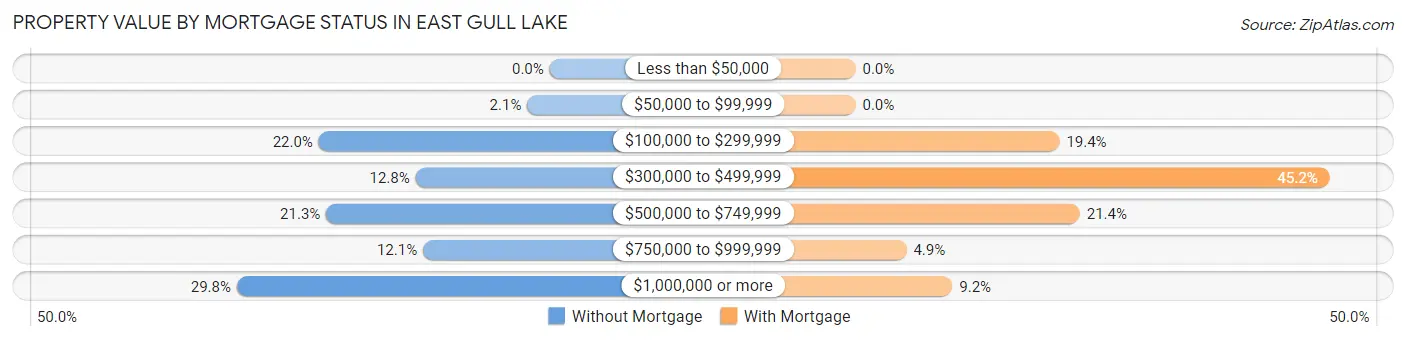
| Property Value | Without Mortgage | With Mortgage |
| Less than $50,000 | 0 (0.0%) | 0 (0.0%) |
| $50,000 to $99,999 | 3 (2.1%) | 0 (0.0%) |
| $100,000 to $299,999 | 31 (22.0%) | 40 (19.4%) |
| $300,000 to $499,999 | 18 (12.8%) | 93 (45.2%) |
| $500,000 to $749,999 | 30 (21.3%) | 44 (21.4%) |
| $750,000 to $999,999 | 17 (12.1%) | 10 (4.9%) |
| $1,000,000 or more | 42 (29.8%) | 19 (9.2%) |
| Total | 141 (100.0%) | 206 (100.0%) |
Household Income by Mortgage Status in East Gull Lake
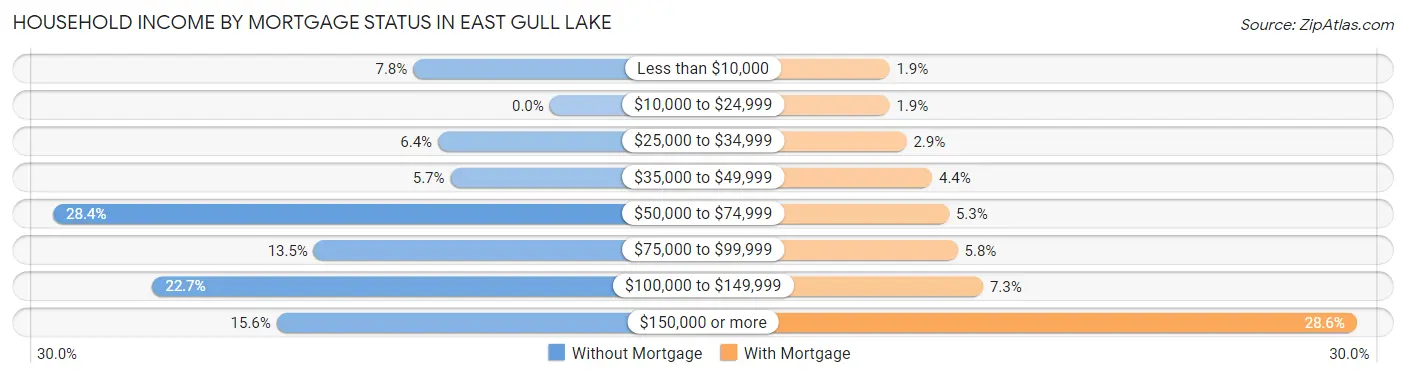
| Household Income | Without Mortgage | With Mortgage |
| Less than $10,000 | 11 (7.8%) | 4 (1.9%) |
| $10,000 to $24,999 | 0 (0.0%) | 4 (1.9%) |
| $25,000 to $34,999 | 9 (6.4%) | 6 (2.9%) |
| $35,000 to $49,999 | 8 (5.7%) | 9 (4.4%) |
| $50,000 to $74,999 | 40 (28.4%) | 11 (5.3%) |
| $75,000 to $99,999 | 19 (13.5%) | 12 (5.8%) |
| $100,000 to $149,999 | 32 (22.7%) | 15 (7.3%) |
| $150,000 or more | 22 (15.6%) | 59 (28.6%) |
| Total | 141 (100.0%) | 206 (100.0%) |
Property Value to Household Income Ratio in East Gull Lake
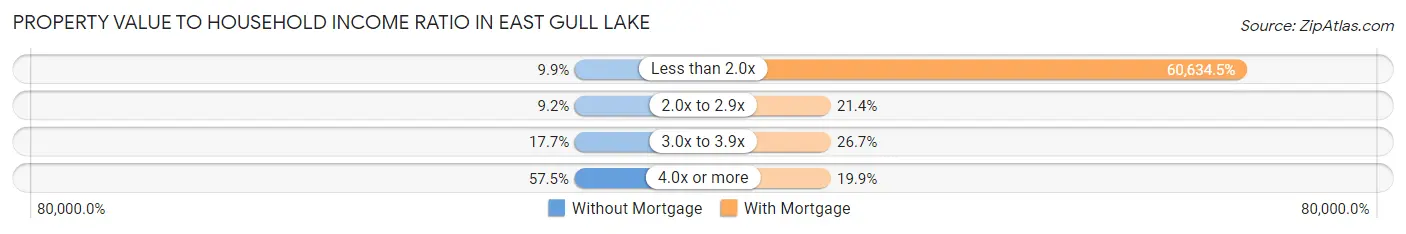
| Value-to-Income Ratio | Without Mortgage | With Mortgage |
| Less than 2.0x | 14 (9.9%) | 124,907 (60,634.5%) |
| 2.0x to 2.9x | 13 (9.2%) | 44 (21.4%) |
| 3.0x to 3.9x | 25 (17.7%) | 55 (26.7%) |
| 4.0x or more | 81 (57.5%) | 41 (19.9%) |
| Total | 141 (100.0%) | 206 (100.0%) |
Real Estate Taxes by Mortgage Status in East Gull Lake
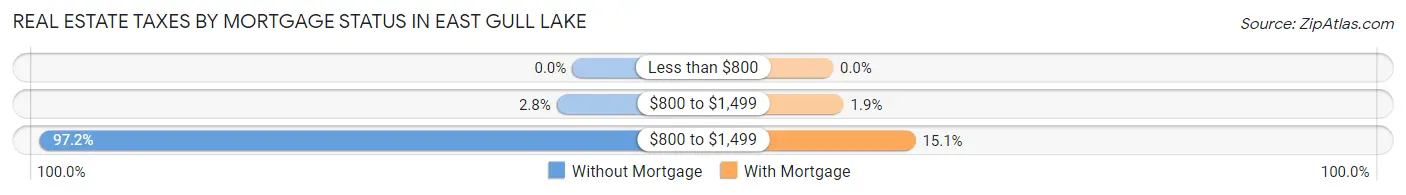
| Property Taxes | Without Mortgage | With Mortgage |
| Less than $800 | 0 (0.0%) | 0 (0.0%) |
| $800 to $1,499 | 4 (2.8%) | 4 (1.9%) |
| $800 to $1,499 | 137 (97.2%) | 31 (15.0%) |
| Total | 141 (100.0%) | 206 (100.0%) |
Health & Disability in East Gull Lake
Health Insurance Coverage by Age in East Gull Lake
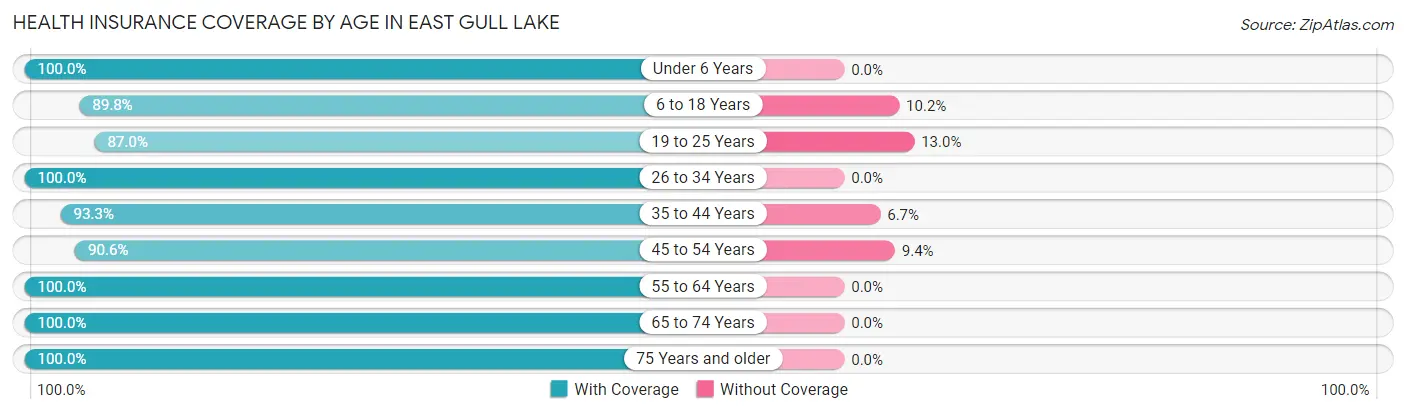
| Age Bracket | With Coverage | Without Coverage |
| Under 6 Years | 42 (100.0%) | 0 (0.0%) |
| 6 to 18 Years | 158 (89.8%) | 18 (10.2%) |
| 19 to 25 Years | 40 (87.0%) | 6 (13.0%) |
| 26 to 34 Years | 65 (100.0%) | 0 (0.0%) |
| 35 to 44 Years | 153 (93.3%) | 11 (6.7%) |
| 45 to 54 Years | 96 (90.6%) | 10 (9.4%) |
| 55 to 64 Years | 136 (100.0%) | 0 (0.0%) |
| 65 to 74 Years | 184 (100.0%) | 0 (0.0%) |
| 75 Years and older | 107 (100.0%) | 0 (0.0%) |
| Total | 981 (95.6%) | 45 (4.4%) |
Health Insurance Coverage by Citizenship Status in East Gull Lake
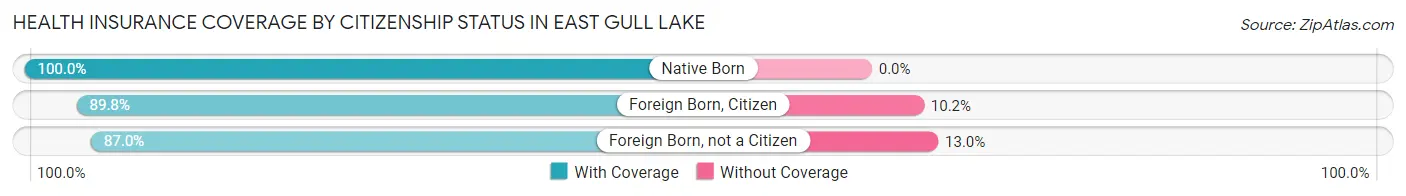
| Citizenship Status | With Coverage | Without Coverage |
| Native Born | 42 (100.0%) | 0 (0.0%) |
| Foreign Born, Citizen | 158 (89.8%) | 18 (10.2%) |
| Foreign Born, not a Citizen | 40 (87.0%) | 6 (13.0%) |
Health Insurance Coverage by Household Income in East Gull Lake
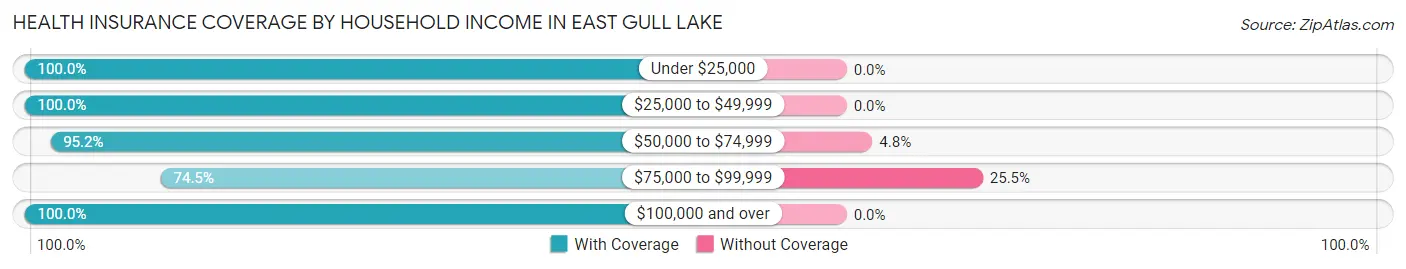
| Household Income | With Coverage | Without Coverage |
| Under $25,000 | 37 (100.0%) | 0 (0.0%) |
| $25,000 to $49,999 | 85 (100.0%) | 0 (0.0%) |
| $50,000 to $74,999 | 119 (95.2%) | 6 (4.8%) |
| $75,000 to $99,999 | 114 (74.5%) | 39 (25.5%) |
| $100,000 and over | 618 (100.0%) | 0 (0.0%) |
Public vs Private Health Insurance Coverage by Age in East Gull Lake
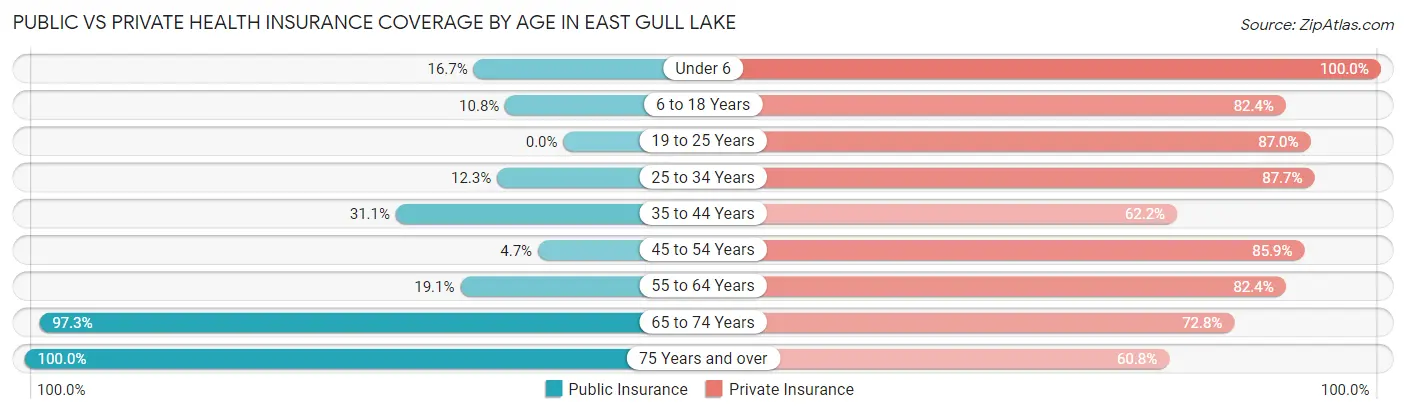
| Age Bracket | Public Insurance | Private Insurance |
| Under 6 | 7 (16.7%) | 42 (100.0%) |
| 6 to 18 Years | 19 (10.8%) | 145 (82.4%) |
| 19 to 25 Years | 0 (0.0%) | 40 (87.0%) |
| 25 to 34 Years | 8 (12.3%) | 57 (87.7%) |
| 35 to 44 Years | 51 (31.1%) | 102 (62.2%) |
| 45 to 54 Years | 5 (4.7%) | 91 (85.9%) |
| 55 to 64 Years | 26 (19.1%) | 112 (82.4%) |
| 65 to 74 Years | 179 (97.3%) | 134 (72.8%) |
| 75 Years and over | 107 (100.0%) | 65 (60.8%) |
| Total | 402 (39.2%) | 788 (76.8%) |
Disability Status by Sex by Age in East Gull Lake
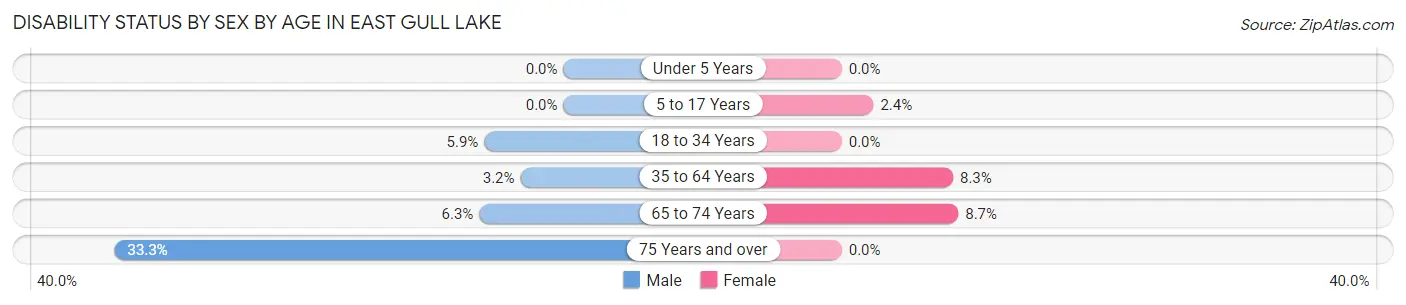
| Age Bracket | Male | Female |
| Under 5 Years | 0 (0.0%) | 0 (0.0%) |
| 5 to 17 Years | 0 (0.0%) | 2 (2.4%) |
| 18 to 34 Years | 4 (5.9%) | 0 (0.0%) |
| 35 to 64 Years | 6 (3.2%) | 18 (8.3%) |
| 65 to 74 Years | 5 (6.2%) | 9 (8.6%) |
| 75 Years and over | 19 (33.3%) | 0 (0.0%) |
Disability Class by Sex by Age in East Gull Lake
Disability Class: Hearing Difficulty
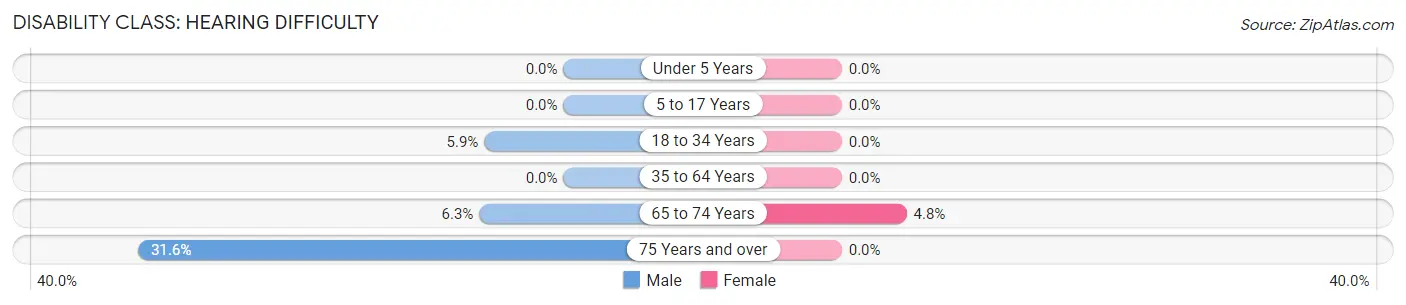
| Age Bracket | Male | Female |
| Under 5 Years | 0 (0.0%) | 0 (0.0%) |
| 5 to 17 Years | 0 (0.0%) | 0 (0.0%) |
| 18 to 34 Years | 4 (5.9%) | 0 (0.0%) |
| 35 to 64 Years | 0 (0.0%) | 0 (0.0%) |
| 65 to 74 Years | 5 (6.2%) | 5 (4.8%) |
| 75 Years and over | 18 (31.6%) | 0 (0.0%) |
Disability Class: Vision Difficulty
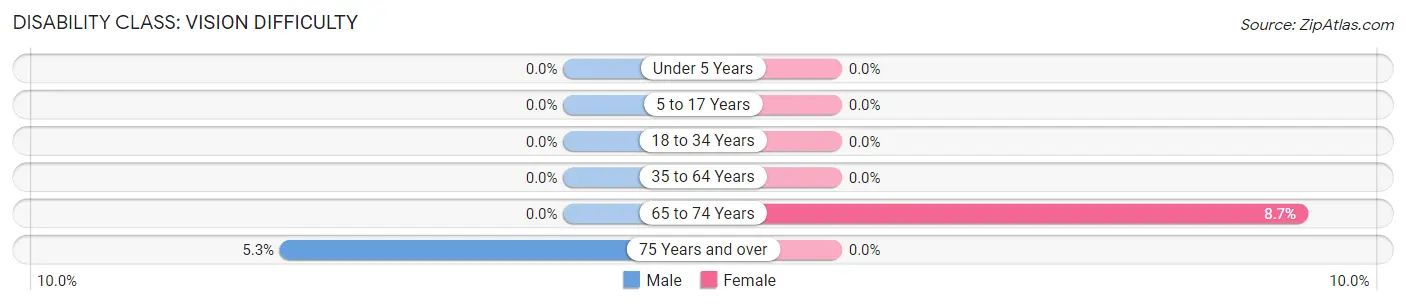
| Age Bracket | Male | Female |
| Under 5 Years | 0 (0.0%) | 0 (0.0%) |
| 5 to 17 Years | 0 (0.0%) | 0 (0.0%) |
| 18 to 34 Years | 0 (0.0%) | 0 (0.0%) |
| 35 to 64 Years | 0 (0.0%) | 0 (0.0%) |
| 65 to 74 Years | 0 (0.0%) | 9 (8.6%) |
| 75 Years and over | 3 (5.3%) | 0 (0.0%) |
Disability Class: Cognitive Difficulty
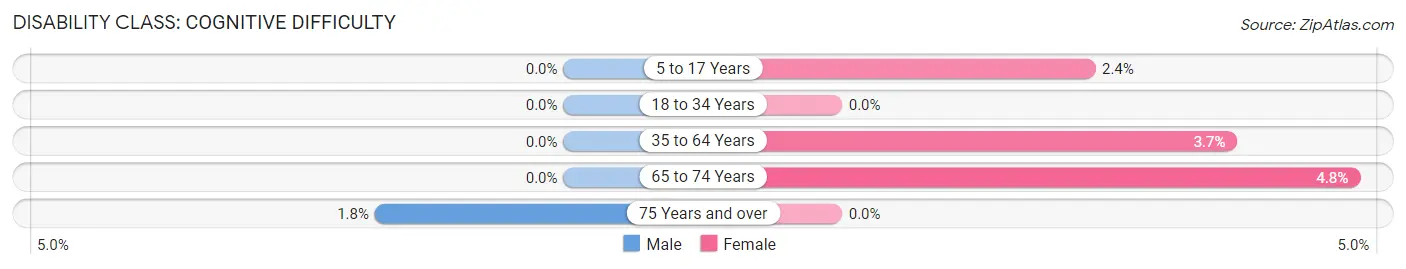
| Age Bracket | Male | Female |
| 5 to 17 Years | 0 (0.0%) | 2 (2.4%) |
| 18 to 34 Years | 0 (0.0%) | 0 (0.0%) |
| 35 to 64 Years | 0 (0.0%) | 8 (3.7%) |
| 65 to 74 Years | 0 (0.0%) | 5 (4.8%) |
| 75 Years and over | 1 (1.8%) | 0 (0.0%) |
Disability Class: Ambulatory Difficulty
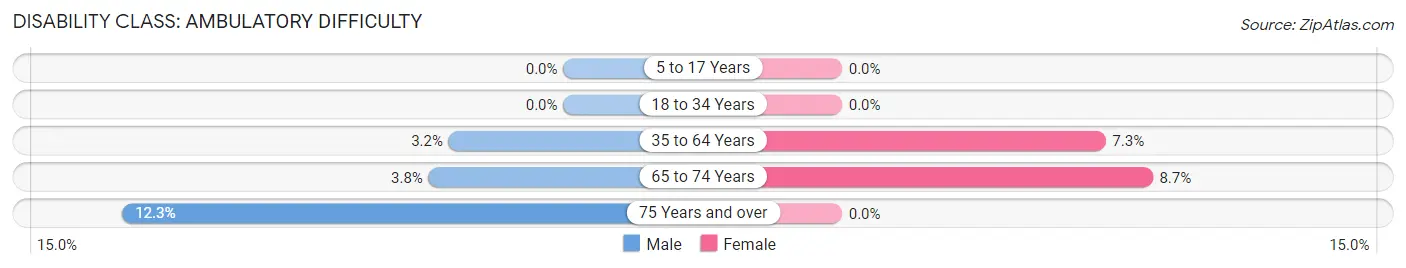
| Age Bracket | Male | Female |
| 5 to 17 Years | 0 (0.0%) | 0 (0.0%) |
| 18 to 34 Years | 0 (0.0%) | 0 (0.0%) |
| 35 to 64 Years | 6 (3.2%) | 16 (7.3%) |
| 65 to 74 Years | 3 (3.7%) | 9 (8.6%) |
| 75 Years and over | 7 (12.3%) | 0 (0.0%) |
Disability Class: Self-Care Difficulty
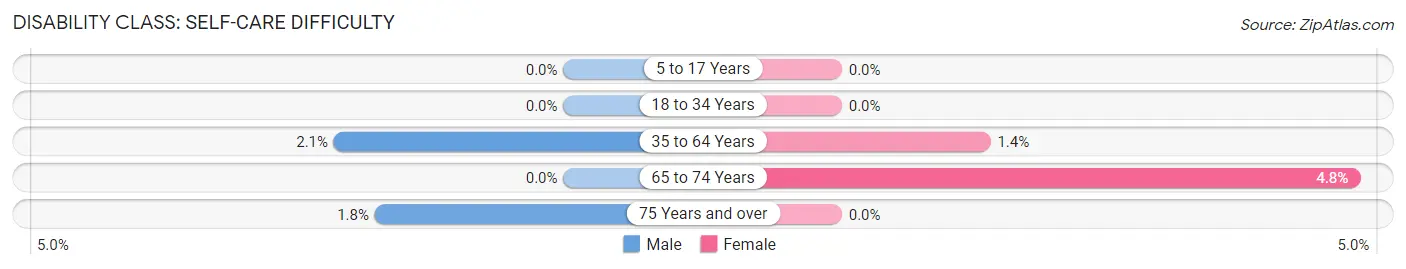
| Age Bracket | Male | Female |
| 5 to 17 Years | 0 (0.0%) | 0 (0.0%) |
| 18 to 34 Years | 0 (0.0%) | 0 (0.0%) |
| 35 to 64 Years | 4 (2.1%) | 3 (1.4%) |
| 65 to 74 Years | 0 (0.0%) | 5 (4.8%) |
| 75 Years and over | 1 (1.8%) | 0 (0.0%) |
Technology Access in East Gull Lake
Computing Device Access in East Gull Lake
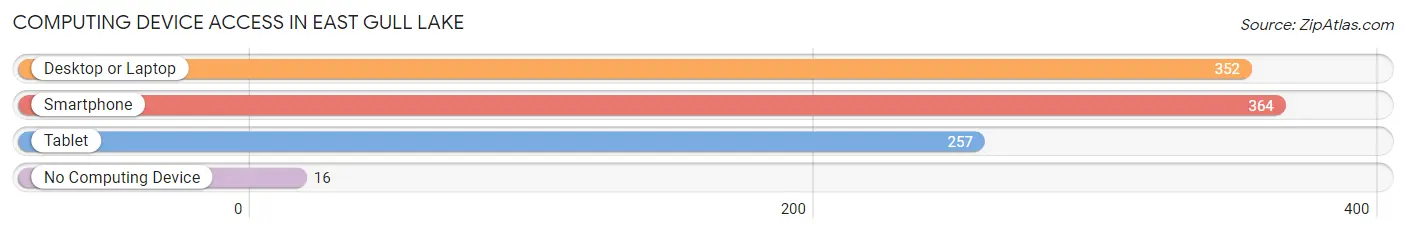
| Device Type | # Households | % Households |
| Desktop or Laptop | 352 | 89.1% |
| Smartphone | 364 | 92.1% |
| Tablet | 257 | 65.1% |
| No Computing Device | 16 | 4.1% |
| Total | 395 | 100.0% |
Internet Access in East Gull Lake
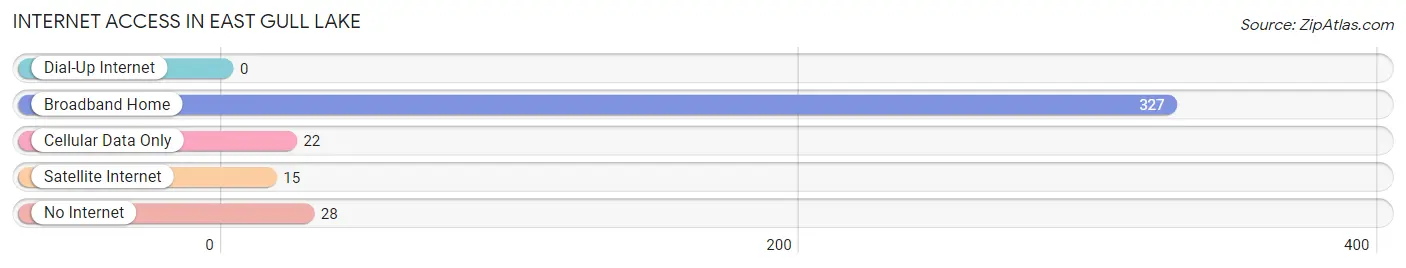
| Internet Type | # Households | % Households |
| Dial-Up Internet | 0 | 0.0% |
| Broadband Home | 327 | 82.8% |
| Cellular Data Only | 22 | 5.6% |
| Satellite Internet | 15 | 3.8% |
| No Internet | 28 | 7.1% |
| Total | 395 | 100.0% |
East Gull Lake Summary
East Gull Lake is a small city located in the state of Minnesota, United States. It is situated in the north-central part of the state, in the Brainerd Lakes area. The city is located in Crow Wing County, and is part of the Brainerd Micropolitan Statistical Area. As of the 2010 census, the population of East Gull Lake was 1,072.
History
East Gull Lake was first settled in the late 1800s by a group of Scandinavian immigrants. The area was originally known as Gull Lake Township, and was part of the larger Gull Lake Township. The first post office in the area was established in 1887, and the first school was built in 1891.
In the early 1900s, the area began to develop as a resort destination. The first resort was built in 1906, and by the 1920s, the area had become a popular destination for vacationers. The area was incorporated as a village in 1921, and the name was changed to East Gull Lake.
Geography
East Gull Lake is located at 46°30'N, 94°14'W (46.50, -94.23). The city is situated in the north-central part of Minnesota, in the Brainerd Lakes area. It is located in Crow Wing County, and is part of the Brainerd Micropolitan Statistical Area.
The city has a total area of 1.2 square miles, all of which is land. East Gull Lake is located on the eastern shore of Gull Lake, and is bordered by the cities of Nisswa to the north, and Breezy Point to the south.
Economy
The economy of East Gull Lake is largely based on tourism. The city is home to several resorts, as well as a variety of restaurants, shops, and other businesses catering to visitors. The city is also home to several marinas, which provide access to Gull Lake for boaters.
In addition to tourism, East Gull Lake is home to several manufacturing and industrial businesses. The city is home to a variety of manufacturing and industrial businesses, including a paper mill, a plastics factory, and a metal fabrication plant.
Demographics
As of the 2010 census, there were 1,072 people, 441 households, and 294 families residing in East Gull Lake. The population density was 890.2 people per square mile. The racial makeup of the city was 97.2% White, 0.7% African American, 0.3% Native American, 0.3% Asian, 0.1% Pacific Islander, 0.3% from other races, and 1.2% from two or more races. Hispanic or Latino of any race were 1.2% of the population.
The median age in East Gull Lake was 48.2 years. 22.2% of residents were under the age of 18; 5.3% were between the ages of 18 and 24; 19.2% were from 25 to 44; 33.2% were from 45 to 64; and 20.1% were 65 years of age or older. The gender makeup of the city was 48.7% male and 51.3% female.
The median income for a household in East Gull Lake was $45,000, and the median income for a family was $51,250. Males had a median income of $37,500 versus $25,000 for females. The per capita income for the city was $22,845. About 4.2% of families and 6.2% of the population were below the poverty line, including 8.3% of those under age 18 and 4.2% of those age 65 or over.
Common Questions
What is the Total Population of East Gull Lake?
Total Population of East Gull Lake is 1,027.
What is the Total Male Population of East Gull Lake?
Total Male Population of East Gull Lake is 484.
What is the Total Female Population of East Gull Lake?
Total Female Population of East Gull Lake is 543.
What is the Ratio of Males per 100 Females in East Gull Lake?
There are 89.13 Males per 100 Females in East Gull Lake.
What is the Ratio of Females per 100 Males in East Gull Lake?
There are 112.19 Females per 100 Males in East Gull Lake.
What is the Median Population Age in East Gull Lake?
Median Population Age in East Gull Lake is 47.2 Years.
What is the Average Family Size in East Gull Lake
Average Family Size in East Gull Lake is 2.9 People.
What is the Average Household Size in East Gull Lake
Average Household Size in East Gull Lake is 2.6 People.
What is Per Capita Income in East Gull Lake?
Per Capita income in East Gull Lake is $51,309.
What is the Median Family Income in East Gull Lake?
Median Family Income in East Gull Lake is $112,344.
What is the Median Household income in East Gull Lake?
Median Household Income in East Gull Lake is $109,750.
What is Income or Wage Gap in East Gull Lake?
Income or Wage Gap in East Gull Lake is 42.0%.
Women in East Gull Lake earn 58.0 cents for every dollar earned by a man.
What is Inequality or Gini Index in East Gull Lake?
Inequality or Gini Index in East Gull Lake is 0.41.
How Large is the Labor Force in East Gull Lake?
There are 525 People in the Labor Forcein in East Gull Lake.
What is the Percentage of People in the Labor Force in East Gull Lake?
61.4% of People are in the Labor Force in East Gull Lake.
What is the Unemployment Rate in East Gull Lake?
Unemployment Rate in East Gull Lake is 2.9%.