Sasser, GA
Sasser Map
Sasser Overview
345
TOTAL POPULATION
160
MALE POPULATION
185
FEMALE POPULATION
86.49
MALES / 100 FEMALES
115.62
FEMALES / 100 MALES
47.7
MEDIAN AGE
2.9
AVG FAMILY SIZE
2.0
AVG HOUSEHOLD SIZE
$21,789
PER CAPITA INCOME
$36,292
AVG FAMILY INCOME
$27,442
AVG HOUSEHOLD INCOME
0.41
INEQUALITY / GINI INDEX
189
LABOR FORCE [ PEOPLE ]
66.5%
PERCENT IN LABOR FORCE
16.9%
UNEMPLOYMENT RATE
Sasser Zip Codes
Sasser Area Codes
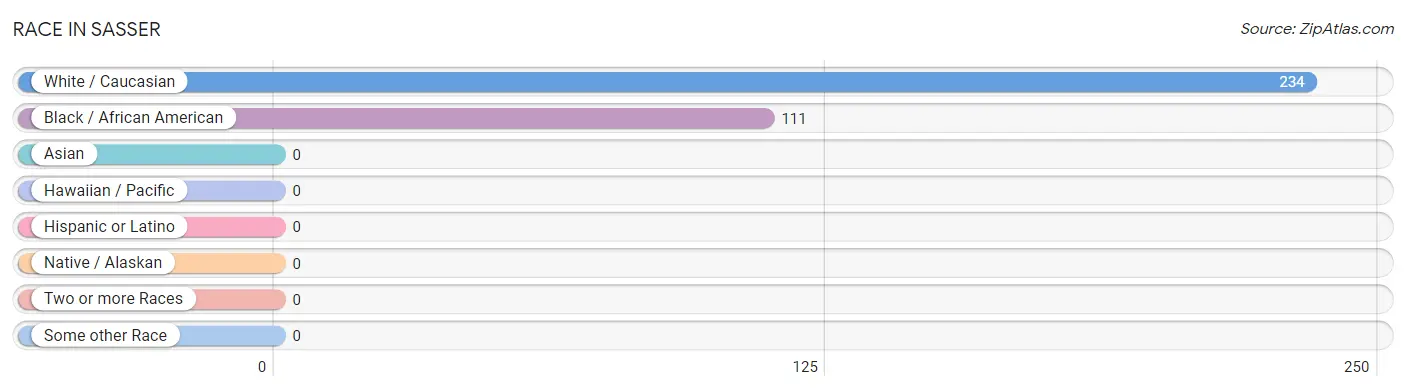
Race in Sasser
The most populous races in Sasser are White / Caucasian (234 | 67.8%), and Black / African American (111 | 32.2%).
| Race | # Population | % Population |
| Asian | 0 | 0.0% |
| Black / African American | 111 | 32.2% |
| Hawaiian / Pacific | 0 | 0.0% |
| Hispanic or Latino | 0 | 0.0% |
| Native / Alaskan | 0 | 0.0% |
| White / Caucasian | 234 | 67.8% |
| Two or more Races | 0 | 0.0% |
| Some other Race | 0 | 0.0% |
| Total | 345 | 100.0% |
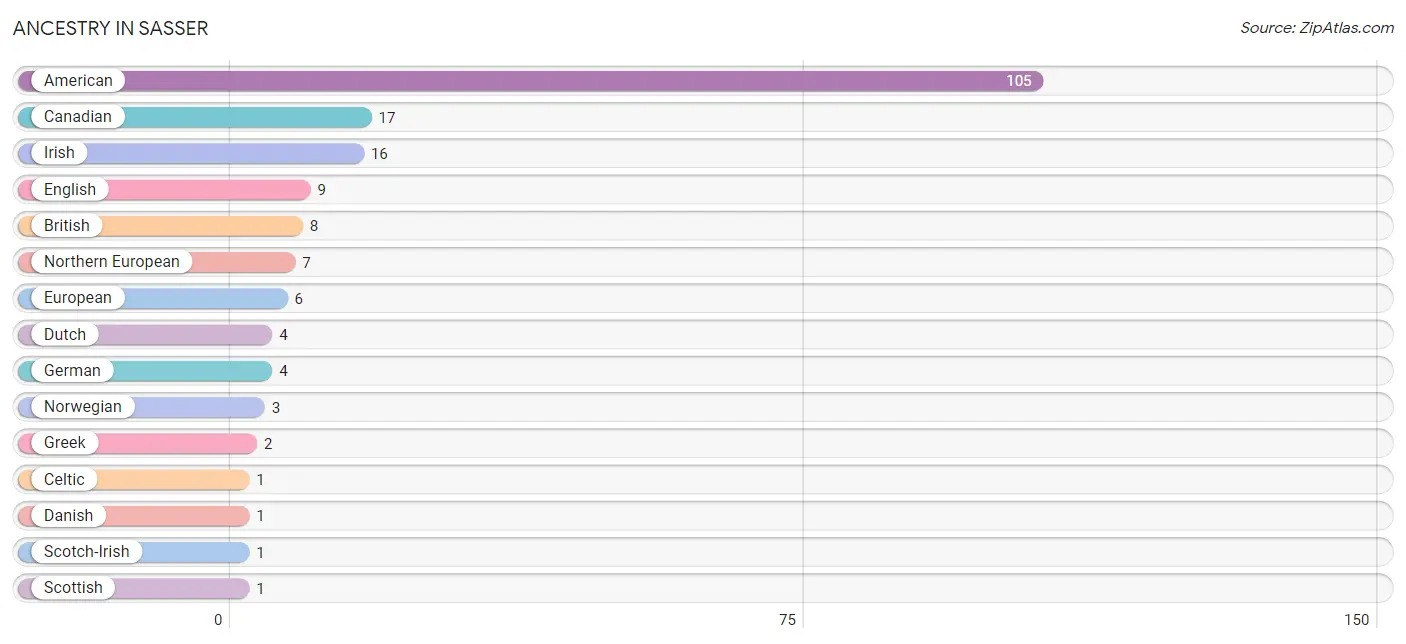
Ancestry in Sasser
The most populous ancestries reported in Sasser are American (105 | 30.4%), Canadian (17 | 4.9%), Irish (16 | 4.6%), English (9 | 2.6%), and British (8 | 2.3%), together accounting for 44.9% of all Sasser residents.
| Ancestry | # Population | % Population |
| American | 105 | 30.4% |
| British | 8 | 2.3% |
| Canadian | 17 | 4.9% |
| Celtic | 1 | 0.3% |
| Danish | 1 | 0.3% |
| Dutch | 4 | 1.2% |
| English | 9 | 2.6% |
| European | 6 | 1.7% |
| German | 4 | 1.2% |
| Greek | 2 | 0.6% |
| Irish | 16 | 4.6% |
| Northern European | 7 | 2.0% |
| Norwegian | 3 | 0.9% |
| Scotch-Irish | 1 | 0.3% |
| Scottish | 1 | 0.3% | View All 15 Rows |
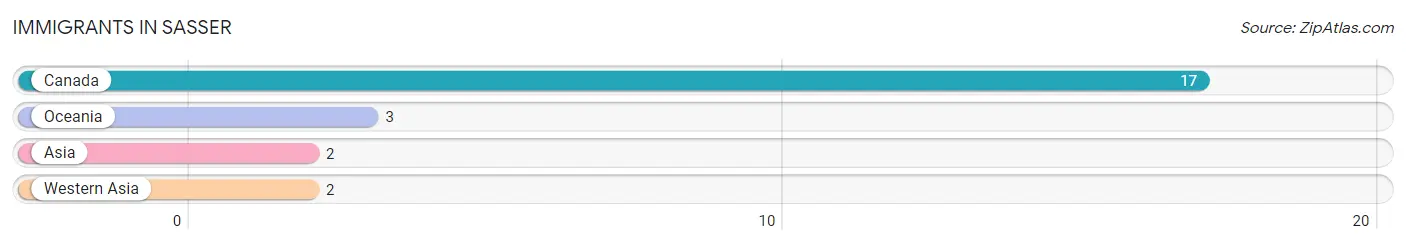
Immigrants in Sasser
The most numerous immigrant groups reported in Sasser came from Canada (17 | 4.9%), Oceania (3 | 0.9%), Asia (2 | 0.6%), and Western Asia (2 | 0.6%), together accounting for 7.0% of all Sasser residents.
| Immigration Origin | # Population | % Population |
| Asia | 2 | 0.6% |
| Canada | 17 | 4.9% |
| Oceania | 3 | 0.9% |
| Western Asia | 2 | 0.6% | View All 4 Rows |
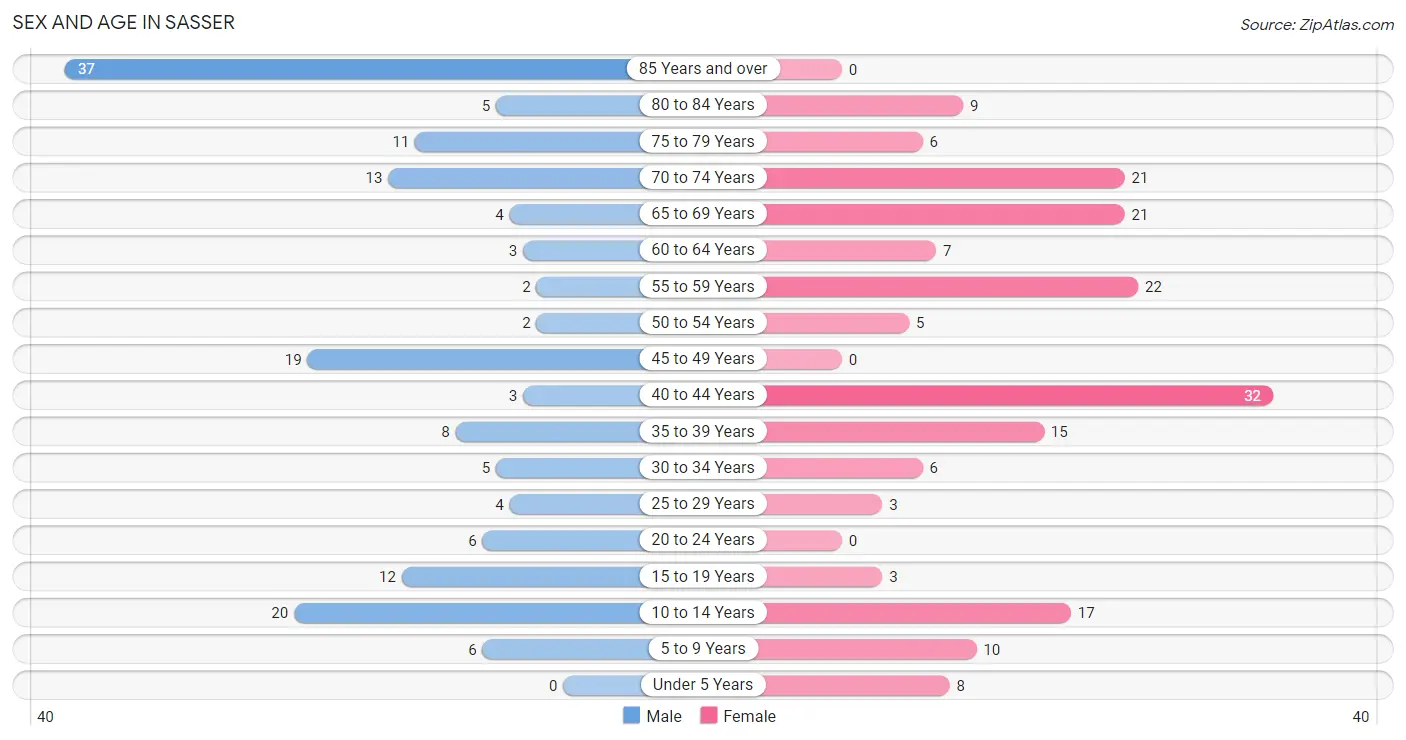
Sex and Age in Sasser
Sex and Age in Sasser
The most populous age groups in Sasser are 85 Years and over (37 | 23.1%) for men and 40 to 44 Years (32 | 17.3%) for women.
| Age Bracket | Male | Female |
| Under 5 Years | 0 (0.0%) | 8 (4.3%) |
| 5 to 9 Years | 6 (3.7%) | 10 (5.4%) |
| 10 to 14 Years | 20 (12.5%) | 17 (9.2%) |
| 15 to 19 Years | 12 (7.5%) | 3 (1.6%) |
| 20 to 24 Years | 6 (3.7%) | 0 (0.0%) |
| 25 to 29 Years | 4 (2.5%) | 3 (1.6%) |
| 30 to 34 Years | 5 (3.1%) | 6 (3.2%) |
| 35 to 39 Years | 8 (5.0%) | 15 (8.1%) |
| 40 to 44 Years | 3 (1.9%) | 32 (17.3%) |
| 45 to 49 Years | 19 (11.9%) | 0 (0.0%) |
| 50 to 54 Years | 2 (1.3%) | 5 (2.7%) |
| 55 to 59 Years | 2 (1.3%) | 22 (11.9%) |
| 60 to 64 Years | 3 (1.9%) | 7 (3.8%) |
| 65 to 69 Years | 4 (2.5%) | 21 (11.4%) |
| 70 to 74 Years | 13 (8.1%) | 21 (11.4%) |
| 75 to 79 Years | 11 (6.9%) | 6 (3.2%) |
| 80 to 84 Years | 5 (3.1%) | 9 (4.9%) |
| 85 Years and over | 37 (23.1%) | 0 (0.0%) |
| Total | 160 (100.0%) | 185 (100.0%) |
Families and Households in Sasser
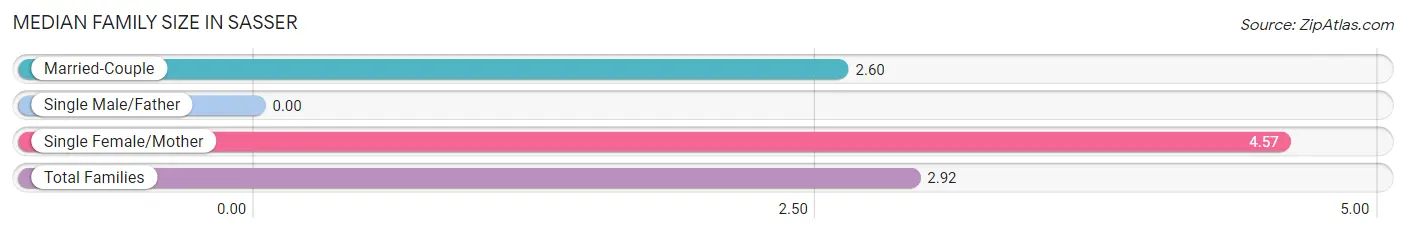
Median Family Size in Sasser
| Family Type | # Families | Family Size |
| Married-Couple | 73 (83.9%) | 2.60 |
| Single Male/Father | 0 (0.0%) | - |
| Single Female/Mother | 14 (16.1%) | 4.57 |
| Total Families | 87 (100.0%) | 2.92 |
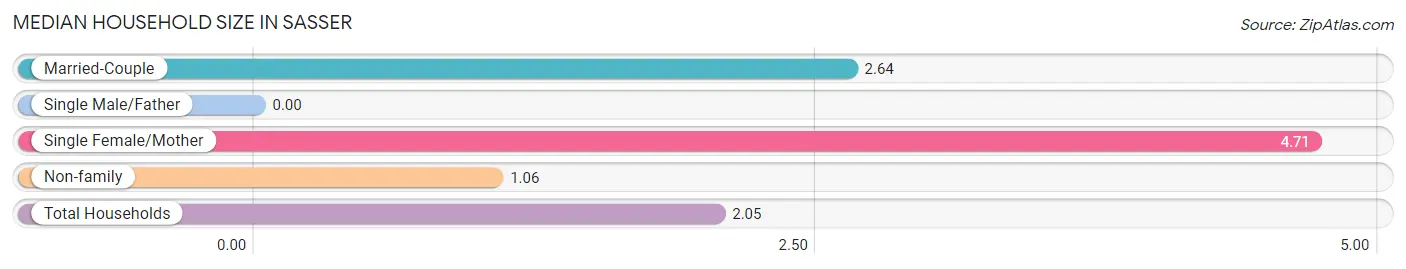
Median Household Size in Sasser
| Household Type | # Households | Household Size |
| Married-Couple | 73 (43.4%) | 2.64 |
| Single Male/Father | 0 (0.0%) | - |
| Single Female/Mother | 14 (8.3%) | 4.71 |
| Non-family | 81 (48.2%) | 1.06 |
| Total Households | 168 (100.0%) | 2.05 |
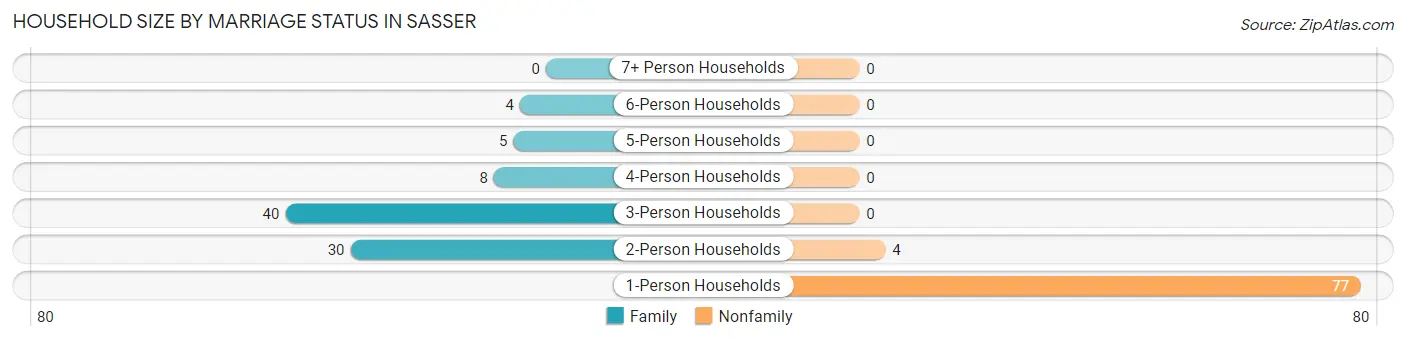
Household Size by Marriage Status in Sasser
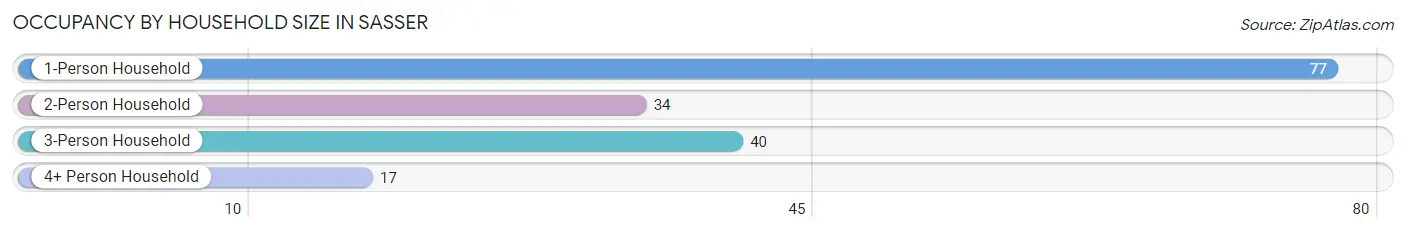
Out of a total of 168 households in Sasser, 87 (51.8%) are family households, while 81 (48.2%) are nonfamily households. The most numerous type of family households are 3-person households, comprising 40, and the most common type of nonfamily households are 1-person households, comprising 77.
| Household Size | Family Households | Nonfamily Households |
| 1-Person Households | - | 77 (45.8%) |
| 2-Person Households | 30 (17.9%) | 4 (2.4%) |
| 3-Person Households | 40 (23.8%) | 0 (0.0%) |
| 4-Person Households | 8 (4.8%) | 0 (0.0%) |
| 5-Person Households | 5 (3.0%) | 0 (0.0%) |
| 6-Person Households | 4 (2.4%) | 0 (0.0%) |
| 7+ Person Households | 0 (0.0%) | 0 (0.0%) |
| Total | 87 (51.8%) | 81 (48.2%) |
Female Fertility in Sasser
Fertility by Age in Sasser
| Age Bracket | Women with Births | Births / 1,000 Women |
| 15 to 19 years | 0 (0.0%) | 0.0 |
| 20 to 34 years | 0 (0.0%) | 0.0 |
| 35 to 50 years | 0 (0.0%) | 0.0 |
| Total | 0 (0.0%) | 0.0 |
Fertility by Age by Marriage Status in Sasser
| Age Bracket | Married | Unmarried |
| 15 to 19 years | 0 (0.0%) | 0 (0.0%) |
| 20 to 34 years | 0 (0.0%) | 0 (0.0%) |
| 35 to 50 years | 0 (0.0%) | 0 (0.0%) |
| Total | 0 (0.0%) | 0 (0.0%) |
Fertility by Education in Sasser
| Educational Attainment | Women with Births | Births / 1,000 Women |
| Less than High School | 0 (0.0%) | 0.0 |
| High School Diploma | 0 (0.0%) | 0.0 |
| College or Associate's Degree | 0 (0.0%) | 0.0 |
| Bachelor's Degree | 0 (0.0%) | 0.0 |
| Graduate Degree | 0 (0.0%) | 0.0 |
| Total | 0 (0.0%) | 0.0 |
Fertility by Education by Marriage Status in Sasser
| Educational Attainment | Married | Unmarried |
| Less than High School | 0 (0.0%) | 0 (0.0%) |
| High School Diploma | 0 (0.0%) | 0 (0.0%) |
| College or Associate's Degree | 0 (0.0%) | 0 (0.0%) |
| Bachelor's Degree | 0 (0.0%) | 0 (0.0%) |
| Graduate Degree | 0 (0.0%) | 0 (0.0%) |
| Total | 0 (0.0%) | 0 (0.0%) |
Income in Sasser
Income Overview in Sasser
Per Capita Income in Sasser is $21,789, while median incomes of families and households are $36,292 and $27,442 respectively.
| Characteristic | Number | Measure |
| Per Capita Income | 345 | $21,789 |
| Median Family Income | 87 | $36,292 |
| Mean Family Income | 87 | $58,941 |
| Median Household Income | 168 | $27,442 |
| Mean Household Income | 168 | $44,179 |
| Income Deficit | 87 | $0 |
| Wage / Income Gap (%) | 345 | 0.00% |
| Wage / Income Gap ($) | 345 | 100.00¢ per $1 |
| Gini / Inequality Index | 345 | 0.41 |
Earnings by Sex in Sasser
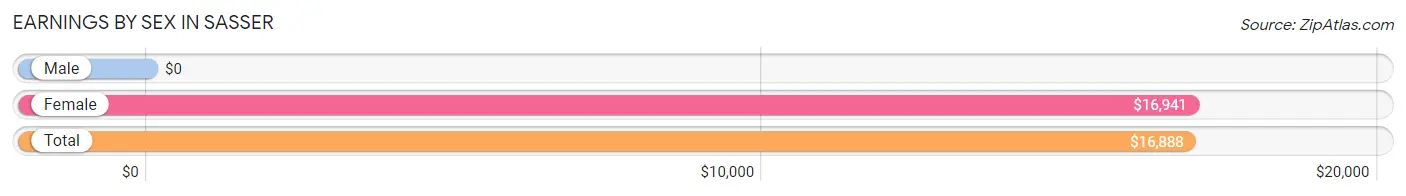
| Sex | Number | Average Earnings |
| Male | 98 (50.3%) | $0 |
| Female | 97 (49.7%) | $16,941 |
| Total | 195 (100.0%) | $16,888 |
Earnings by Sex by Income Bracket in Sasser
The most common earnings brackets in Sasser are $2,499 or less for men (47 | 48.0%) and $15,000 to $17,499 for women (47 | 48.4%).
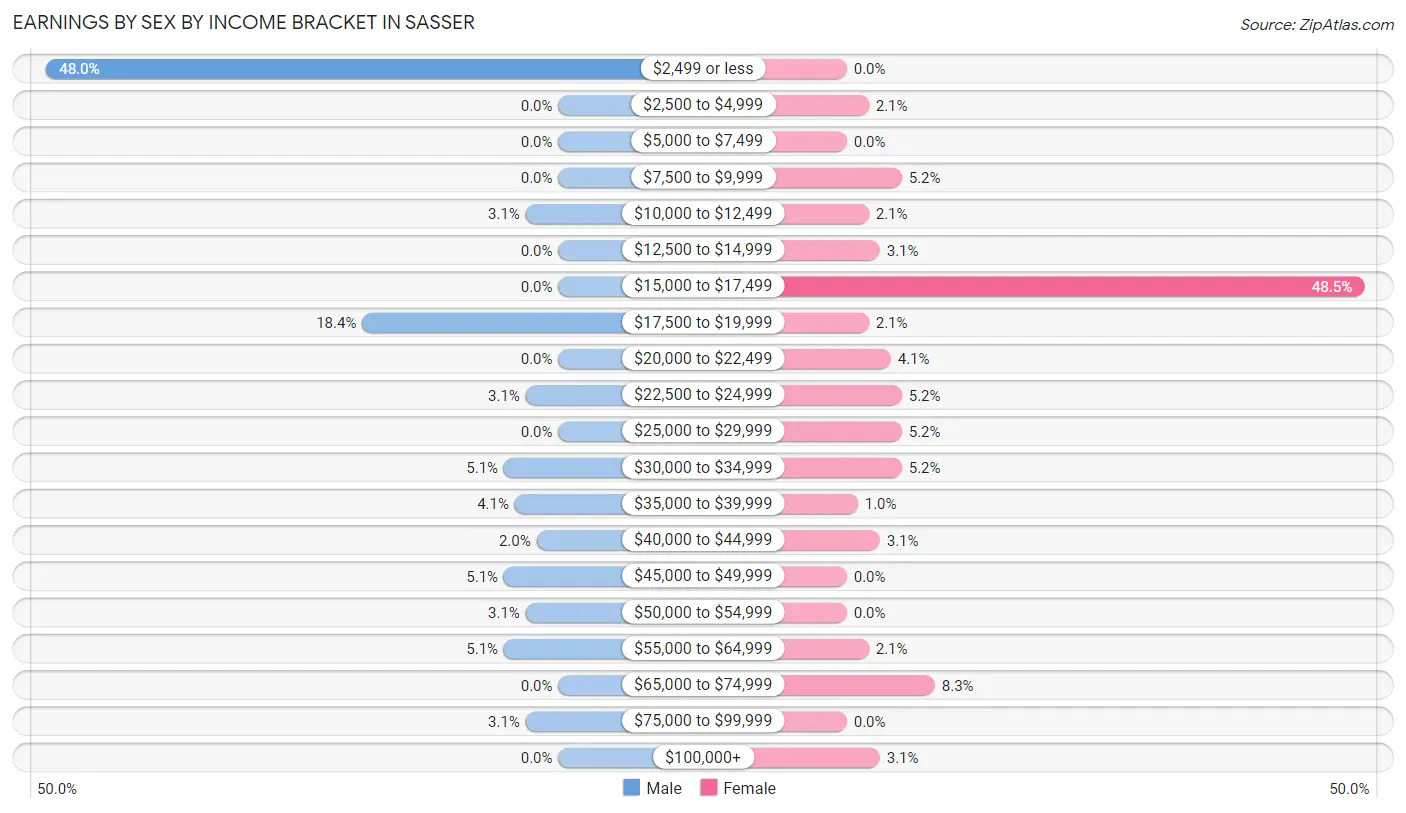
| Income | Male | Female |
| $2,499 or less | 47 (48.0%) | 0 (0.0%) |
| $2,500 to $4,999 | 0 (0.0%) | 2 (2.1%) |
| $5,000 to $7,499 | 0 (0.0%) | 0 (0.0%) |
| $7,500 to $9,999 | 0 (0.0%) | 5 (5.1%) |
| $10,000 to $12,499 | 3 (3.1%) | 2 (2.1%) |
| $12,500 to $14,999 | 0 (0.0%) | 3 (3.1%) |
| $15,000 to $17,499 | 0 (0.0%) | 47 (48.4%) |
| $17,500 to $19,999 | 18 (18.4%) | 2 (2.1%) |
| $20,000 to $22,499 | 0 (0.0%) | 4 (4.1%) |
| $22,500 to $24,999 | 3 (3.1%) | 5 (5.1%) |
| $25,000 to $29,999 | 0 (0.0%) | 5 (5.1%) |
| $30,000 to $34,999 | 5 (5.1%) | 5 (5.1%) |
| $35,000 to $39,999 | 4 (4.1%) | 1 (1.0%) |
| $40,000 to $44,999 | 2 (2.0%) | 3 (3.1%) |
| $45,000 to $49,999 | 5 (5.1%) | 0 (0.0%) |
| $50,000 to $54,999 | 3 (3.1%) | 0 (0.0%) |
| $55,000 to $64,999 | 5 (5.1%) | 2 (2.1%) |
| $65,000 to $74,999 | 0 (0.0%) | 8 (8.3%) |
| $75,000 to $99,999 | 3 (3.1%) | 0 (0.0%) |
| $100,000+ | 0 (0.0%) | 3 (3.1%) |
| Total | 98 (100.0%) | 97 (100.0%) |
Earnings by Sex by Educational Attainment in Sasser
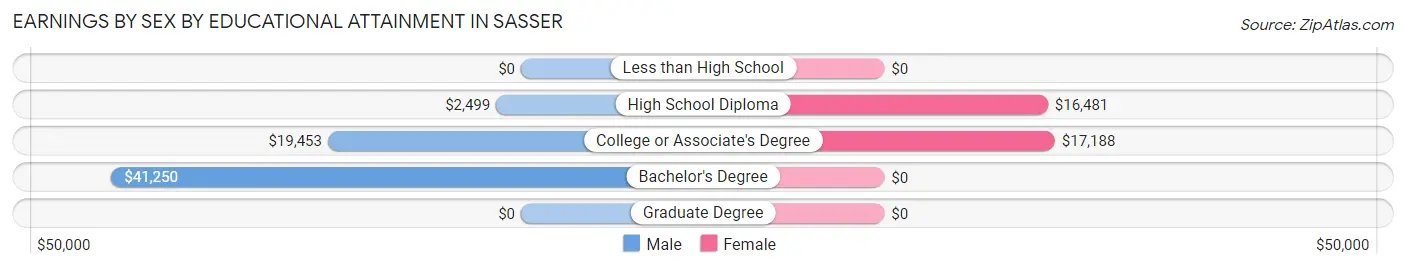
| Educational Attainment | Male Income | Female Income |
| Less than High School | - | - |
| High School Diploma | $2,499 | $16,481 |
| College or Associate's Degree | $19,453 | $17,188 |
| Bachelor's Degree | $41,250 | $0 |
| Graduate Degree | - | - |
| Total | - | - |
Family Income in Sasser
Family Income Brackets in Sasser
According to the Sasser family income data, there are 35 families falling into the $35,000 to $49,999 income range, which is the most common income bracket and makes up 40.2% of all families.
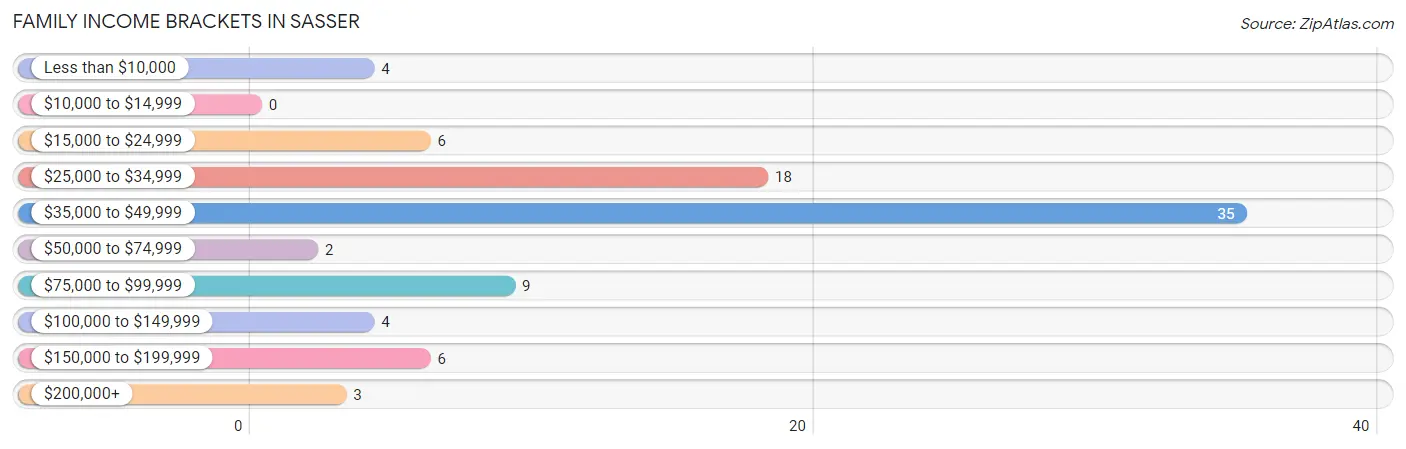
| Income Bracket | # Families | % Families |
| Less than $10,000 | 4 | 4.6% |
| $10,000 to $14,999 | 0 | 0.0% |
| $15,000 to $24,999 | 6 | 6.9% |
| $25,000 to $34,999 | 18 | 20.7% |
| $35,000 to $49,999 | 35 | 40.2% |
| $50,000 to $74,999 | 2 | 2.3% |
| $75,000 to $99,999 | 9 | 10.3% |
| $100,000 to $149,999 | 4 | 4.6% |
| $150,000 to $199,999 | 6 | 6.9% |
| $200,000+ | 3 | 3.4% |
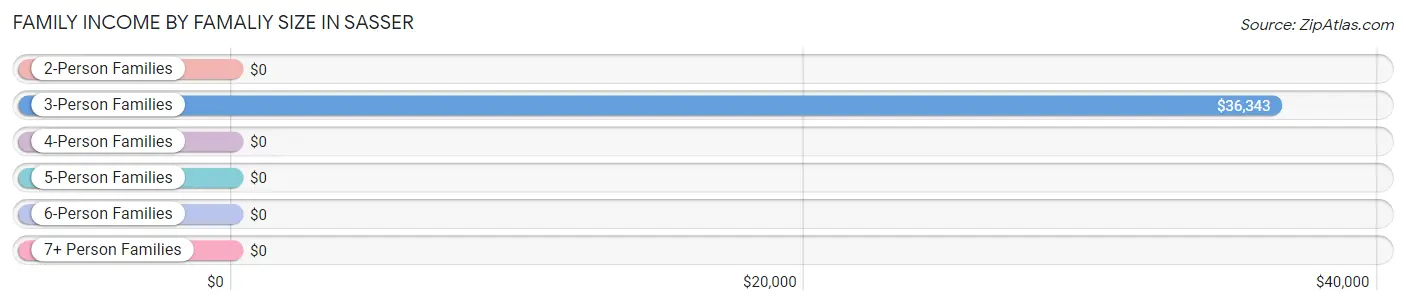
Family Income by Famaliy Size in Sasser
3-person families (43 | 49.4%) account for the highest median family income in Sasser with $36,343 per family, while 3-person families (43 | 49.4%) have the highest median income of $12,114 per family member.
| Income Bracket | # Families | Median Income |
| 2-Person Families | 30 (34.5%) | $0 |
| 3-Person Families | 43 (49.4%) | $36,343 |
| 4-Person Families | 7 (8.1%) | $0 |
| 5-Person Families | 3 (3.5%) | $0 |
| 6-Person Families | 4 (4.6%) | $0 |
| 7+ Person Families | 0 (0.0%) | $0 |
| Total | 87 (100.0%) | $36,292 |
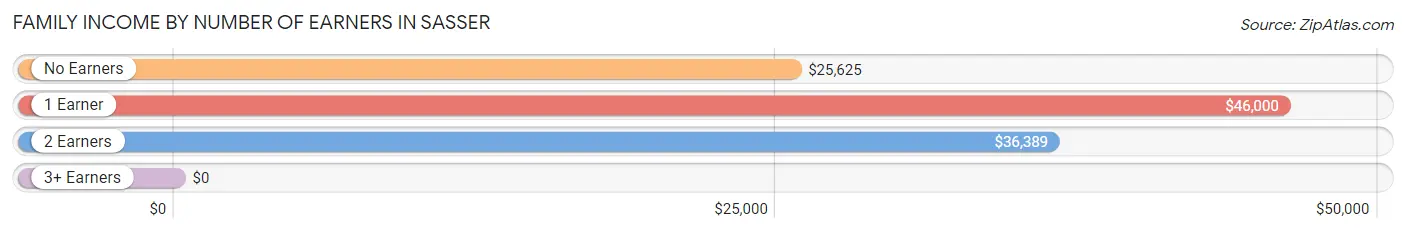
Family Income by Number of Earners in Sasser
| Number of Earners | # Families | Median Income |
| No Earners | 12 (13.8%) | $25,625 |
| 1 Earner | 28 (32.2%) | $46,000 |
| 2 Earners | 44 (50.6%) | $36,389 |
| 3+ Earners | 3 (3.5%) | $0 |
| Total | 87 (100.0%) | $36,292 |
Household Income in Sasser
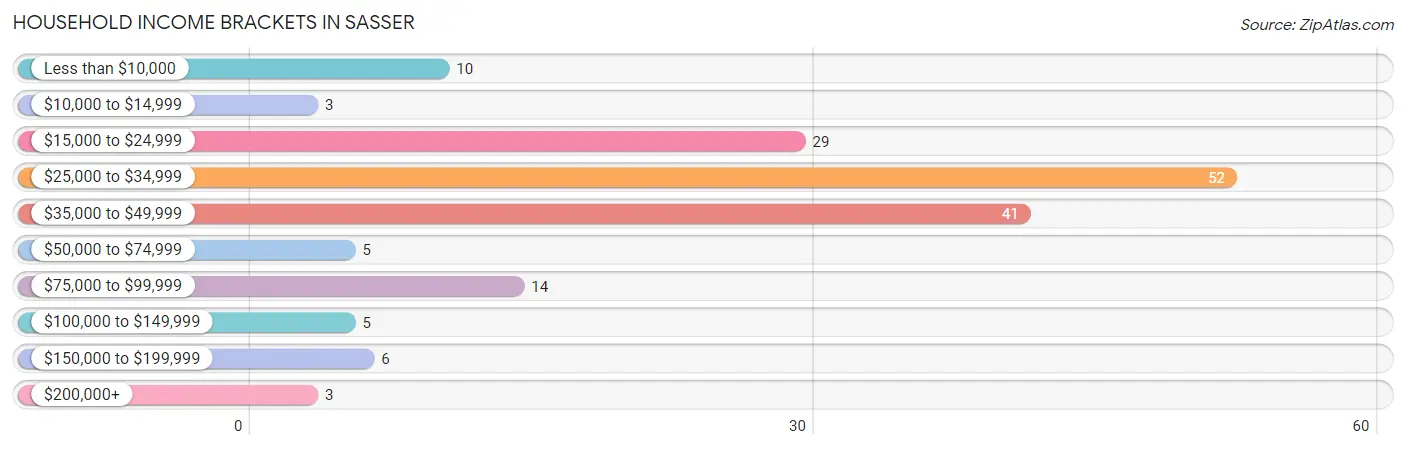
Household Income Brackets in Sasser
With 52 households falling in the category, the $25,000 to $34,999 income range is the most frequent in Sasser, accounting for 30.9% of all households. In contrast, only 3 households (1.8%) fall into the $10,000 to $14,999 income bracket, making it the least populous group.
| Income Bracket | # Households | % Households |
| Less than $10,000 | 10 | 6.0% |
| $10,000 to $14,999 | 3 | 1.8% |
| $15,000 to $24,999 | 29 | 17.3% |
| $25,000 to $34,999 | 52 | 31.0% |
| $35,000 to $49,999 | 41 | 24.4% |
| $50,000 to $74,999 | 5 | 3.0% |
| $75,000 to $99,999 | 14 | 8.3% |
| $100,000 to $149,999 | 5 | 3.0% |
| $150,000 to $199,999 | 6 | 3.6% |
| $200,000+ | 3 | 1.8% |
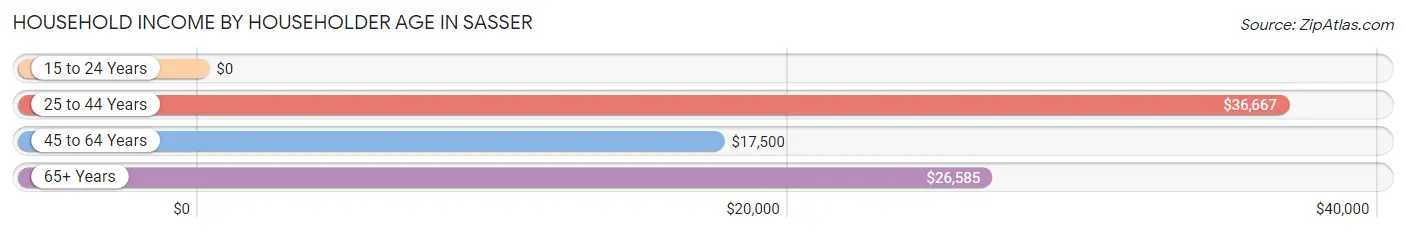
Household Income by Householder Age in Sasser
The median household income in Sasser is $27,442, with the highest median household income of $36,667 found in the 25 to 44 years age bracket for the primary householder. A total of 54 households (32.1%) fall into this category.
| Income Bracket | # Households | Median Income |
| 15 to 24 Years | 0 (0.0%) | $0 |
| 25 to 44 Years | 54 (32.1%) | $36,667 |
| 45 to 64 Years | 34 (20.2%) | $17,500 |
| 65+ Years | 80 (47.6%) | $26,585 |
| Total | 168 (100.0%) | $27,442 |
Poverty in Sasser
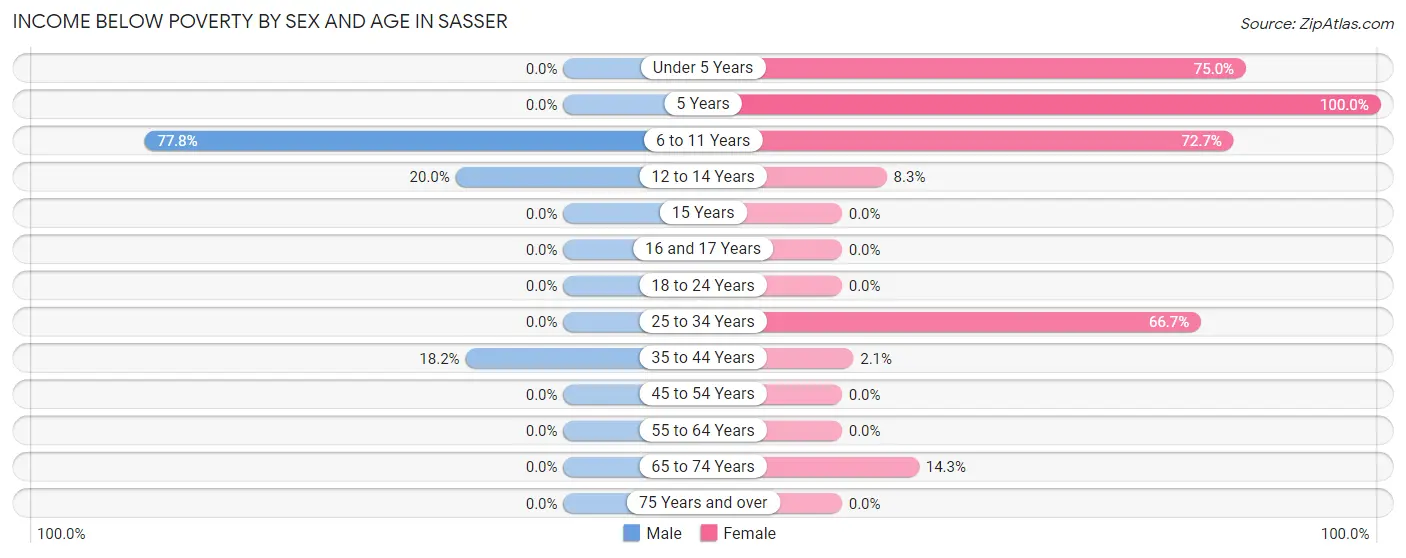
Income Below Poverty by Sex and Age in Sasser
With 7.5% poverty level for males and 17.3% for females among the residents of Sasser, 6 to 11 year old males and 5 year old females are the most vulnerable to poverty, with 7 males (77.8%) and 4 females (100.0%) in their respective age groups living below the poverty level.
| Age Bracket | Male | Female |
| Under 5 Years | 0 (0.0%) | 6 (75.0%) |
| 5 Years | 0 (0.0%) | 4 (100.0%) |
| 6 to 11 Years | 7 (77.8%) | 8 (72.7%) |
| 12 to 14 Years | 3 (20.0%) | 1 (8.3%) |
| 15 Years | 0 (0.0%) | 0 (0.0%) |
| 16 and 17 Years | 0 (0.0%) | 0 (0.0%) |
| 18 to 24 Years | 0 (0.0%) | 0 (0.0%) |
| 25 to 34 Years | 0 (0.0%) | 6 (66.7%) |
| 35 to 44 Years | 2 (18.2%) | 1 (2.1%) |
| 45 to 54 Years | 0 (0.0%) | 0 (0.0%) |
| 55 to 64 Years | 0 (0.0%) | 0 (0.0%) |
| 65 to 74 Years | 0 (0.0%) | 6 (14.3%) |
| 75 Years and over | 0 (0.0%) | 0 (0.0%) |
| Total | 12 (7.5%) | 32 (17.3%) |
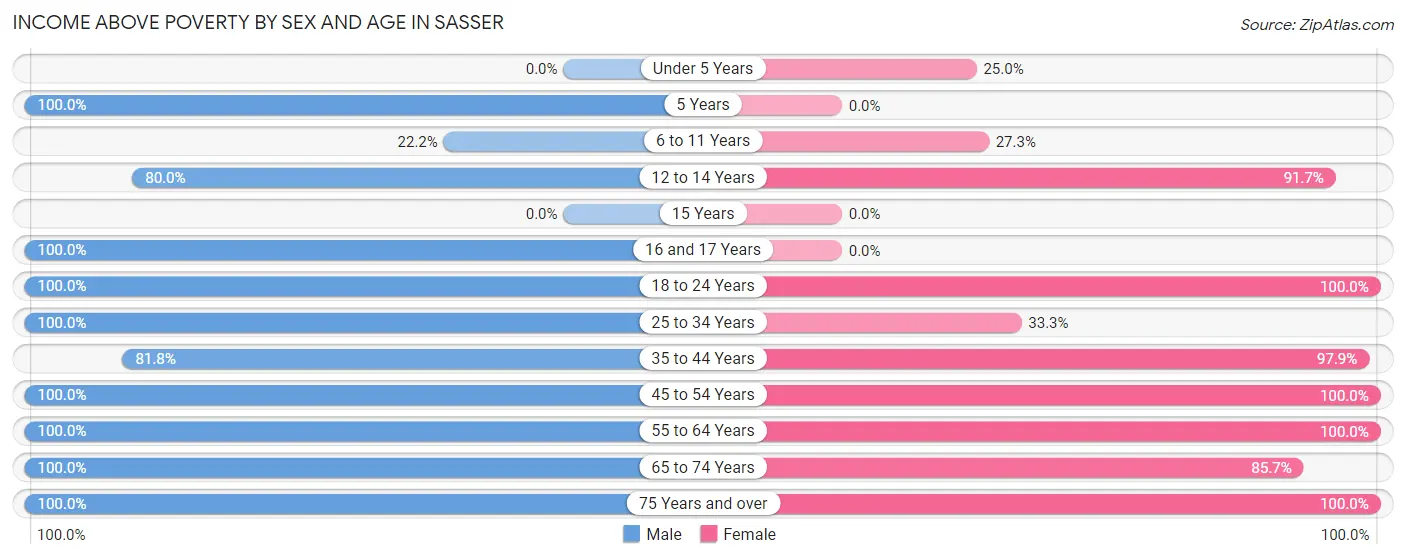
Income Above Poverty by Sex and Age in Sasser
According to the poverty statistics in Sasser, males aged 5 years and females aged 18 to 24 years are the age groups that are most secure financially, with 100.0% of males and 100.0% of females in these age groups living above the poverty line.
| Age Bracket | Male | Female |
| Under 5 Years | 0 (0.0%) | 2 (25.0%) |
| 5 Years | 2 (100.0%) | 0 (0.0%) |
| 6 to 11 Years | 2 (22.2%) | 3 (27.3%) |
| 12 to 14 Years | 12 (80.0%) | 11 (91.7%) |
| 15 Years | 0 (0.0%) | 0 (0.0%) |
| 16 and 17 Years | 8 (100.0%) | 0 (0.0%) |
| 18 to 24 Years | 10 (100.0%) | 3 (100.0%) |
| 25 to 34 Years | 9 (100.0%) | 3 (33.3%) |
| 35 to 44 Years | 9 (81.8%) | 46 (97.9%) |
| 45 to 54 Years | 21 (100.0%) | 5 (100.0%) |
| 55 to 64 Years | 5 (100.0%) | 29 (100.0%) |
| 65 to 74 Years | 17 (100.0%) | 36 (85.7%) |
| 75 Years and over | 53 (100.0%) | 15 (100.0%) |
| Total | 148 (92.5%) | 153 (82.7%) |
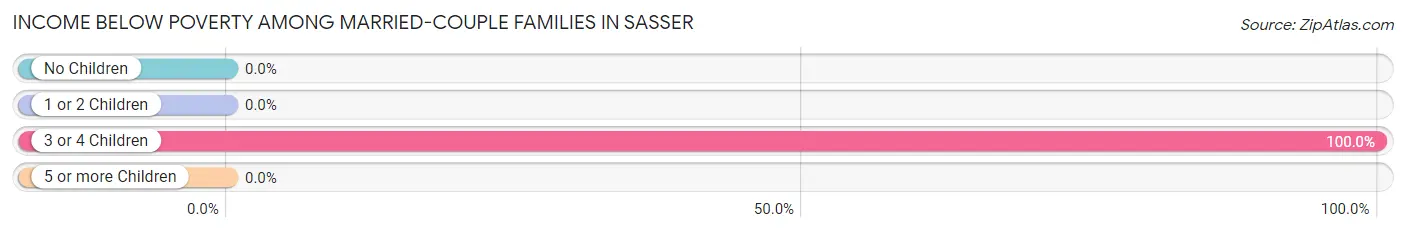
Income Below Poverty Among Married-Couple Families in Sasser
The poverty statistics for married-couple families in Sasser show that 2.7% or 2 of the total 73 families live below the poverty line. Families with 3 or 4 children have the highest poverty rate of 100.0%, comprising of 2 families. On the other hand, families with no children have the lowest poverty rate of 0.0%, which includes 0 families.
| Children | Above Poverty | Below Poverty |
| No Children | 31 (100.0%) | 0 (0.0%) |
| 1 or 2 Children | 40 (100.0%) | 0 (0.0%) |
| 3 or 4 Children | 0 (0.0%) | 2 (100.0%) |
| 5 or more Children | 0 (0.0%) | 0 (0.0%) |
| Total | 71 (97.3%) | 2 (2.7%) |
Income Below Poverty Among Single-Parent Households in Sasser
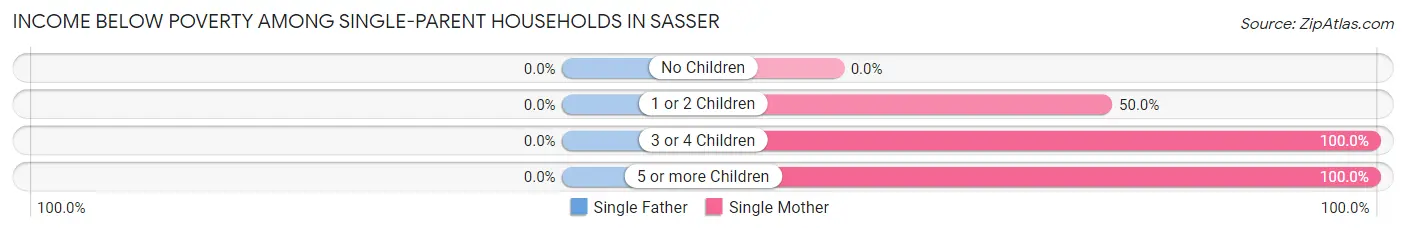
| Children | Single Father | Single Mother |
| No Children | 0 (0.0%) | 0 (0.0%) |
| 1 or 2 Children | 0 (0.0%) | 2 (50.0%) |
| 3 or 4 Children | 0 (0.0%) | 1 (100.0%) |
| 5 or more Children | 0 (0.0%) | 2 (100.0%) |
| Total | 0 (0.0%) | 5 (35.7%) |
Income Below Poverty Among Married-Couple vs Single-Parent Households in Sasser
The poverty data for Sasser shows that 2 of the married-couple family households (2.7%) and 5 of the single-parent households (35.7%) are living below the poverty level. Within the married-couple family households, those with 3 or 4 children have the highest poverty rate, with 2 households (100.0%) falling below the poverty line. Among the single-parent households, those with 3 or 4 children have the highest poverty rate, with 1 household (100.0%) living below poverty.
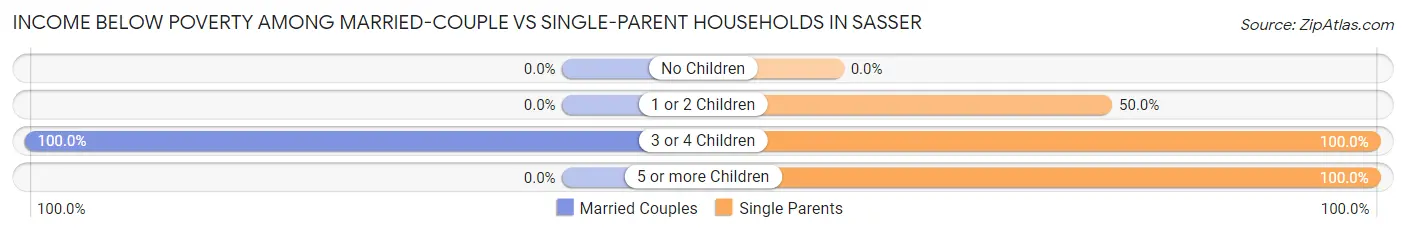
| Children | Married-Couple Families | Single-Parent Households |
| No Children | 0 (0.0%) | 0 (0.0%) |
| 1 or 2 Children | 0 (0.0%) | 2 (50.0%) |
| 3 or 4 Children | 2 (100.0%) | 1 (100.0%) |
| 5 or more Children | 0 (0.0%) | 2 (100.0%) |
| Total | 2 (2.7%) | 5 (35.7%) |
Employment Characteristics in Sasser
Employment by Class of Employer in Sasser
Among the 155 employed individuals in Sasser, private company employees (104 | 67.1%), self-employed (not incorporated) (20 | 12.9%), and not-for-profit organizations (10 | 6.5%) make up the most common classes of employment.
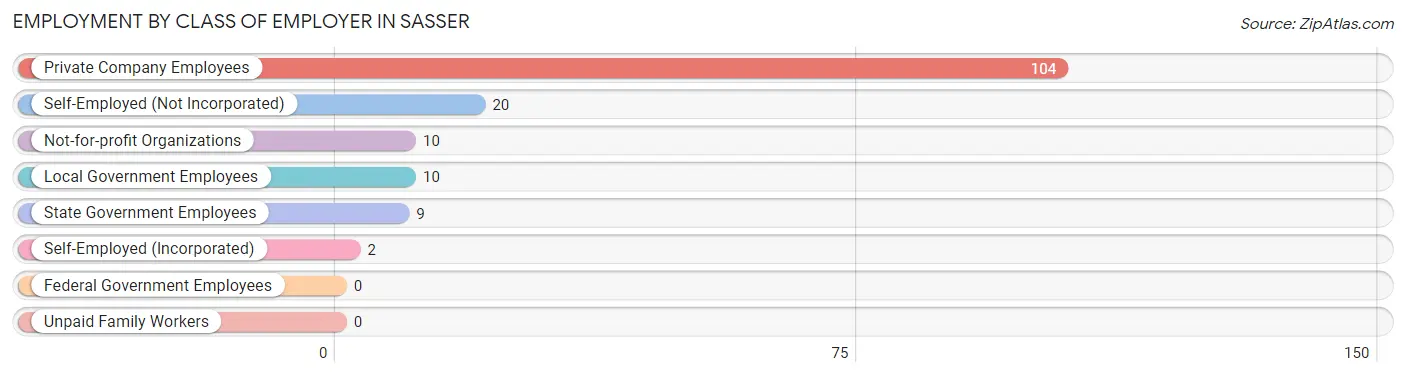
| Employer Class | # Employees | % Employees |
| Private Company Employees | 104 | 67.1% |
| Self-Employed (Incorporated) | 2 | 1.3% |
| Self-Employed (Not Incorporated) | 20 | 12.9% |
| Not-for-profit Organizations | 10 | 6.5% |
| Local Government Employees | 10 | 6.5% |
| State Government Employees | 9 | 5.8% |
| Federal Government Employees | 0 | 0.0% |
| Unpaid Family Workers | 0 | 0.0% |
| Total | 155 | 100.0% |
Employment Status by Age in Sasser
According to the labor force statistics for Sasser, out of the total population over 16 years of age (284), 66.5% or 189 individuals are in the labor force, with 16.9% or 32 of them unemployed. The age group with the highest labor force participation rate is 25 to 29 years, with 100.0% or 7 individuals in the labor force. Within the labor force, the 35 to 44 years age range has the highest percentage of unemployed individuals, with 59.3% or 32 of them being unemployed.
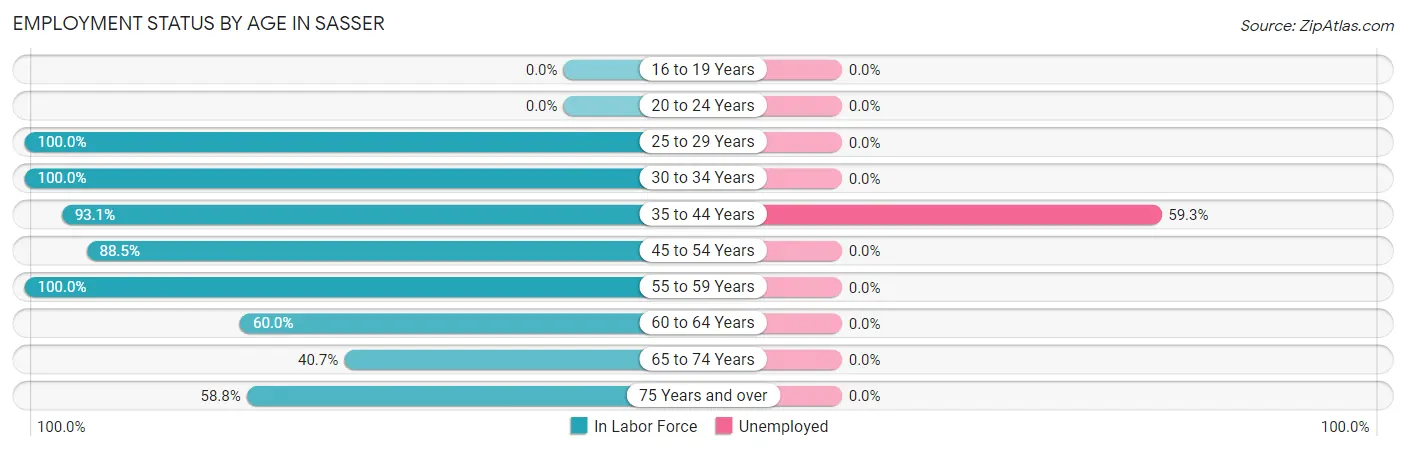
| Age Bracket | In Labor Force | Unemployed |
| 16 to 19 Years | 0 (0.0%) | 0 (0.0%) |
| 20 to 24 Years | 0 (0.0%) | 0 (0.0%) |
| 25 to 29 Years | 7 (100.0%) | 0 (0.0%) |
| 30 to 34 Years | 11 (100.0%) | 0 (0.0%) |
| 35 to 44 Years | 54 (93.1%) | 32 (59.3%) |
| 45 to 54 Years | 23 (88.5%) | 0 (0.0%) |
| 55 to 59 Years | 24 (100.0%) | 0 (0.0%) |
| 60 to 64 Years | 6 (60.0%) | 0 (0.0%) |
| 65 to 74 Years | 24 (40.7%) | 0 (0.0%) |
| 75 Years and over | 40 (58.8%) | 0 (0.0%) |
| Total | 189 (66.5%) | 32 (16.9%) |
Employment Status by Educational Attainment in Sasser
According to labor force statistics for Sasser, 91.9% of individuals (125) out of the total population between 25 and 64 years of age (136) are in the labor force, with 25.6% or 32 of them being unemployed. The group with the highest labor force participation rate are those with the educational attainment of college / associate degree, with 100.0% or 66 individuals in the labor force. Within the labor force, individuals with high school diploma education have the highest percentage of unemployment, with 68.2% or 30 of them being unemployed.
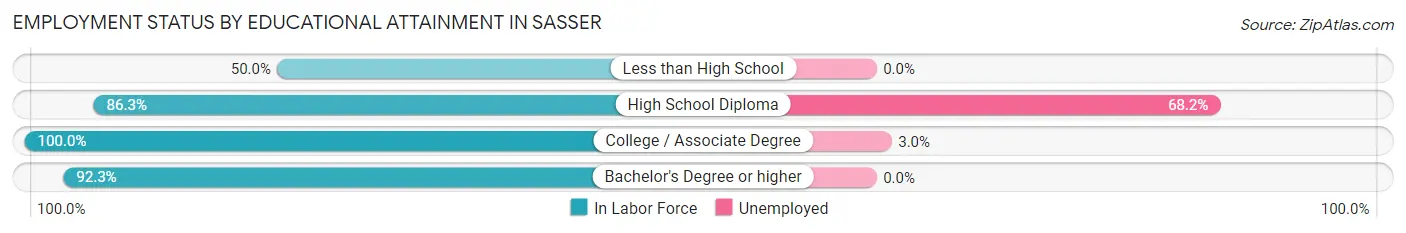
| Educational Attainment | In Labor Force | Unemployed |
| Less than High School | 3 (50.0%) | 0 (0.0%) |
| High School Diploma | 44 (86.3%) | 35 (68.2%) |
| College / Associate Degree | 66 (100.0%) | 2 (3.0%) |
| Bachelor's Degree or higher | 12 (92.3%) | 0 (0.0%) |
| Total | 125 (91.9%) | 35 (25.6%) |
Employment Occupations by Sex in Sasser
Management, Business, Science and Arts Occupations
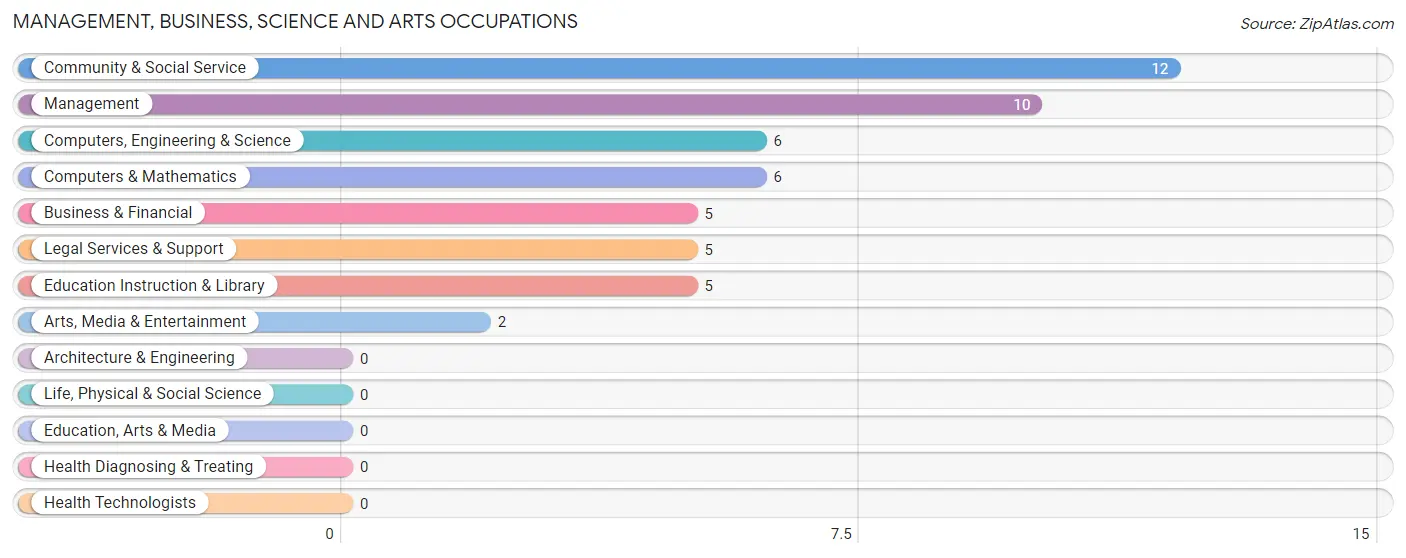
The most common Management, Business, Science and Arts occupations in Sasser are Community & Social Service (12 | 7.6%), Management (10 | 6.4%), Computers, Engineering & Science (6 | 3.8%), Computers & Mathematics (6 | 3.8%), and Business & Financial (5 | 3.2%).
Management, Business, Science and Arts Occupations by Sex
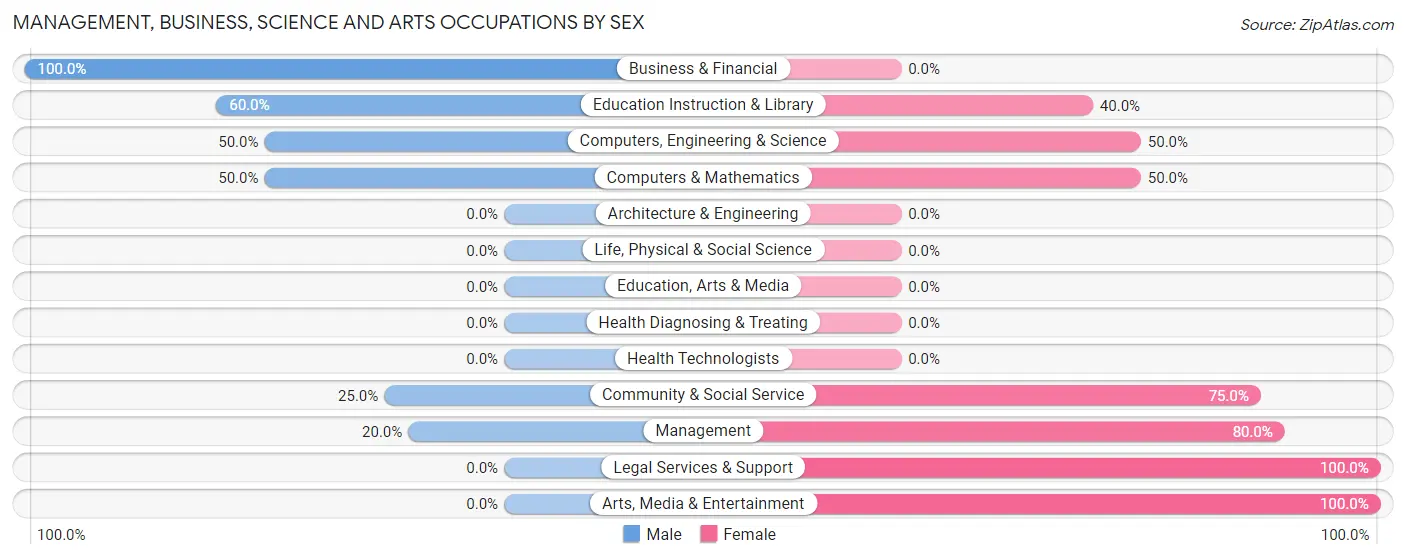
Within the Management, Business, Science and Arts occupations in Sasser, the most male-oriented occupations are Business & Financial (100.0%), Education Instruction & Library (60.0%), and Computers, Engineering & Science (50.0%), while the most female-oriented occupations are Legal Services & Support (100.0%), Arts, Media & Entertainment (100.0%), and Management (80.0%).
| Occupation | Male | Female |
| Management | 2 (20.0%) | 8 (80.0%) |
| Business & Financial | 5 (100.0%) | 0 (0.0%) |
| Computers, Engineering & Science | 3 (50.0%) | 3 (50.0%) |
| Computers & Mathematics | 3 (50.0%) | 3 (50.0%) |
| Architecture & Engineering | 0 (0.0%) | 0 (0.0%) |
| Life, Physical & Social Science | 0 (0.0%) | 0 (0.0%) |
| Community & Social Service | 3 (25.0%) | 9 (75.0%) |
| Education, Arts & Media | 0 (0.0%) | 0 (0.0%) |
| Legal Services & Support | 0 (0.0%) | 5 (100.0%) |
| Education Instruction & Library | 3 (60.0%) | 2 (40.0%) |
| Arts, Media & Entertainment | 0 (0.0%) | 2 (100.0%) |
| Health Diagnosing & Treating | 0 (0.0%) | 0 (0.0%) |
| Health Technologists | 0 (0.0%) | 0 (0.0%) |
| Total (Category) | 13 (39.4%) | 20 (60.6%) |
| Total (Overall) | 92 (58.6%) | 65 (41.4%) |
Services Occupations
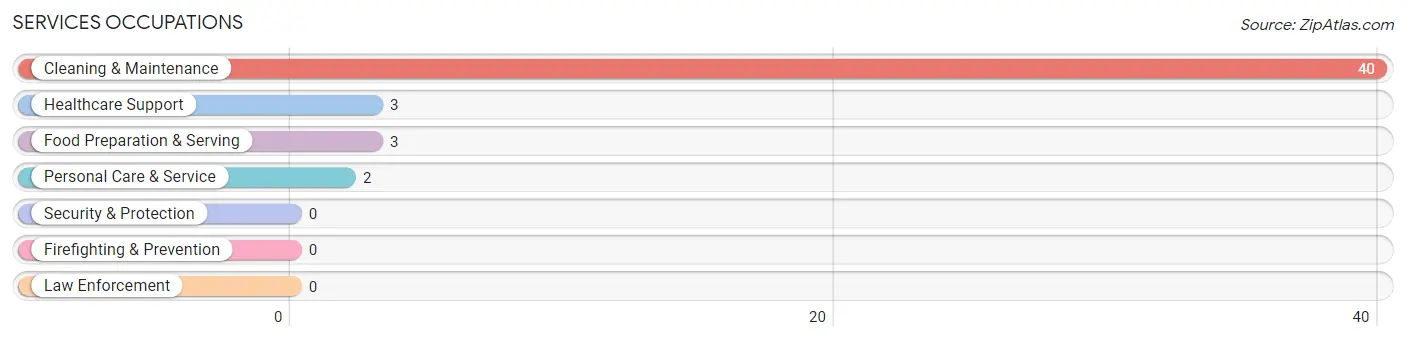
The most common Services occupations in Sasser are Cleaning & Maintenance (40 | 25.5%), Healthcare Support (3 | 1.9%), Food Preparation & Serving (3 | 1.9%), and Personal Care & Service (2 | 1.3%).
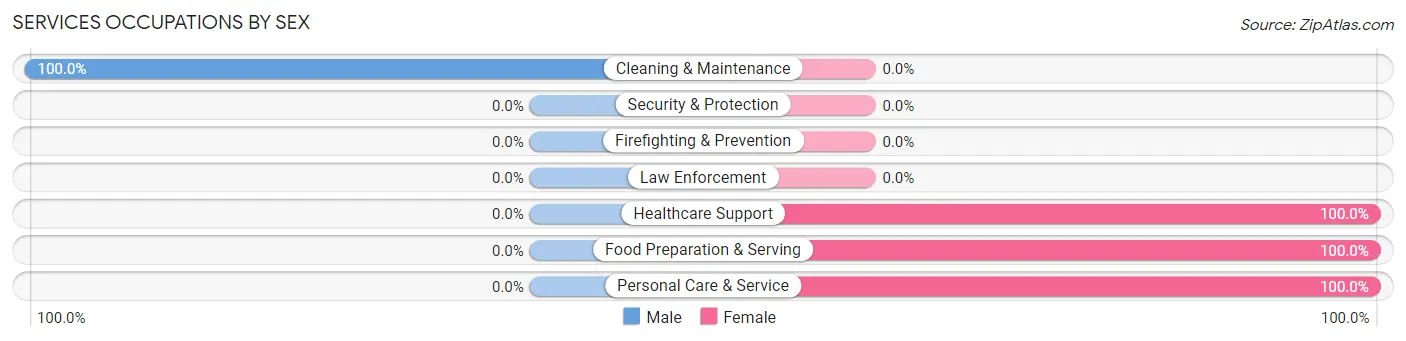
Services Occupations by Sex
| Occupation | Male | Female |
| Healthcare Support | 0 (0.0%) | 3 (100.0%) |
| Security & Protection | 0 (0.0%) | 0 (0.0%) |
| Firefighting & Prevention | 0 (0.0%) | 0 (0.0%) |
| Law Enforcement | 0 (0.0%) | 0 (0.0%) |
| Food Preparation & Serving | 0 (0.0%) | 3 (100.0%) |
| Cleaning & Maintenance | 40 (100.0%) | 0 (0.0%) |
| Personal Care & Service | 0 (0.0%) | 2 (100.0%) |
| Total (Category) | 40 (83.3%) | 8 (16.7%) |
| Total (Overall) | 92 (58.6%) | 65 (41.4%) |
Sales and Office Occupations
The most common Sales and Office occupations in Sasser are Sales & Related (14 | 8.9%), and Office & Administration (8 | 5.1%).
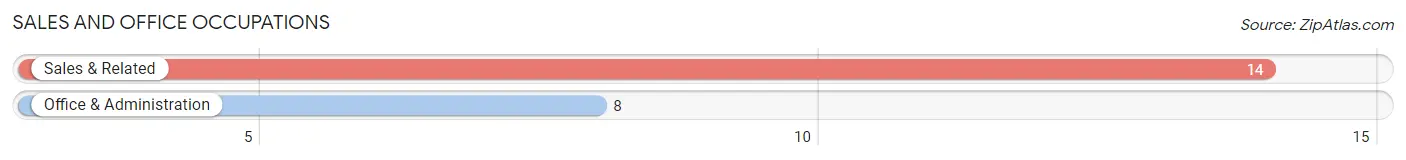
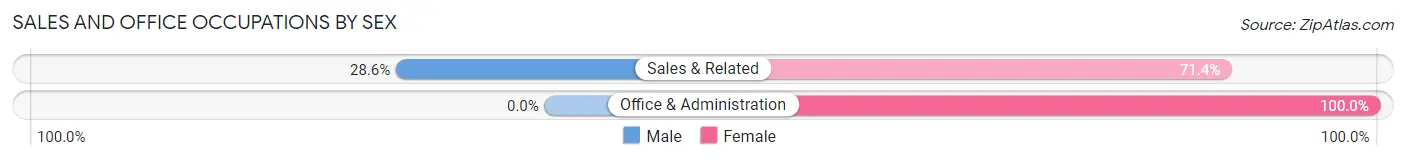
Sales and Office Occupations by Sex
| Occupation | Male | Female |
| Sales & Related | 4 (28.6%) | 10 (71.4%) |
| Office & Administration | 0 (0.0%) | 8 (100.0%) |
| Total (Category) | 4 (18.2%) | 18 (81.8%) |
| Total (Overall) | 92 (58.6%) | 65 (41.4%) |
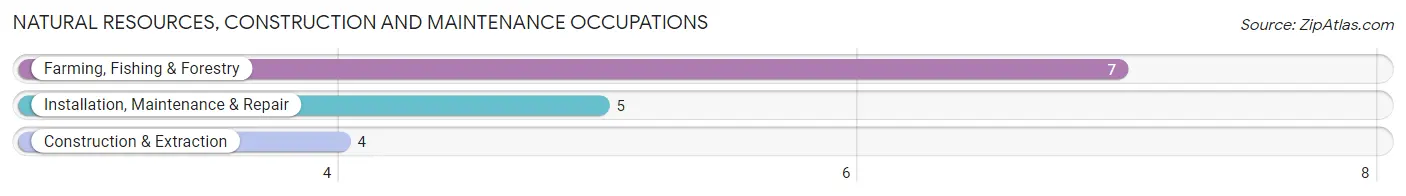
Natural Resources, Construction and Maintenance Occupations
The most common Natural Resources, Construction and Maintenance occupations in Sasser are Farming, Fishing & Forestry (7 | 4.5%), Installation, Maintenance & Repair (5 | 3.2%), and Construction & Extraction (4 | 2.5%).
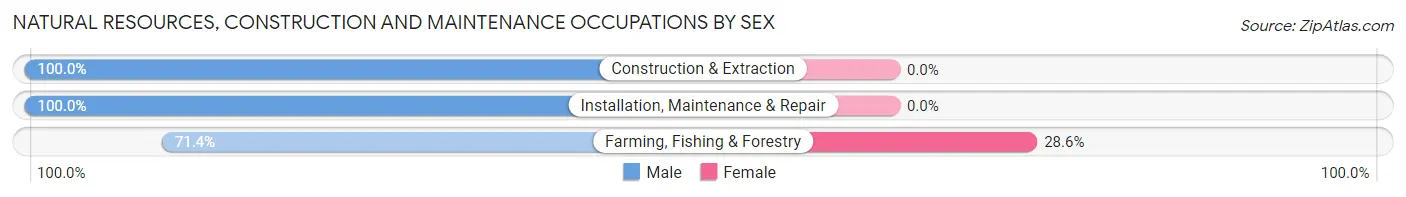
Natural Resources, Construction and Maintenance Occupations by Sex
| Occupation | Male | Female |
| Farming, Fishing & Forestry | 5 (71.4%) | 2 (28.6%) |
| Construction & Extraction | 4 (100.0%) | 0 (0.0%) |
| Installation, Maintenance & Repair | 5 (100.0%) | 0 (0.0%) |
| Total (Category) | 14 (87.5%) | 2 (12.5%) |
| Total (Overall) | 92 (58.6%) | 65 (41.4%) |
Production, Transportation and Moving Occupations
The most common Production, Transportation and Moving occupations in Sasser are Production (19 | 12.1%), and Transportation (19 | 12.1%).
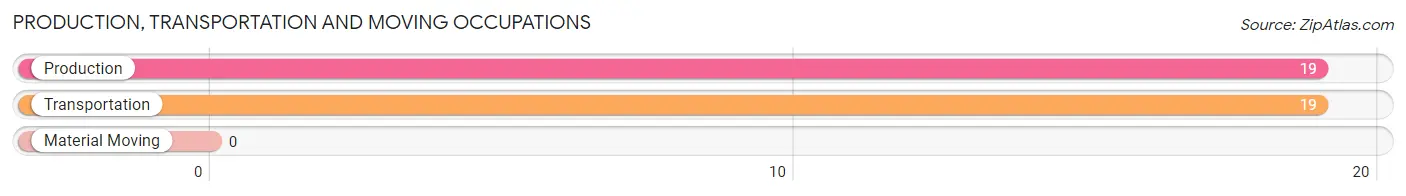
Production, Transportation and Moving Occupations by Sex
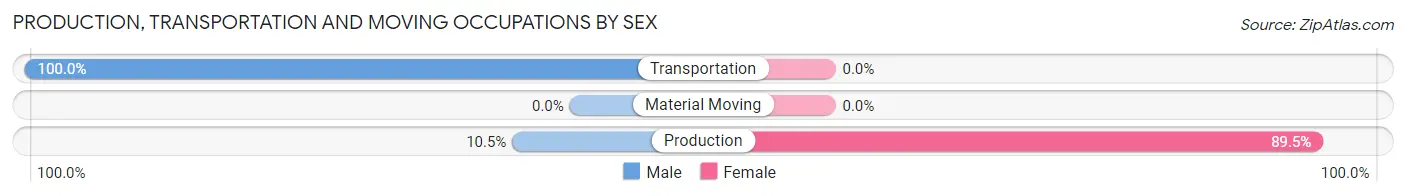
| Occupation | Male | Female |
| Production | 2 (10.5%) | 17 (89.5%) |
| Transportation | 19 (100.0%) | 0 (0.0%) |
| Material Moving | 0 (0.0%) | 0 (0.0%) |
| Total (Category) | 21 (55.3%) | 17 (44.7%) |
| Total (Overall) | 92 (58.6%) | 65 (41.4%) |
Employment Industries by Sex in Sasser
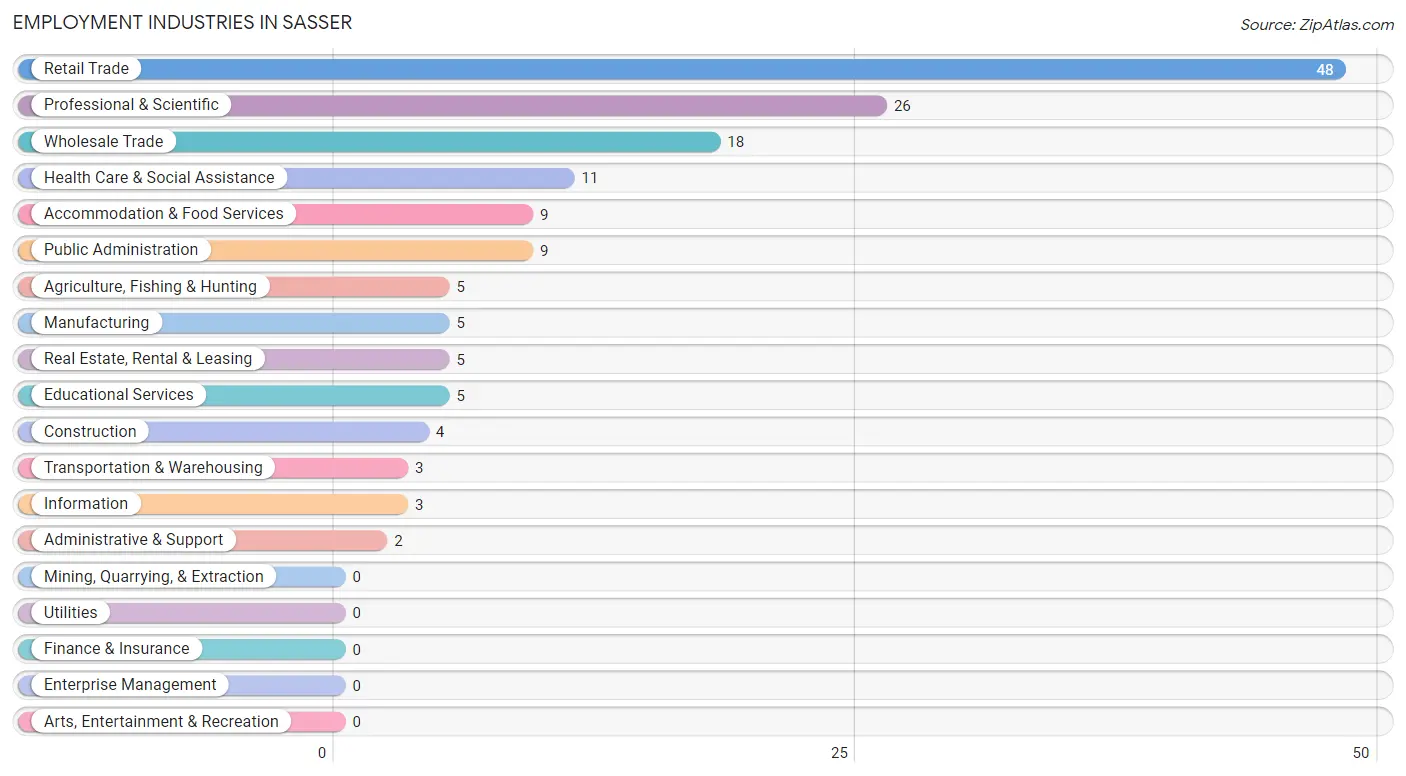
Employment Industries in Sasser
The major employment industries in Sasser include Retail Trade (48 | 30.6%), Professional & Scientific (26 | 16.6%), Wholesale Trade (18 | 11.5%), Health Care & Social Assistance (11 | 7.0%), and Accommodation & Food Services (9 | 5.7%).
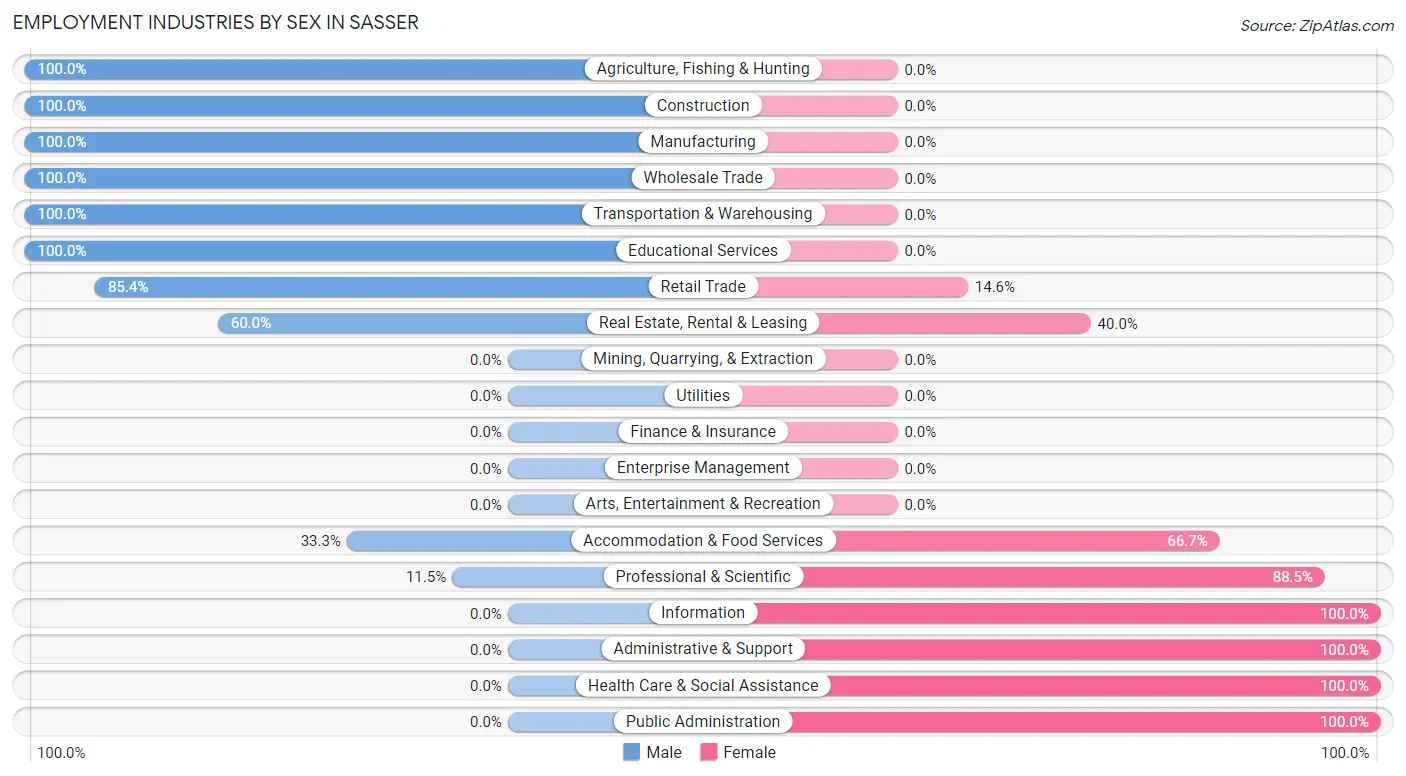
Employment Industries by Sex in Sasser
The Sasser industries that see more men than women are Agriculture, Fishing & Hunting (100.0%), Construction (100.0%), and Manufacturing (100.0%), whereas the industries that tend to have a higher number of women are Information (100.0%), Administrative & Support (100.0%), and Health Care & Social Assistance (100.0%).
| Industry | Male | Female |
| Agriculture, Fishing & Hunting | 5 (100.0%) | 0 (0.0%) |
| Mining, Quarrying, & Extraction | 0 (0.0%) | 0 (0.0%) |
| Construction | 4 (100.0%) | 0 (0.0%) |
| Manufacturing | 5 (100.0%) | 0 (0.0%) |
| Wholesale Trade | 18 (100.0%) | 0 (0.0%) |
| Retail Trade | 41 (85.4%) | 7 (14.6%) |
| Transportation & Warehousing | 3 (100.0%) | 0 (0.0%) |
| Utilities | 0 (0.0%) | 0 (0.0%) |
| Information | 0 (0.0%) | 3 (100.0%) |
| Finance & Insurance | 0 (0.0%) | 0 (0.0%) |
| Real Estate, Rental & Leasing | 3 (60.0%) | 2 (40.0%) |
| Professional & Scientific | 3 (11.5%) | 23 (88.5%) |
| Enterprise Management | 0 (0.0%) | 0 (0.0%) |
| Administrative & Support | 0 (0.0%) | 2 (100.0%) |
| Educational Services | 5 (100.0%) | 0 (0.0%) |
| Health Care & Social Assistance | 0 (0.0%) | 11 (100.0%) |
| Arts, Entertainment & Recreation | 0 (0.0%) | 0 (0.0%) |
| Accommodation & Food Services | 3 (33.3%) | 6 (66.7%) |
| Public Administration | 0 (0.0%) | 9 (100.0%) |
| Total | 92 (58.6%) | 65 (41.4%) |
Education in Sasser
School Enrollment in Sasser
The most common levels of schooling among the 80 students in Sasser are middle school (34 | 42.5%), elementary school (13 | 16.3%), and college / undergraduate (13 | 16.3%).
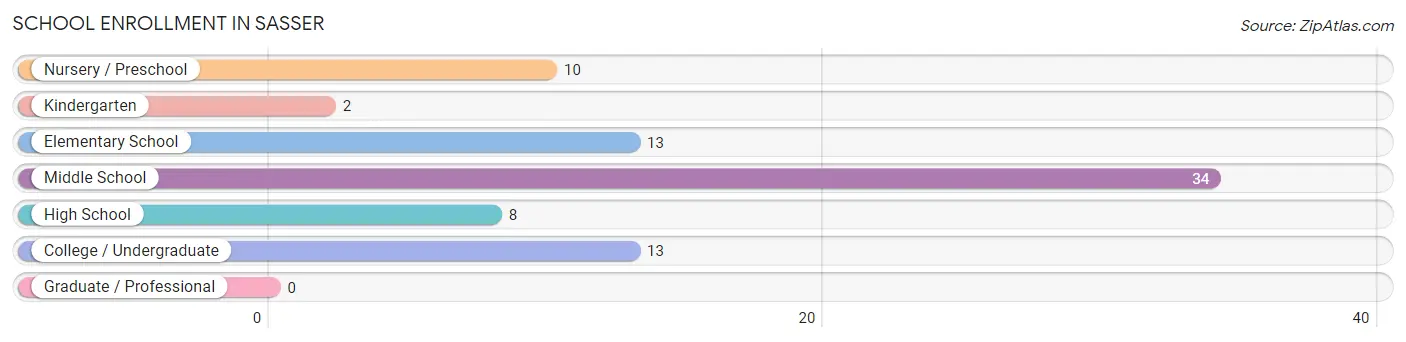
| School Level | # Students | % Students |
| Nursery / Preschool | 10 | 12.5% |
| Kindergarten | 2 | 2.5% |
| Elementary School | 13 | 16.3% |
| Middle School | 34 | 42.5% |
| High School | 8 | 10.0% |
| College / Undergraduate | 13 | 16.3% |
| Graduate / Professional | 0 | 0.0% |
| Total | 80 | 100.0% |
School Enrollment by Age by Funding Source in Sasser
Out of a total of 80 students who are enrolled in schools in Sasser, 8 (10.0%) attend a private institution, while the remaining 72 (90.0%) are enrolled in public schools. The age group of 35 years and over has the highest likelihood of being enrolled in private schools, with 4 (50.0% in the age bracket) enrolled. Conversely, the age group of 3 to 4 year olds has the lowest likelihood of being enrolled in a private school, with 6 (100.0% in the age bracket) attending a public institution.
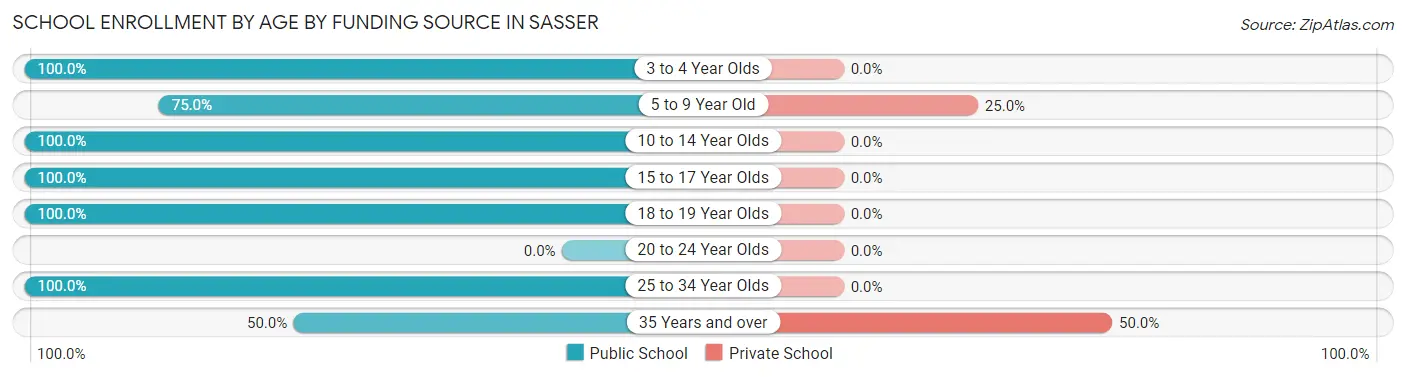
| Age Bracket | Public School | Private School |
| 3 to 4 Year Olds | 6 (100.0%) | 0 (0.0%) |
| 5 to 9 Year Old | 12 (75.0%) | 4 (25.0%) |
| 10 to 14 Year Olds | 37 (100.0%) | 0 (0.0%) |
| 15 to 17 Year Olds | 8 (100.0%) | 0 (0.0%) |
| 18 to 19 Year Olds | 3 (100.0%) | 0 (0.0%) |
| 20 to 24 Year Olds | 0 (0.0%) | 0 (0.0%) |
| 25 to 34 Year Olds | 2 (100.0%) | 0 (0.0%) |
| 35 Years and over | 4 (50.0%) | 4 (50.0%) |
| Total | 72 (90.0%) | 8 (10.0%) |
Educational Attainment by Field of Study in Sasser
Education (7 | 24.1%), business (5 | 17.2%), bio, nature & agricultural (4 | 13.8%), literature & languages (4 | 13.8%), and computers & mathematics (3 | 10.3%) are the most common fields of study among 29 individuals in Sasser who have obtained a bachelor's degree or higher.
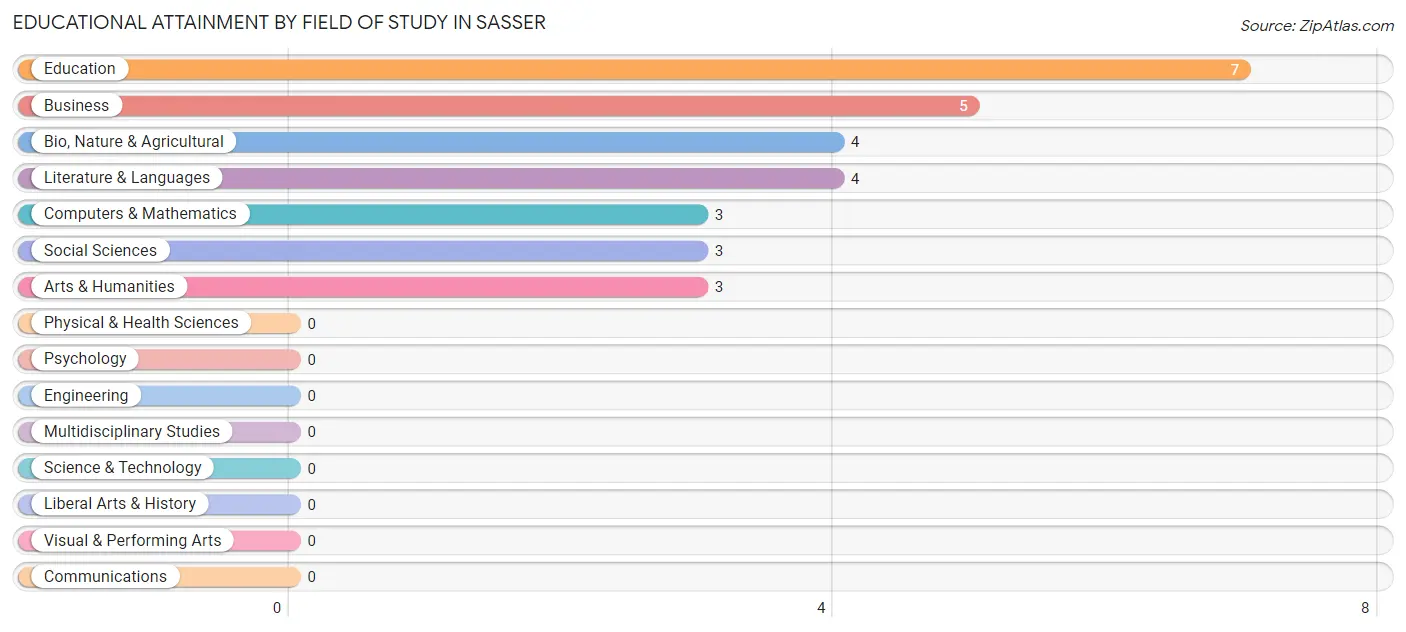
| Field of Study | # Graduates | % Graduates |
| Computers & Mathematics | 3 | 10.3% |
| Bio, Nature & Agricultural | 4 | 13.8% |
| Physical & Health Sciences | 0 | 0.0% |
| Psychology | 0 | 0.0% |
| Social Sciences | 3 | 10.3% |
| Engineering | 0 | 0.0% |
| Multidisciplinary Studies | 0 | 0.0% |
| Science & Technology | 0 | 0.0% |
| Business | 5 | 17.2% |
| Education | 7 | 24.1% |
| Literature & Languages | 4 | 13.8% |
| Liberal Arts & History | 0 | 0.0% |
| Visual & Performing Arts | 0 | 0.0% |
| Communications | 0 | 0.0% |
| Arts & Humanities | 3 | 10.3% |
| Total | 29 | 100.0% |
Transportation & Commute in Sasser
Vehicle Availability by Sex in Sasser
The most prevalent vehicle ownership categories in Sasser are males with 2 vehicles (49, accounting for 53.3%) and females with 2 vehicles (17, making up 77.8%).
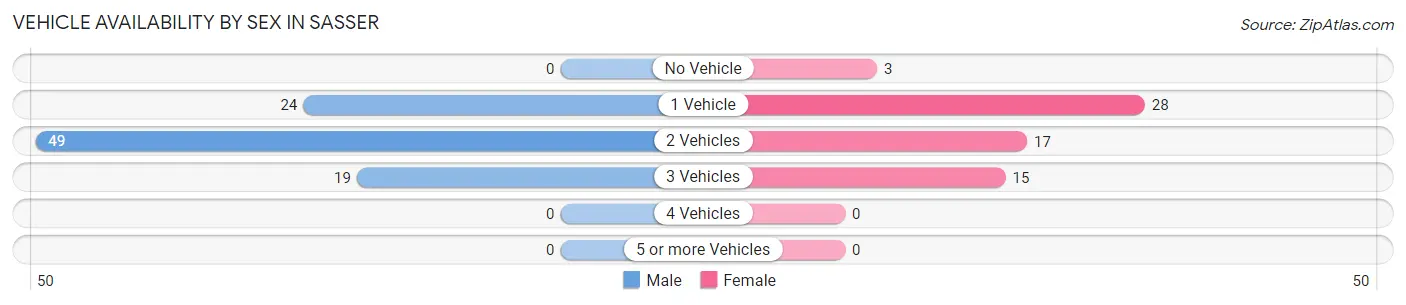
| Vehicles Available | Male | Female |
| No Vehicle | 0 (0.0%) | 3 (4.8%) |
| 1 Vehicle | 24 (26.1%) | 28 (44.4%) |
| 2 Vehicles | 49 (53.3%) | 17 (27.0%) |
| 3 Vehicles | 19 (20.6%) | 15 (23.8%) |
| 4 Vehicles | 0 (0.0%) | 0 (0.0%) |
| 5 or more Vehicles | 0 (0.0%) | 0 (0.0%) |
| Total | 92 (100.0%) | 63 (100.0%) |
Commute Time in Sasser
The most frequently occuring commute durations in Sasser are less than 5 minutes (41 commuters, 29.5%), 10 to 14 minutes (26 commuters, 18.7%), and 20 to 24 minutes (24 commuters, 17.3%).
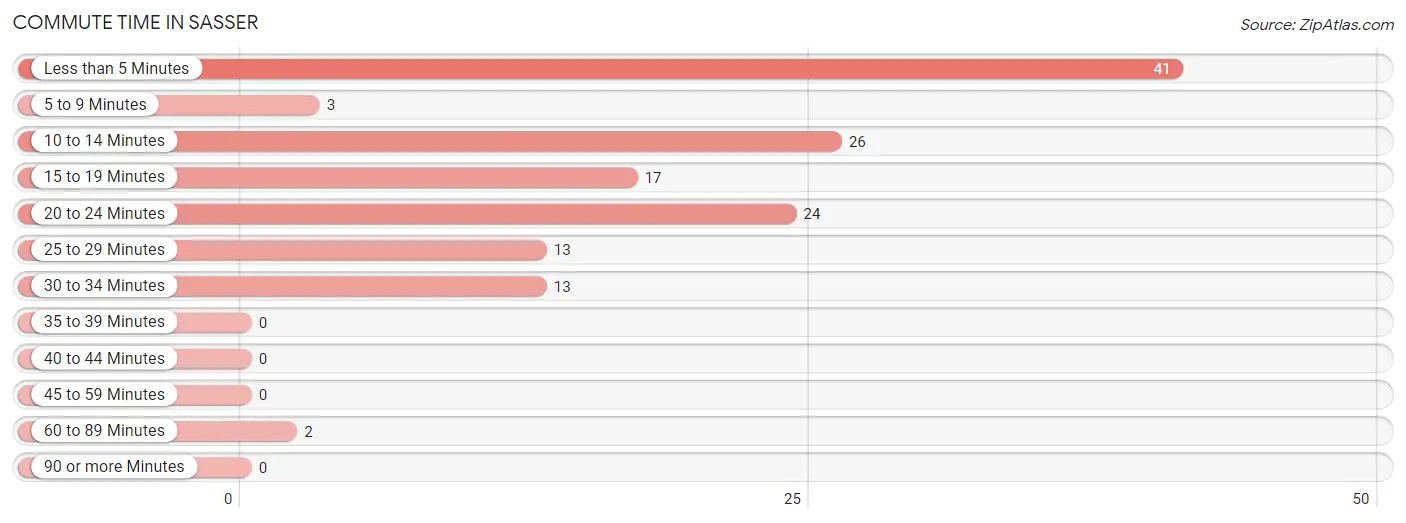
| Commute Time | # Commuters | % Commuters |
| Less than 5 Minutes | 41 | 29.5% |
| 5 to 9 Minutes | 3 | 2.2% |
| 10 to 14 Minutes | 26 | 18.7% |
| 15 to 19 Minutes | 17 | 12.2% |
| 20 to 24 Minutes | 24 | 17.3% |
| 25 to 29 Minutes | 13 | 9.3% |
| 30 to 34 Minutes | 13 | 9.3% |
| 35 to 39 Minutes | 0 | 0.0% |
| 40 to 44 Minutes | 0 | 0.0% |
| 45 to 59 Minutes | 0 | 0.0% |
| 60 to 89 Minutes | 2 | 1.4% |
| 90 or more Minutes | 0 | 0.0% |
Commute Time by Sex in Sasser
The most common commute times in Sasser are less than 5 minutes (41 commuters, 47.7%) for males and 20 to 24 minutes (18 commuters, 34.0%) for females.
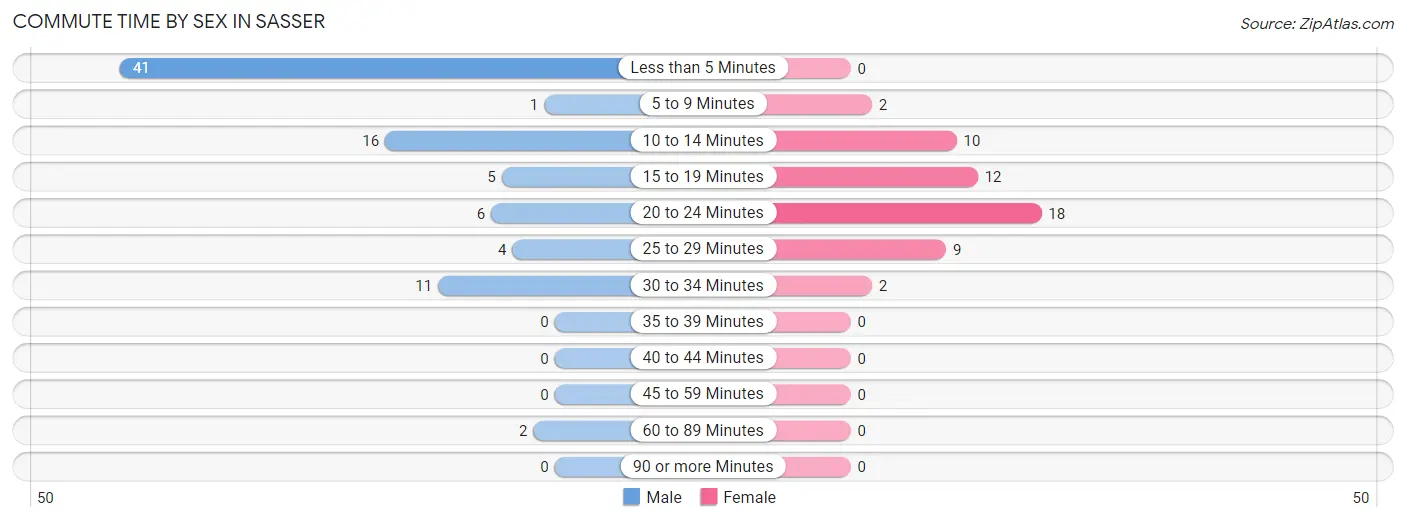
| Commute Time | Male | Female |
| Less than 5 Minutes | 41 (47.7%) | 0 (0.0%) |
| 5 to 9 Minutes | 1 (1.2%) | 2 (3.8%) |
| 10 to 14 Minutes | 16 (18.6%) | 10 (18.9%) |
| 15 to 19 Minutes | 5 (5.8%) | 12 (22.6%) |
| 20 to 24 Minutes | 6 (7.0%) | 18 (34.0%) |
| 25 to 29 Minutes | 4 (4.6%) | 9 (17.0%) |
| 30 to 34 Minutes | 11 (12.8%) | 2 (3.8%) |
| 35 to 39 Minutes | 0 (0.0%) | 0 (0.0%) |
| 40 to 44 Minutes | 0 (0.0%) | 0 (0.0%) |
| 45 to 59 Minutes | 0 (0.0%) | 0 (0.0%) |
| 60 to 89 Minutes | 2 (2.3%) | 0 (0.0%) |
| 90 or more Minutes | 0 (0.0%) | 0 (0.0%) |
Time of Departure to Work by Sex in Sasser
The most frequent times of departure to work in Sasser are 9:00 AM to 9:59 AM (43, 50.0%) for males and 7:30 AM to 7:59 AM (29, 54.7%) for females.
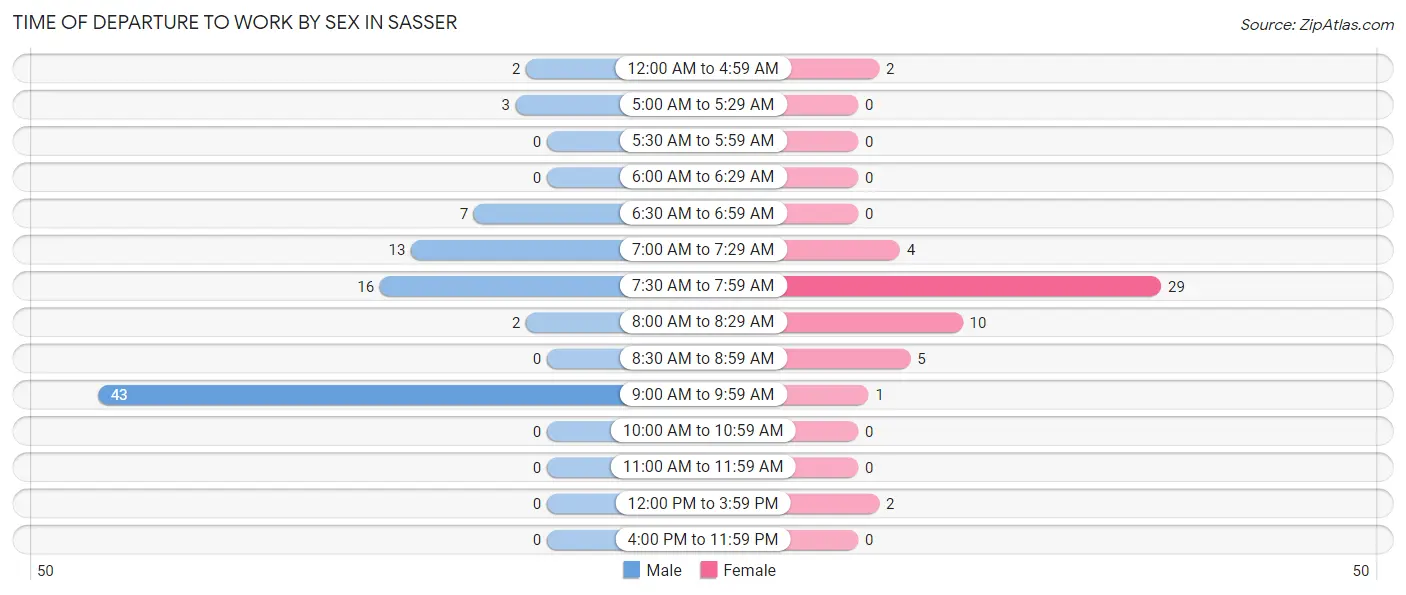
| Time of Departure | Male | Female |
| 12:00 AM to 4:59 AM | 2 (2.3%) | 2 (3.8%) |
| 5:00 AM to 5:29 AM | 3 (3.5%) | 0 (0.0%) |
| 5:30 AM to 5:59 AM | 0 (0.0%) | 0 (0.0%) |
| 6:00 AM to 6:29 AM | 0 (0.0%) | 0 (0.0%) |
| 6:30 AM to 6:59 AM | 7 (8.1%) | 0 (0.0%) |
| 7:00 AM to 7:29 AM | 13 (15.1%) | 4 (7.5%) |
| 7:30 AM to 7:59 AM | 16 (18.6%) | 29 (54.7%) |
| 8:00 AM to 8:29 AM | 2 (2.3%) | 10 (18.9%) |
| 8:30 AM to 8:59 AM | 0 (0.0%) | 5 (9.4%) |
| 9:00 AM to 9:59 AM | 43 (50.0%) | 1 (1.9%) |
| 10:00 AM to 10:59 AM | 0 (0.0%) | 0 (0.0%) |
| 11:00 AM to 11:59 AM | 0 (0.0%) | 0 (0.0%) |
| 12:00 PM to 3:59 PM | 0 (0.0%) | 2 (3.8%) |
| 4:00 PM to 11:59 PM | 0 (0.0%) | 0 (0.0%) |
| Total | 86 (100.0%) | 53 (100.0%) |
Housing Occupancy in Sasser
Occupancy by Ownership in Sasser
Of the total 168 dwellings in Sasser, owner-occupied units account for 120 (71.4%), while renter-occupied units make up 48 (28.6%).
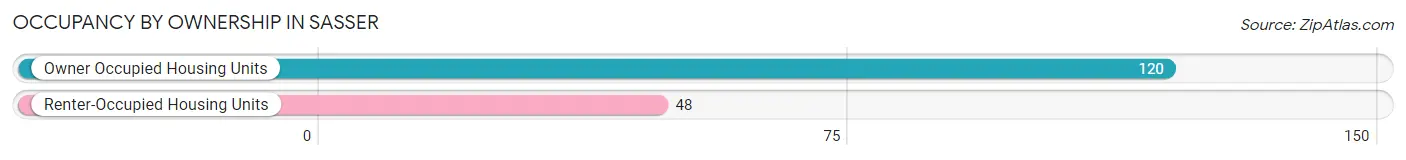
| Occupancy | # Housing Units | % Housing Units |
| Owner Occupied Housing Units | 120 | 71.4% |
| Renter-Occupied Housing Units | 48 | 28.6% |
| Total Occupied Housing Units | 168 | 100.0% |
Occupancy by Household Size in Sasser
| Household Size | # Housing Units | % Housing Units |
| 1-Person Household | 77 | 45.8% |
| 2-Person Household | 34 | 20.2% |
| 3-Person Household | 40 | 23.8% |
| 4+ Person Household | 17 | 10.1% |
| Total Housing Units | 168 | 100.0% |
Occupancy by Ownership by Household Size in Sasser
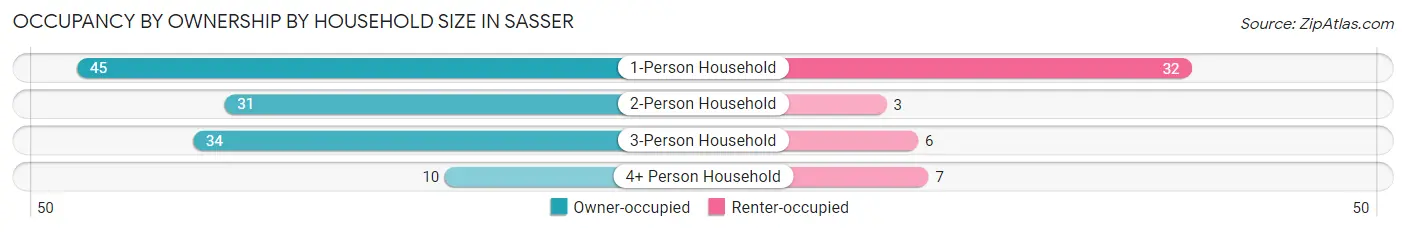
| Household Size | Owner-occupied | Renter-occupied |
| 1-Person Household | 45 (58.4%) | 32 (41.6%) |
| 2-Person Household | 31 (91.2%) | 3 (8.8%) |
| 3-Person Household | 34 (85.0%) | 6 (15.0%) |
| 4+ Person Household | 10 (58.8%) | 7 (41.2%) |
| Total Housing Units | 120 (71.4%) | 48 (28.6%) |
Occupancy by Educational Attainment in Sasser
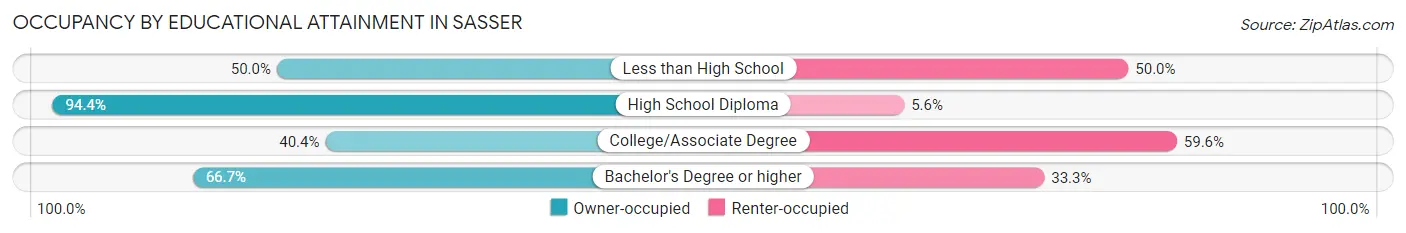
| Household Size | Owner-occupied | Renter-occupied |
| Less than High School | 10 (50.0%) | 10 (50.0%) |
| High School Diploma | 85 (94.4%) | 5 (5.6%) |
| College/Associate Degree | 21 (40.4%) | 31 (59.6%) |
| Bachelor's Degree or higher | 4 (66.7%) | 2 (33.3%) |
Occupancy by Age of Householder in Sasser
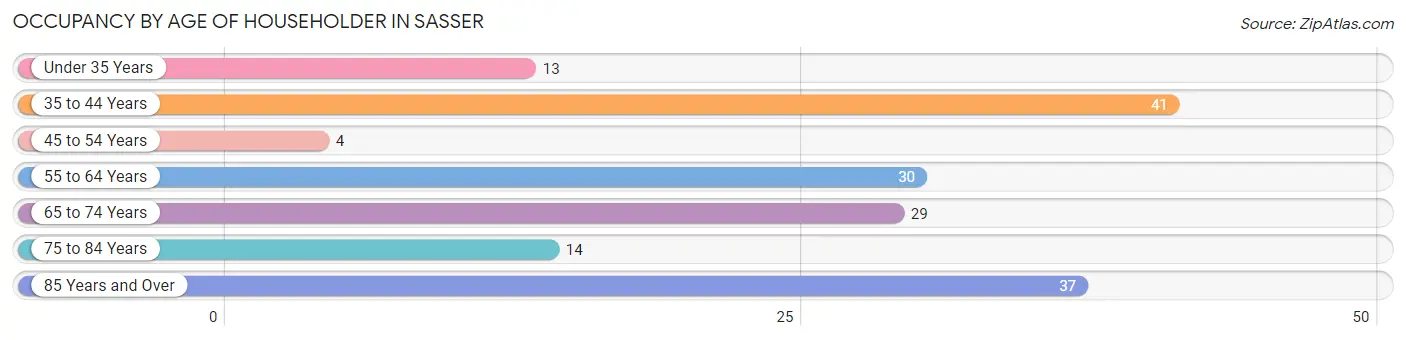
| Age Bracket | # Households | % Households |
| Under 35 Years | 13 | 7.7% |
| 35 to 44 Years | 41 | 24.4% |
| 45 to 54 Years | 4 | 2.4% |
| 55 to 64 Years | 30 | 17.9% |
| 65 to 74 Years | 29 | 17.3% |
| 75 to 84 Years | 14 | 8.3% |
| 85 Years and Over | 37 | 22.0% |
| Total | 168 | 100.0% |
Housing Finances in Sasser
Median Income by Occupancy in Sasser
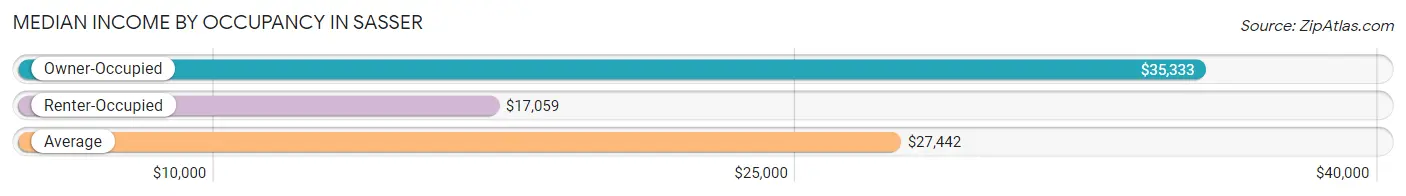
| Occupancy Type | # Households | Median Income |
| Owner-Occupied | 120 (71.4%) | $35,333 |
| Renter-Occupied | 48 (28.6%) | $17,059 |
| Average | 168 (100.0%) | $27,442 |
Occupancy by Householder Income Bracket in Sasser
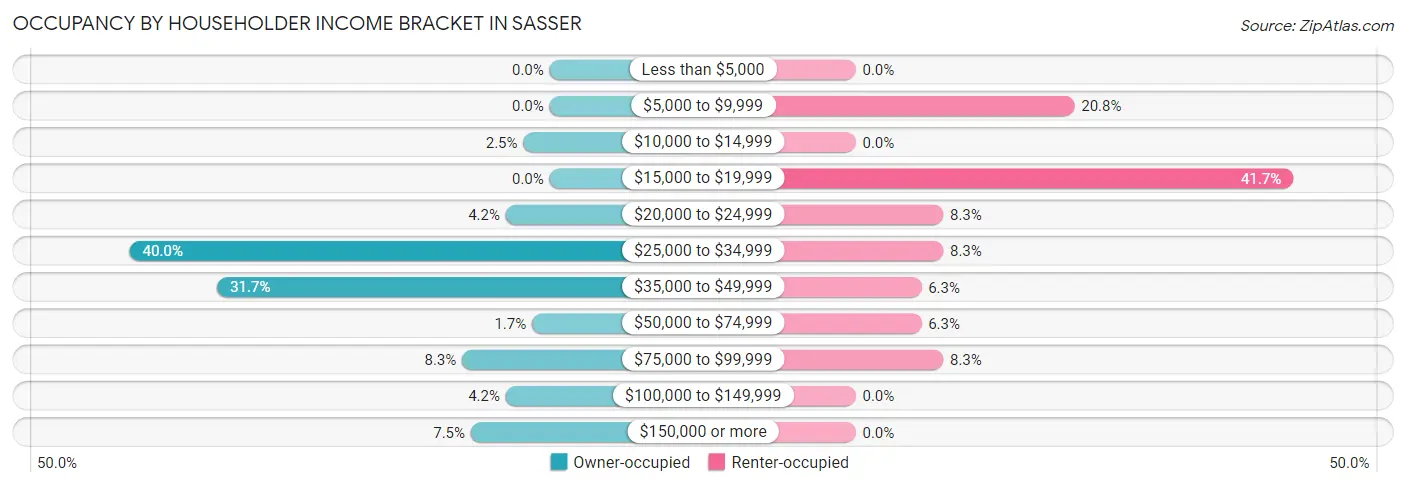
| Income Bracket | Owner-occupied | Renter-occupied |
| Less than $5,000 | 0 (0.0%) | 0 (0.0%) |
| $5,000 to $9,999 | 0 (0.0%) | 10 (20.8%) |
| $10,000 to $14,999 | 3 (2.5%) | 0 (0.0%) |
| $15,000 to $19,999 | 0 (0.0%) | 20 (41.7%) |
| $20,000 to $24,999 | 5 (4.2%) | 4 (8.3%) |
| $25,000 to $34,999 | 48 (40.0%) | 4 (8.3%) |
| $35,000 to $49,999 | 38 (31.7%) | 3 (6.2%) |
| $50,000 to $74,999 | 2 (1.7%) | 3 (6.2%) |
| $75,000 to $99,999 | 10 (8.3%) | 4 (8.3%) |
| $100,000 to $149,999 | 5 (4.2%) | 0 (0.0%) |
| $150,000 or more | 9 (7.5%) | 0 (0.0%) |
| Total | 120 (100.0%) | 48 (100.0%) |
Monthly Housing Cost Tiers in Sasser
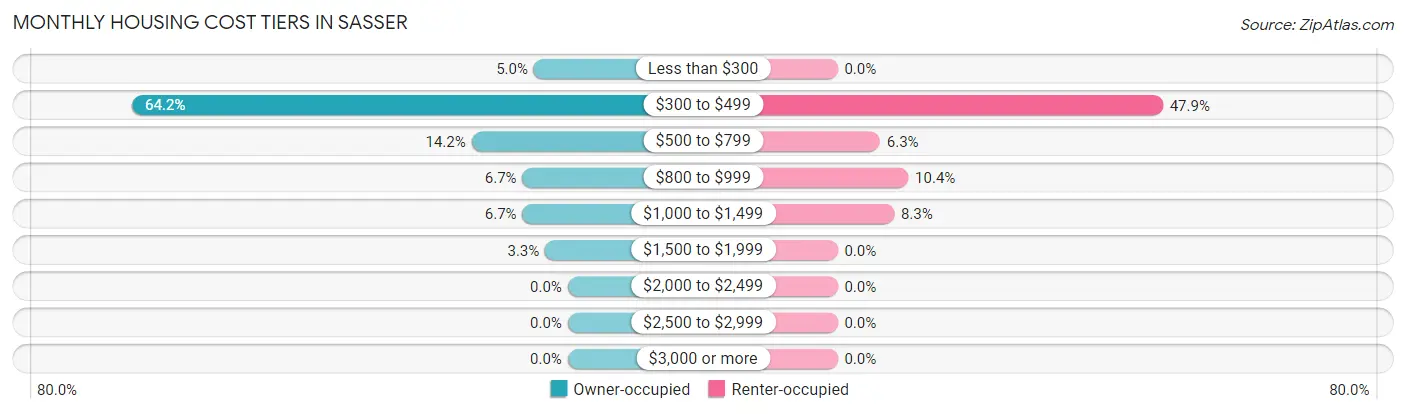
| Monthly Cost | Owner-occupied | Renter-occupied |
| Less than $300 | 6 (5.0%) | 0 (0.0%) |
| $300 to $499 | 77 (64.2%) | 23 (47.9%) |
| $500 to $799 | 17 (14.2%) | 3 (6.2%) |
| $800 to $999 | 8 (6.7%) | 5 (10.4%) |
| $1,000 to $1,499 | 8 (6.7%) | 4 (8.3%) |
| $1,500 to $1,999 | 4 (3.3%) | 0 (0.0%) |
| $2,000 to $2,499 | 0 (0.0%) | 0 (0.0%) |
| $2,500 to $2,999 | 0 (0.0%) | 0 (0.0%) |
| $3,000 or more | 0 (0.0%) | 0 (0.0%) |
| Total | 120 (100.0%) | 48 (100.0%) |
Physical Housing Characteristics in Sasser
Housing Structures in Sasser
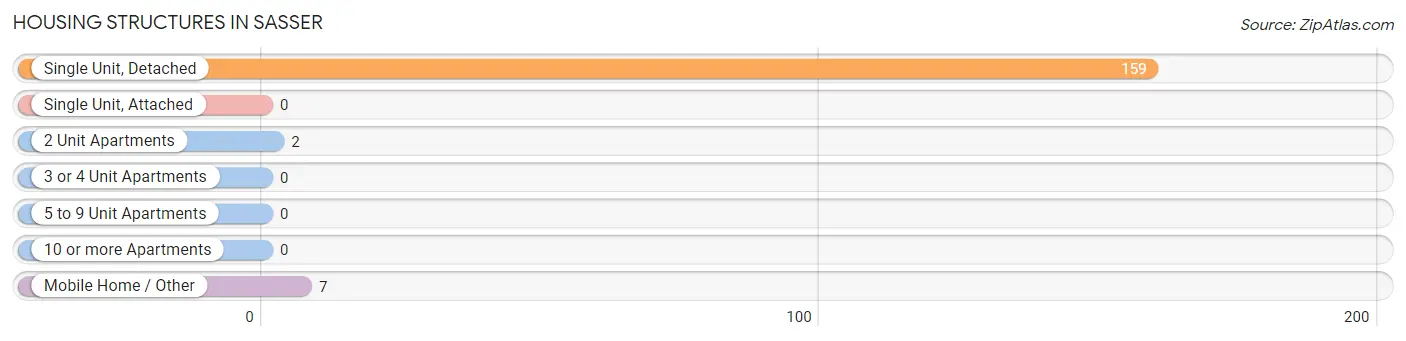
| Structure Type | # Housing Units | % Housing Units |
| Single Unit, Detached | 159 | 94.6% |
| Single Unit, Attached | 0 | 0.0% |
| 2 Unit Apartments | 2 | 1.2% |
| 3 or 4 Unit Apartments | 0 | 0.0% |
| 5 to 9 Unit Apartments | 0 | 0.0% |
| 10 or more Apartments | 0 | 0.0% |
| Mobile Home / Other | 7 | 4.2% |
| Total | 168 | 100.0% |
Housing Structures by Occupancy in Sasser
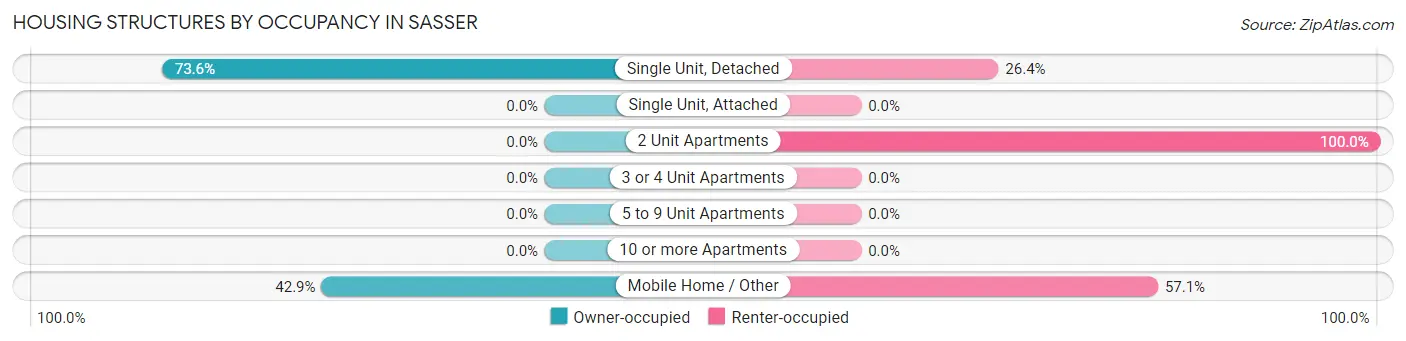
| Structure Type | Owner-occupied | Renter-occupied |
| Single Unit, Detached | 117 (73.6%) | 42 (26.4%) |
| Single Unit, Attached | 0 (0.0%) | 0 (0.0%) |
| 2 Unit Apartments | 0 (0.0%) | 2 (100.0%) |
| 3 or 4 Unit Apartments | 0 (0.0%) | 0 (0.0%) |
| 5 to 9 Unit Apartments | 0 (0.0%) | 0 (0.0%) |
| 10 or more Apartments | 0 (0.0%) | 0 (0.0%) |
| Mobile Home / Other | 3 (42.9%) | 4 (57.1%) |
| Total | 120 (71.4%) | 48 (28.6%) |
Housing Structures by Number of Rooms in Sasser
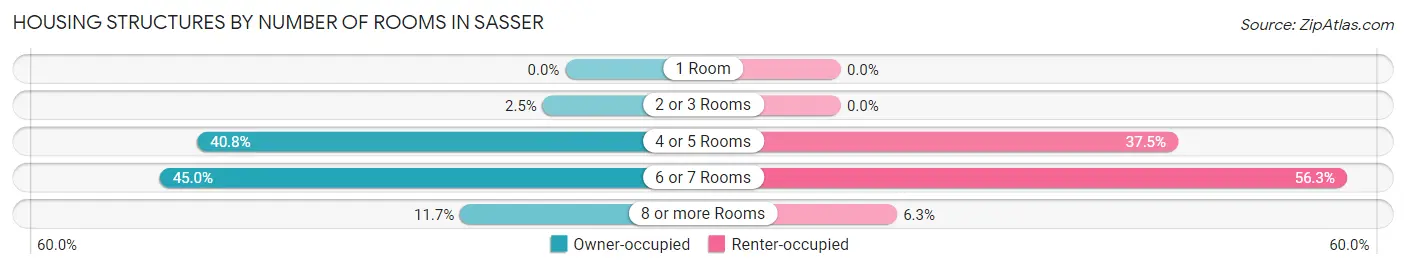
| Number of Rooms | Owner-occupied | Renter-occupied |
| 1 Room | 0 (0.0%) | 0 (0.0%) |
| 2 or 3 Rooms | 3 (2.5%) | 0 (0.0%) |
| 4 or 5 Rooms | 49 (40.8%) | 18 (37.5%) |
| 6 or 7 Rooms | 54 (45.0%) | 27 (56.2%) |
| 8 or more Rooms | 14 (11.7%) | 3 (6.2%) |
| Total | 120 (100.0%) | 48 (100.0%) |
Housing Structure by Heating Type in Sasser
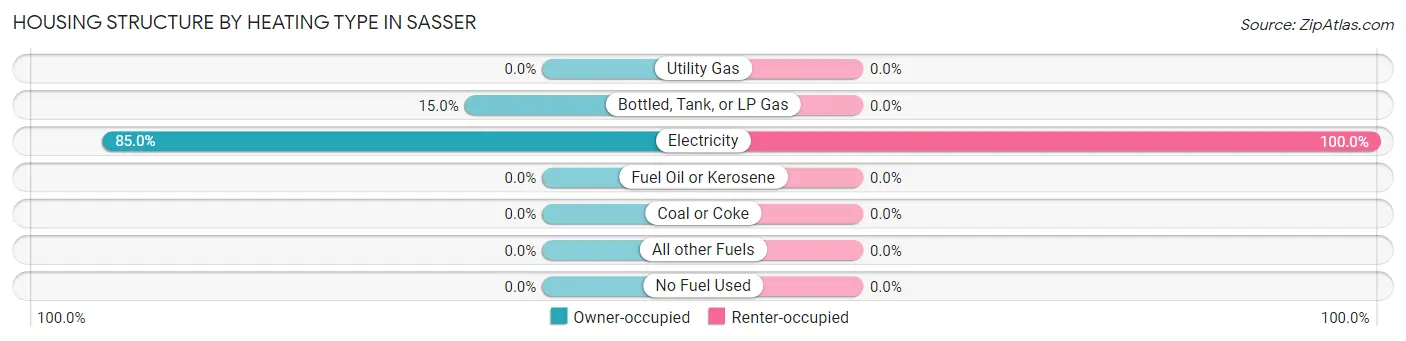
| Heating Type | Owner-occupied | Renter-occupied |
| Utility Gas | 0 (0.0%) | 0 (0.0%) |
| Bottled, Tank, or LP Gas | 18 (15.0%) | 0 (0.0%) |
| Electricity | 102 (85.0%) | 48 (100.0%) |
| Fuel Oil or Kerosene | 0 (0.0%) | 0 (0.0%) |
| Coal or Coke | 0 (0.0%) | 0 (0.0%) |
| All other Fuels | 0 (0.0%) | 0 (0.0%) |
| No Fuel Used | 0 (0.0%) | 0 (0.0%) |
| Total | 120 (100.0%) | 48 (100.0%) |
Household Vehicle Usage in Sasser
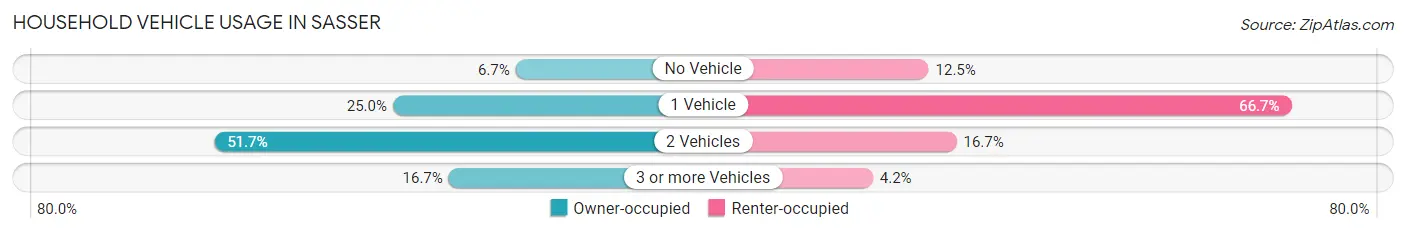
| Vehicles per Household | Owner-occupied | Renter-occupied |
| No Vehicle | 8 (6.7%) | 6 (12.5%) |
| 1 Vehicle | 30 (25.0%) | 32 (66.7%) |
| 2 Vehicles | 62 (51.7%) | 8 (16.7%) |
| 3 or more Vehicles | 20 (16.7%) | 2 (4.2%) |
| Total | 120 (100.0%) | 48 (100.0%) |
Real Estate & Mortgages in Sasser
Real Estate and Mortgage Overview in Sasser
| Characteristic | Without Mortgage | With Mortgage |
| Housing Units | 94 | 26 |
| Median Property Value | $100,700 | $150,000 |
| Median Household Income | $33,750 | $3 |
| Monthly Housing Costs | $348 | $0 |
| Real Estate Taxes | $786 | $0 |
Property Value by Mortgage Status in Sasser
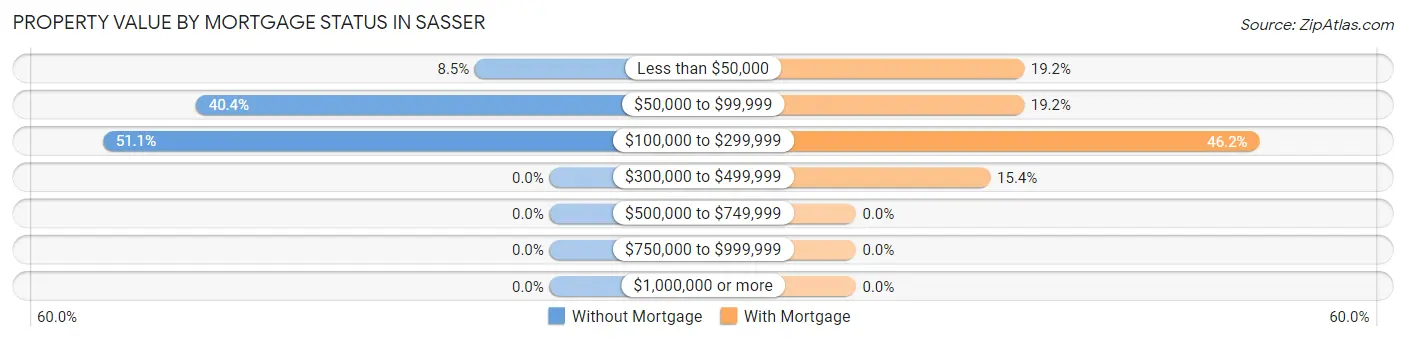
| Property Value | Without Mortgage | With Mortgage |
| Less than $50,000 | 8 (8.5%) | 5 (19.2%) |
| $50,000 to $99,999 | 38 (40.4%) | 5 (19.2%) |
| $100,000 to $299,999 | 48 (51.1%) | 12 (46.2%) |
| $300,000 to $499,999 | 0 (0.0%) | 4 (15.4%) |
| $500,000 to $749,999 | 0 (0.0%) | 0 (0.0%) |
| $750,000 to $999,999 | 0 (0.0%) | 0 (0.0%) |
| $1,000,000 or more | 0 (0.0%) | 0 (0.0%) |
| Total | 94 (100.0%) | 26 (100.0%) |
Household Income by Mortgage Status in Sasser
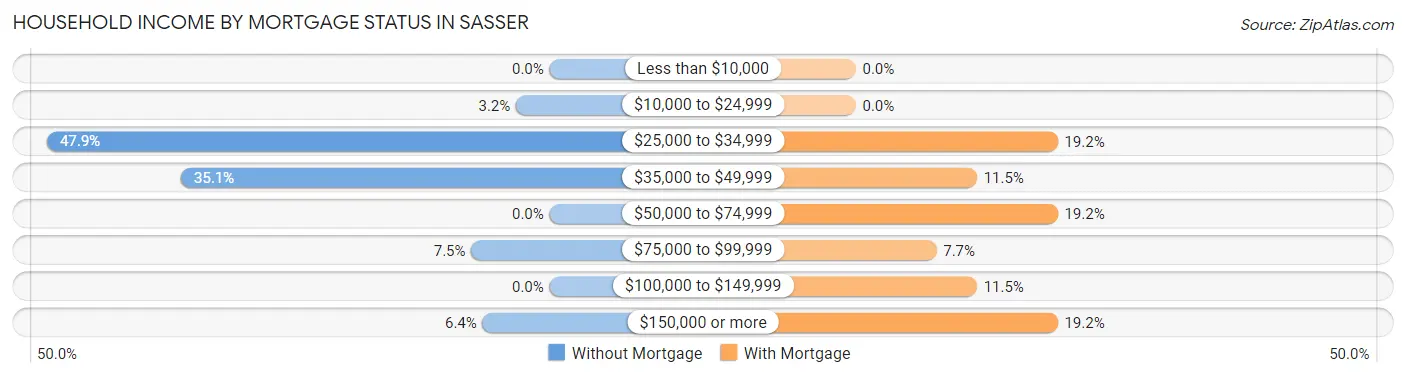
| Household Income | Without Mortgage | With Mortgage |
| Less than $10,000 | 0 (0.0%) | 0 (0.0%) |
| $10,000 to $24,999 | 3 (3.2%) | 0 (0.0%) |
| $25,000 to $34,999 | 45 (47.9%) | 5 (19.2%) |
| $35,000 to $49,999 | 33 (35.1%) | 3 (11.5%) |
| $50,000 to $74,999 | 0 (0.0%) | 5 (19.2%) |
| $75,000 to $99,999 | 7 (7.4%) | 2 (7.7%) |
| $100,000 to $149,999 | 0 (0.0%) | 3 (11.5%) |
| $150,000 or more | 6 (6.4%) | 5 (19.2%) |
| Total | 94 (100.0%) | 26 (100.0%) |
Property Value to Household Income Ratio in Sasser
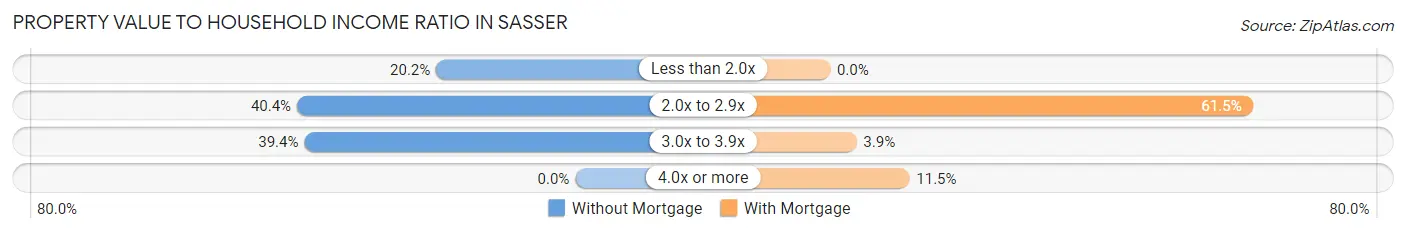
| Value-to-Income Ratio | Without Mortgage | With Mortgage |
| Less than 2.0x | 19 (20.2%) | 0 (0.0%) |
| 2.0x to 2.9x | 38 (40.4%) | 16 (61.5%) |
| 3.0x to 3.9x | 37 (39.4%) | 1 (3.8%) |
| 4.0x or more | 0 (0.0%) | 3 (11.5%) |
| Total | 94 (100.0%) | 26 (100.0%) |
Real Estate Taxes by Mortgage Status in Sasser
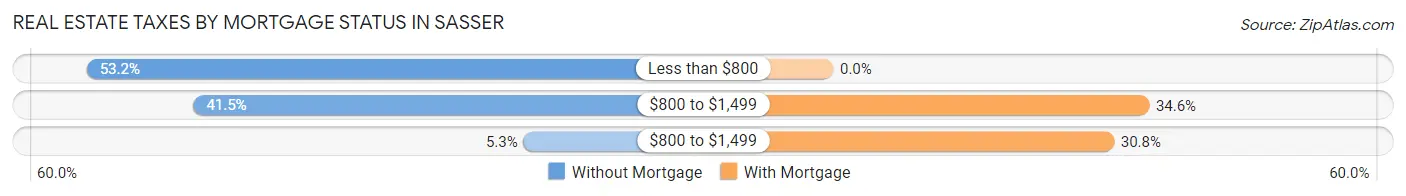
| Property Taxes | Without Mortgage | With Mortgage |
| Less than $800 | 50 (53.2%) | 0 (0.0%) |
| $800 to $1,499 | 39 (41.5%) | 9 (34.6%) |
| $800 to $1,499 | 5 (5.3%) | 8 (30.8%) |
| Total | 94 (100.0%) | 26 (100.0%) |
Health & Disability in Sasser
Health Insurance Coverage by Age in Sasser
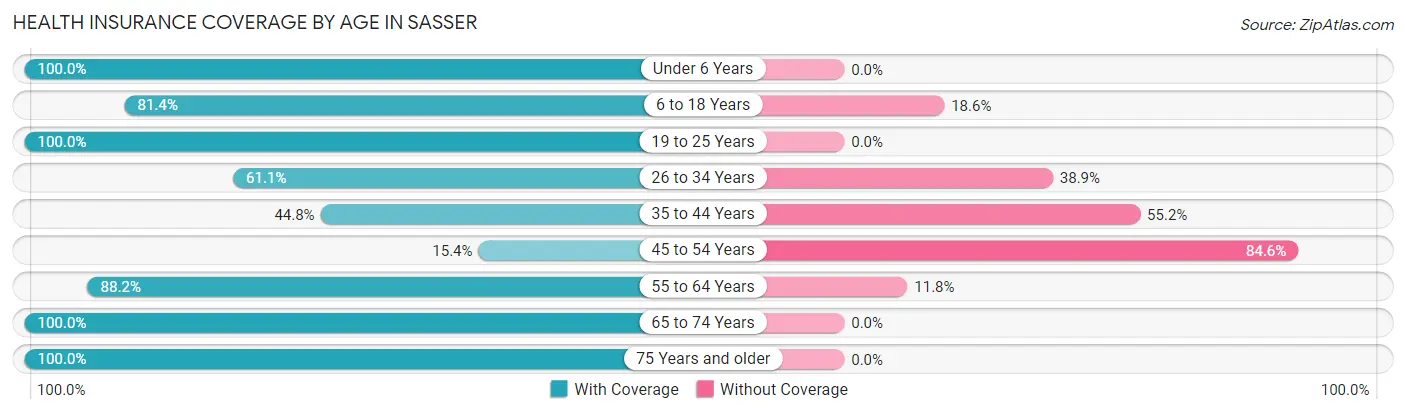
| Age Bracket | With Coverage | Without Coverage |
| Under 6 Years | 14 (100.0%) | 0 (0.0%) |
| 6 to 18 Years | 48 (81.4%) | 11 (18.6%) |
| 19 to 25 Years | 9 (100.0%) | 0 (0.0%) |
| 26 to 34 Years | 11 (61.1%) | 7 (38.9%) |
| 35 to 44 Years | 26 (44.8%) | 32 (55.2%) |
| 45 to 54 Years | 4 (15.4%) | 22 (84.6%) |
| 55 to 64 Years | 30 (88.2%) | 4 (11.8%) |
| 65 to 74 Years | 59 (100.0%) | 0 (0.0%) |
| 75 Years and older | 68 (100.0%) | 0 (0.0%) |
| Total | 269 (78.0%) | 76 (22.0%) |
Health Insurance Coverage by Citizenship Status in Sasser
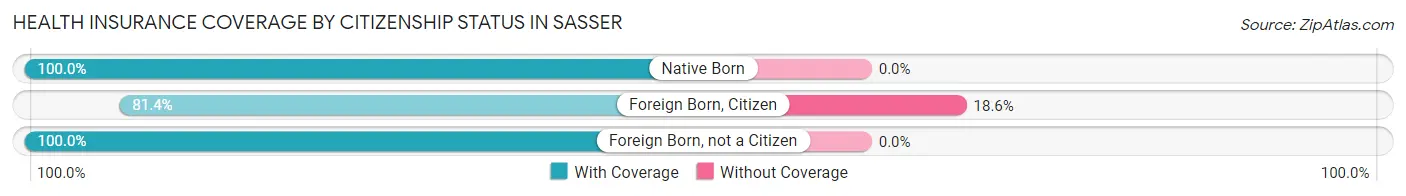
| Citizenship Status | With Coverage | Without Coverage |
| Native Born | 14 (100.0%) | 0 (0.0%) |
| Foreign Born, Citizen | 48 (81.4%) | 11 (18.6%) |
| Foreign Born, not a Citizen | 9 (100.0%) | 0 (0.0%) |
Health Insurance Coverage by Household Income in Sasser
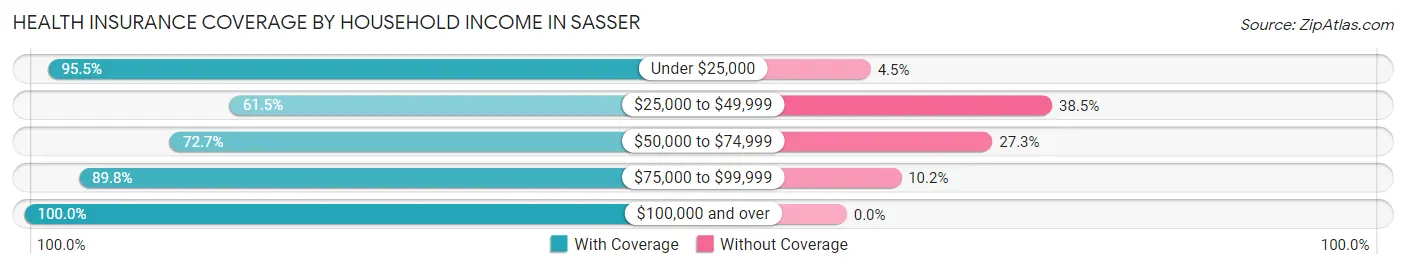
| Household Income | With Coverage | Without Coverage |
| Under $25,000 | 64 (95.5%) | 3 (4.5%) |
| $25,000 to $49,999 | 104 (61.5%) | 65 (38.5%) |
| $50,000 to $74,999 | 8 (72.7%) | 3 (27.3%) |
| $75,000 to $99,999 | 44 (89.8%) | 5 (10.2%) |
| $100,000 and over | 49 (100.0%) | 0 (0.0%) |
Public vs Private Health Insurance Coverage by Age in Sasser
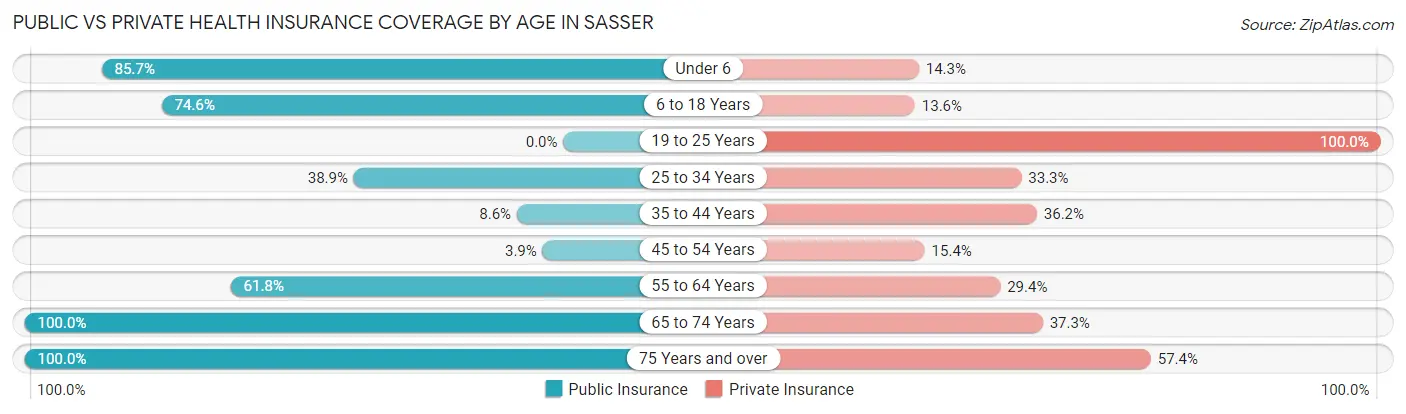
| Age Bracket | Public Insurance | Private Insurance |
| Under 6 | 12 (85.7%) | 2 (14.3%) |
| 6 to 18 Years | 44 (74.6%) | 8 (13.6%) |
| 19 to 25 Years | 0 (0.0%) | 9 (100.0%) |
| 25 to 34 Years | 7 (38.9%) | 6 (33.3%) |
| 35 to 44 Years | 5 (8.6%) | 21 (36.2%) |
| 45 to 54 Years | 1 (3.8%) | 4 (15.4%) |
| 55 to 64 Years | 21 (61.8%) | 10 (29.4%) |
| 65 to 74 Years | 59 (100.0%) | 22 (37.3%) |
| 75 Years and over | 68 (100.0%) | 39 (57.4%) |
| Total | 217 (62.9%) | 121 (35.1%) |
Disability Status by Sex by Age in Sasser
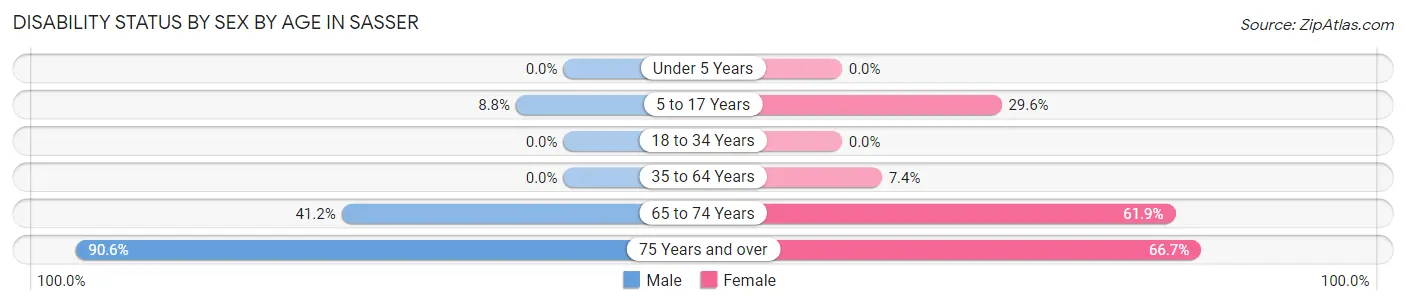
| Age Bracket | Male | Female |
| Under 5 Years | 0 (0.0%) | 0 (0.0%) |
| 5 to 17 Years | 3 (8.8%) | 8 (29.6%) |
| 18 to 34 Years | 0 (0.0%) | 0 (0.0%) |
| 35 to 64 Years | 0 (0.0%) | 6 (7.4%) |
| 65 to 74 Years | 7 (41.2%) | 26 (61.9%) |
| 75 Years and over | 48 (90.6%) | 10 (66.7%) |
Disability Class by Sex by Age in Sasser
Disability Class: Hearing Difficulty
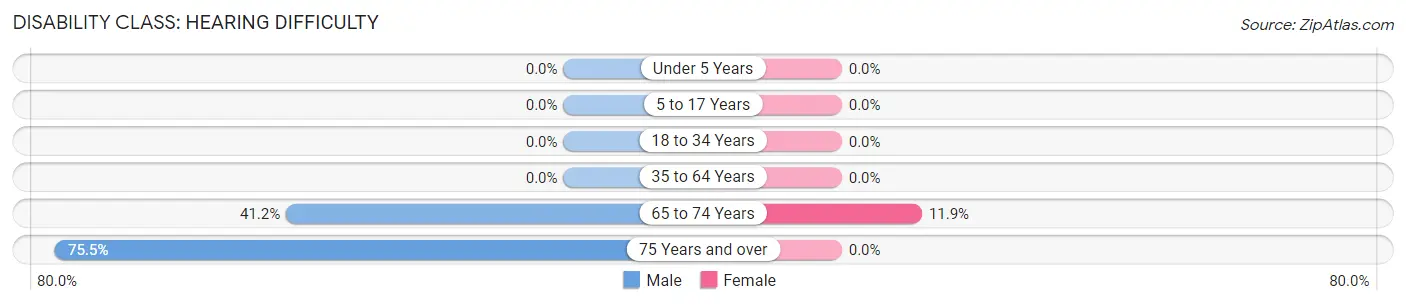
| Age Bracket | Male | Female |
| Under 5 Years | 0 (0.0%) | 0 (0.0%) |
| 5 to 17 Years | 0 (0.0%) | 0 (0.0%) |
| 18 to 34 Years | 0 (0.0%) | 0 (0.0%) |
| 35 to 64 Years | 0 (0.0%) | 0 (0.0%) |
| 65 to 74 Years | 7 (41.2%) | 5 (11.9%) |
| 75 Years and over | 40 (75.5%) | 0 (0.0%) |
Disability Class: Vision Difficulty
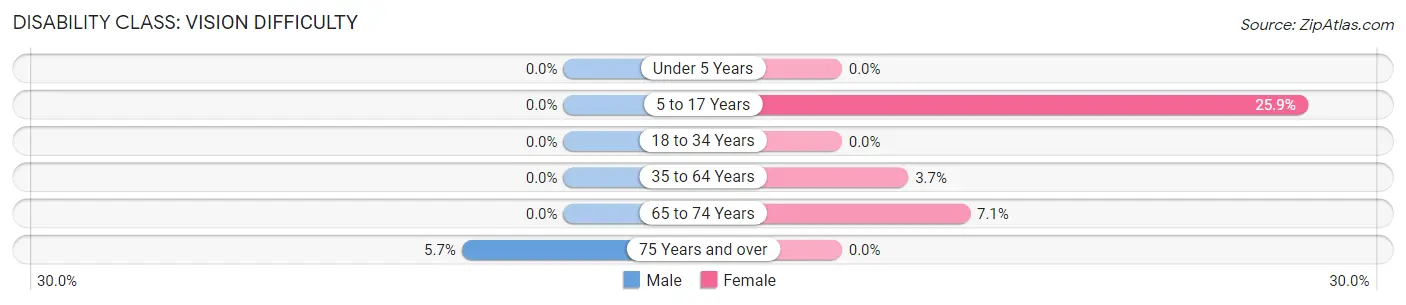
| Age Bracket | Male | Female |
| Under 5 Years | 0 (0.0%) | 0 (0.0%) |
| 5 to 17 Years | 0 (0.0%) | 7 (25.9%) |
| 18 to 34 Years | 0 (0.0%) | 0 (0.0%) |
| 35 to 64 Years | 0 (0.0%) | 3 (3.7%) |
| 65 to 74 Years | 0 (0.0%) | 3 (7.1%) |
| 75 Years and over | 3 (5.7%) | 0 (0.0%) |
Disability Class: Cognitive Difficulty
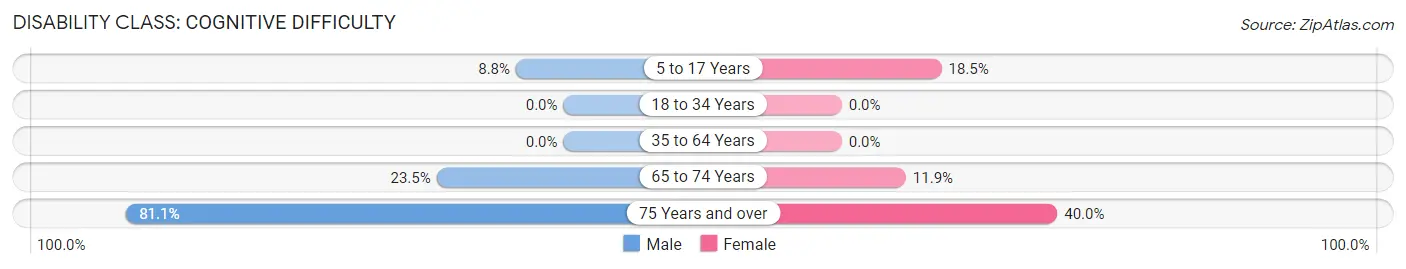
| Age Bracket | Male | Female |
| 5 to 17 Years | 3 (8.8%) | 5 (18.5%) |
| 18 to 34 Years | 0 (0.0%) | 0 (0.0%) |
| 35 to 64 Years | 0 (0.0%) | 0 (0.0%) |
| 65 to 74 Years | 4 (23.5%) | 5 (11.9%) |
| 75 Years and over | 43 (81.1%) | 6 (40.0%) |
Disability Class: Ambulatory Difficulty
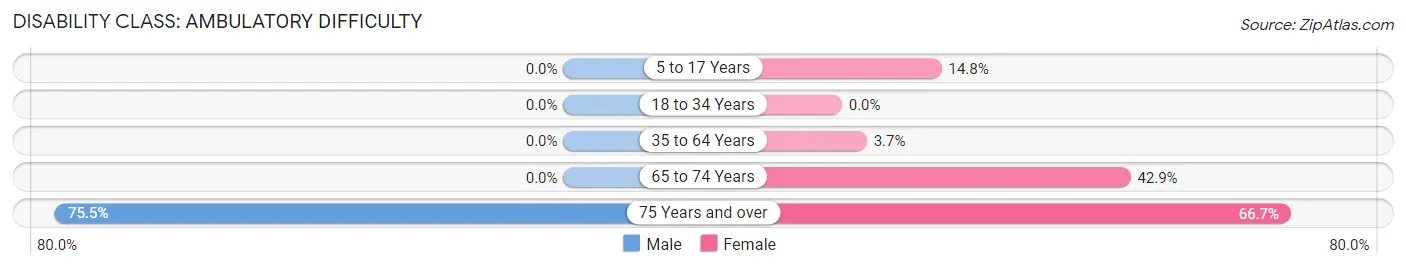
| Age Bracket | Male | Female |
| 5 to 17 Years | 0 (0.0%) | 4 (14.8%) |
| 18 to 34 Years | 0 (0.0%) | 0 (0.0%) |
| 35 to 64 Years | 0 (0.0%) | 3 (3.7%) |
| 65 to 74 Years | 0 (0.0%) | 18 (42.9%) |
| 75 Years and over | 40 (75.5%) | 10 (66.7%) |
Disability Class: Self-Care Difficulty
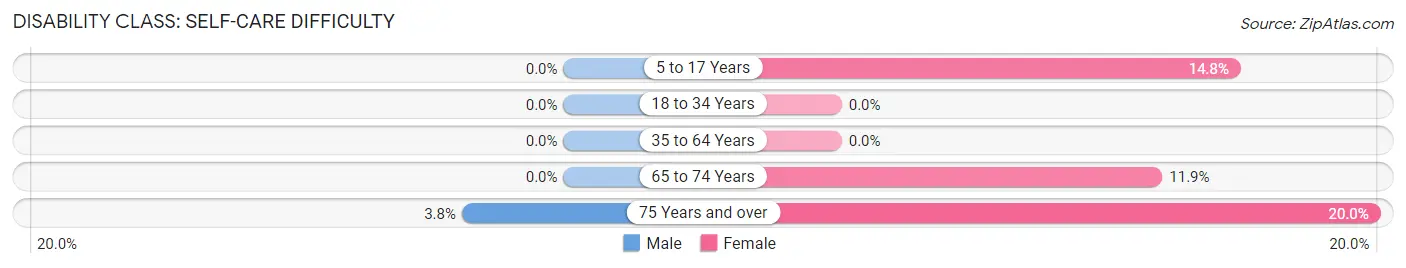
| Age Bracket | Male | Female |
| 5 to 17 Years | 0 (0.0%) | 4 (14.8%) |
| 18 to 34 Years | 0 (0.0%) | 0 (0.0%) |
| 35 to 64 Years | 0 (0.0%) | 0 (0.0%) |
| 65 to 74 Years | 0 (0.0%) | 5 (11.9%) |
| 75 Years and over | 2 (3.8%) | 3 (20.0%) |
Technology Access in Sasser
Computing Device Access in Sasser
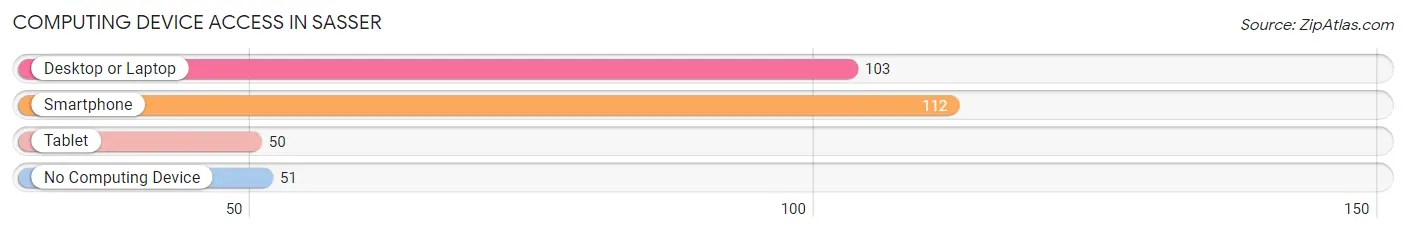
| Device Type | # Households | % Households |
| Desktop or Laptop | 103 | 61.3% |
| Smartphone | 112 | 66.7% |
| Tablet | 50 | 29.8% |
| No Computing Device | 51 | 30.4% |
| Total | 168 | 100.0% |
Internet Access in Sasser
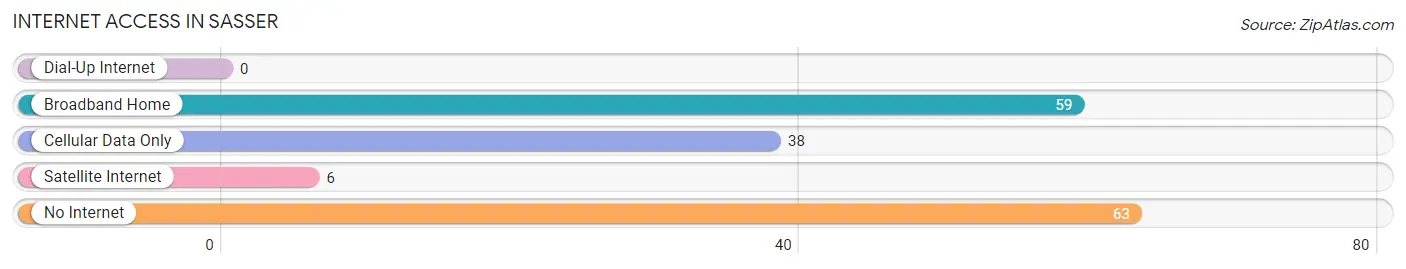
| Internet Type | # Households | % Households |
| Dial-Up Internet | 0 | 0.0% |
| Broadband Home | 59 | 35.1% |
| Cellular Data Only | 38 | 22.6% |
| Satellite Internet | 6 | 3.6% |
| No Internet | 63 | 37.5% |
| Total | 168 | 100.0% |
Sasser Summary
Sasser is a small town located in Worth County, Georgia, United States. It is situated about 10 miles south of Sylvester and about 20 miles north of Albany. The population of Sasser was estimated to be 545 in 2019.
History
Sasser was founded in 1887 by the Central of Georgia Railway. The town was named after the Sasser family, who owned the land on which the town was built. The town was incorporated in 1889.
In the early 1900s, Sasser was a thriving agricultural community. Cotton was the main crop grown in the area, and the town had several cotton gins and a cottonseed oil mill. The town also had a sawmill, a grist mill, and a brickyard.
In the 1920s, Sasser began to decline as the cotton industry declined. The town was hit hard by the Great Depression, and many of the businesses in town closed.
In the 1940s, Sasser began to experience a resurgence. The town was home to a large poultry processing plant, which provided jobs for many of the town’s residents. The town also had a number of small businesses, including a grocery store, a hardware store, and a drug store.
Geography
Sasser is located in the southwestern corner of Worth County, Georgia. The town is situated on the banks of the Flint River, which flows through the town. The town is surrounded by farmland and is located about 10 miles south of Sylvester and about 20 miles north of Albany.
The climate in Sasser is humid subtropical, with hot, humid summers and mild winters. The average annual temperature is around 70 degrees Fahrenheit. The average annual precipitation is around 50 inches.
Economy
The economy of Sasser is largely based on agriculture. The town is home to several farms, which grow cotton, corn, soybeans, and other crops. The town also has a poultry processing plant, which provides jobs for many of the town’s residents.
In addition to agriculture, Sasser has a number of small businesses, including a grocery store, a hardware store, and a drug store. The town also has a number of restaurants and other small businesses.
Demographics
As of 2019, the population of Sasser was estimated to be 545. The town is predominantly white, with about 90% of the population being white. The remaining 10% of the population is made up of African Americans, Hispanics, and other ethnicities.
The median household income in Sasser is around $35,000, and the median home value is around $90,000. The town has a poverty rate of around 20%, which is higher than the national average.
Conclusion
Sasser is a small town located in Worth County, Georgia. The town was founded in 1887 and was once a thriving agricultural community. Today, the town’s economy is largely based on agriculture, and the town also has a number of small businesses. The population of Sasser is predominantly white, with a median household income of around $35,000 and a median home value of around $90,000.
Common Questions
What is the Total Population of Sasser?
Total Population of Sasser is 345.
What is the Total Male Population of Sasser?
Total Male Population of Sasser is 160.
What is the Total Female Population of Sasser?
Total Female Population of Sasser is 185.
What is the Ratio of Males per 100 Females in Sasser?
There are 86.49 Males per 100 Females in Sasser.
What is the Ratio of Females per 100 Males in Sasser?
There are 115.62 Females per 100 Males in Sasser.
What is the Median Population Age in Sasser?
Median Population Age in Sasser is 47.7 Years.
What is the Average Family Size in Sasser
Average Family Size in Sasser is 2.9 People.
What is the Average Household Size in Sasser
Average Household Size in Sasser is 2.0 People.
What is Per Capita Income in Sasser?
Per Capita income in Sasser is $21,789.
What is the Median Family Income in Sasser?
Median Family Income in Sasser is $36,292.
What is the Median Household income in Sasser?
Median Household Income in Sasser is $27,442.
What is Inequality or Gini Index in Sasser?
Inequality or Gini Index in Sasser is 0.41.
How Large is the Labor Force in Sasser?
There are 189 People in the Labor Forcein in Sasser.
What is the Percentage of People in the Labor Force in Sasser?
66.5% of People are in the Labor Force in Sasser.
What is the Unemployment Rate in Sasser?
Unemployment Rate in Sasser is 16.9%.