Coventry Lake, CT
Coventry Lake Map
Coventry Lake Overview
2,230
TOTAL POPULATION
1,101
MALE POPULATION
1,129
FEMALE POPULATION
97.52
MALES / 100 FEMALES
102.54
FEMALES / 100 MALES
55.9
MEDIAN AGE
2.5
AVG FAMILY SIZE
2.0
AVG HOUSEHOLD SIZE
$60,074
PER CAPITA INCOME
$105,069
AVG FAMILY INCOME
$86,394
AVG HOUSEHOLD INCOME
46.1%
WAGE / INCOME GAP [ % ]
53.9¢/ $1
WAGE / INCOME GAP [ $ ]
0.50
INEQUALITY / GINI INDEX
1,235
LABOR FORCE [ PEOPLE ]
62.4%
PERCENT IN LABOR FORCE
3.7%
UNEMPLOYMENT RATE
Race in Coventry Lake
The most populous races in Coventry Lake are White / Caucasian (2,111 | 94.7%), Hispanic or Latino (195 | 8.7%), and Two or more Races (58 | 2.6%).
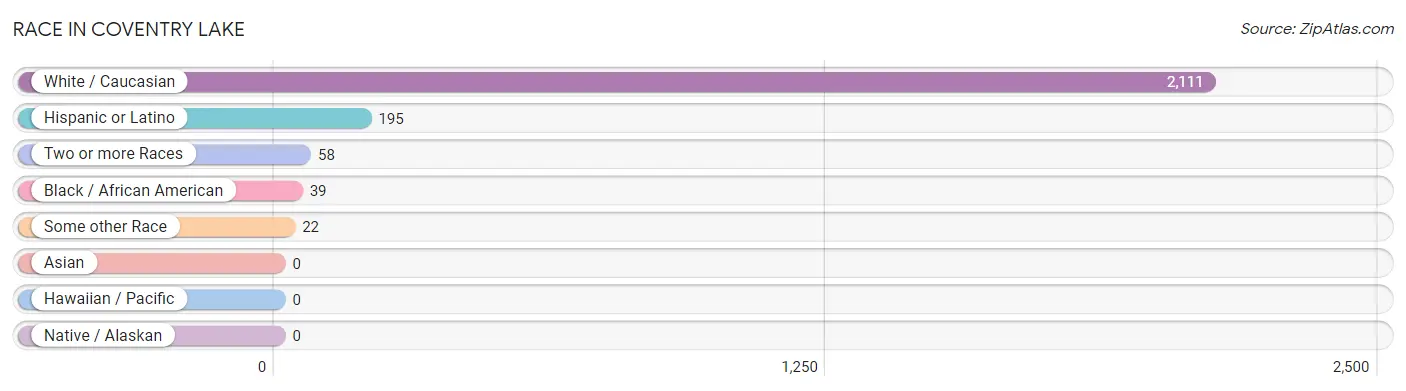
| Race | # Population | % Population |
| Asian | 0 | 0.0% |
| Black / African American | 39 | 1.8% |
| Hawaiian / Pacific | 0 | 0.0% |
| Hispanic or Latino | 195 | 8.7% |
| Native / Alaskan | 0 | 0.0% |
| White / Caucasian | 2,111 | 94.7% |
| Two or more Races | 58 | 2.6% |
| Some other Race | 22 | 1.0% |
| Total | 2,230 | 100.0% |
Ancestry in Coventry Lake
The most populous ancestries reported in Coventry Lake are Irish (522 | 23.4%), Italian (435 | 19.5%), English (289 | 13.0%), German (259 | 11.6%), and French (177 | 7.9%), together accounting for 75.4% of all Coventry Lake residents.
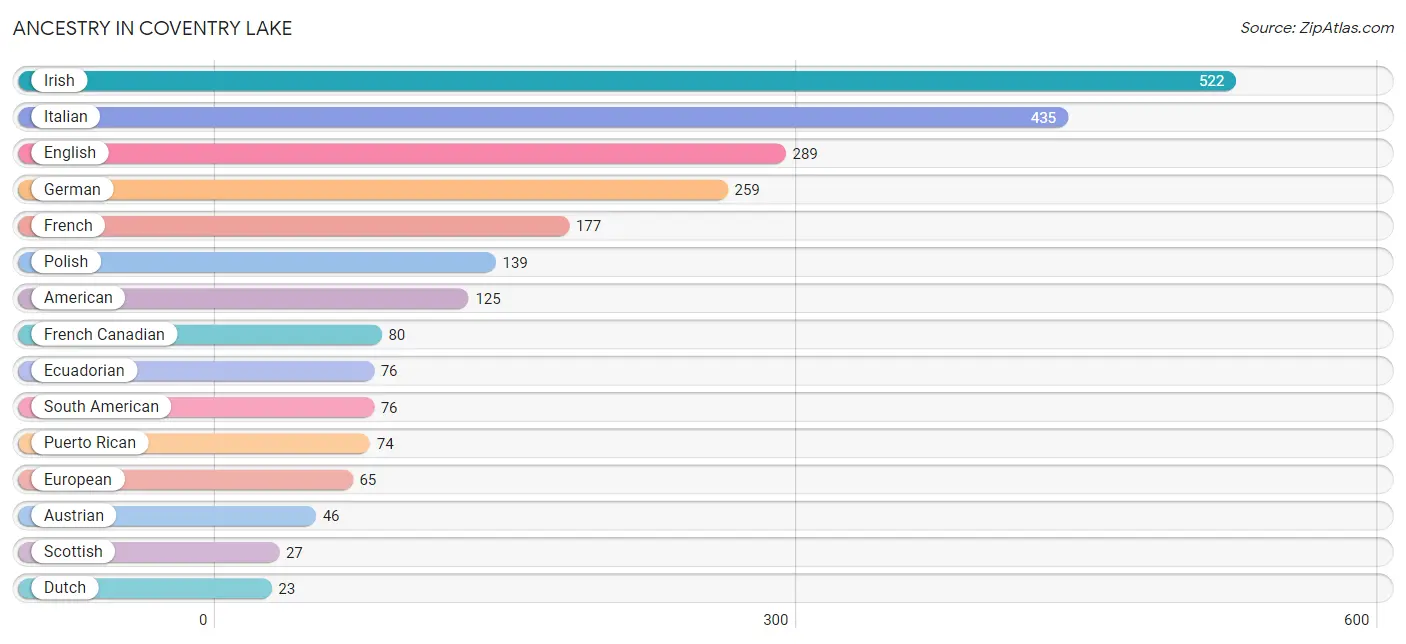
| Ancestry | # Population | % Population |
| American | 125 | 5.6% |
| Austrian | 46 | 2.1% |
| Danish | 16 | 0.7% |
| Dutch | 23 | 1.0% |
| Ecuadorian | 76 | 3.4% |
| English | 289 | 13.0% |
| European | 65 | 2.9% |
| French | 177 | 7.9% |
| French Canadian | 80 | 3.6% |
| German | 259 | 11.6% |
| Irish | 522 | 23.4% |
| Italian | 435 | 19.5% |
| Norwegian | 12 | 0.5% |
| Polish | 139 | 6.2% |
| Puerto Rican | 74 | 3.3% |
| Scandinavian | 18 | 0.8% |
| Scottish | 27 | 1.2% |
| South American | 76 | 3.4% |
| Swedish | 19 | 0.9% |
| Turkish | 17 | 0.8% |
| Ukrainian | 15 | 0.7% | View All 21 Rows |
Immigrants in Coventry Lake
The most numerous immigrant groups reported in Coventry Lake came from Latin America (43 | 1.9%), Central America (23 | 1.0%), Mexico (23 | 1.0%), Ecuador (20 | 0.9%), and South America (20 | 0.9%), together accounting for 5.8% of all Coventry Lake residents.
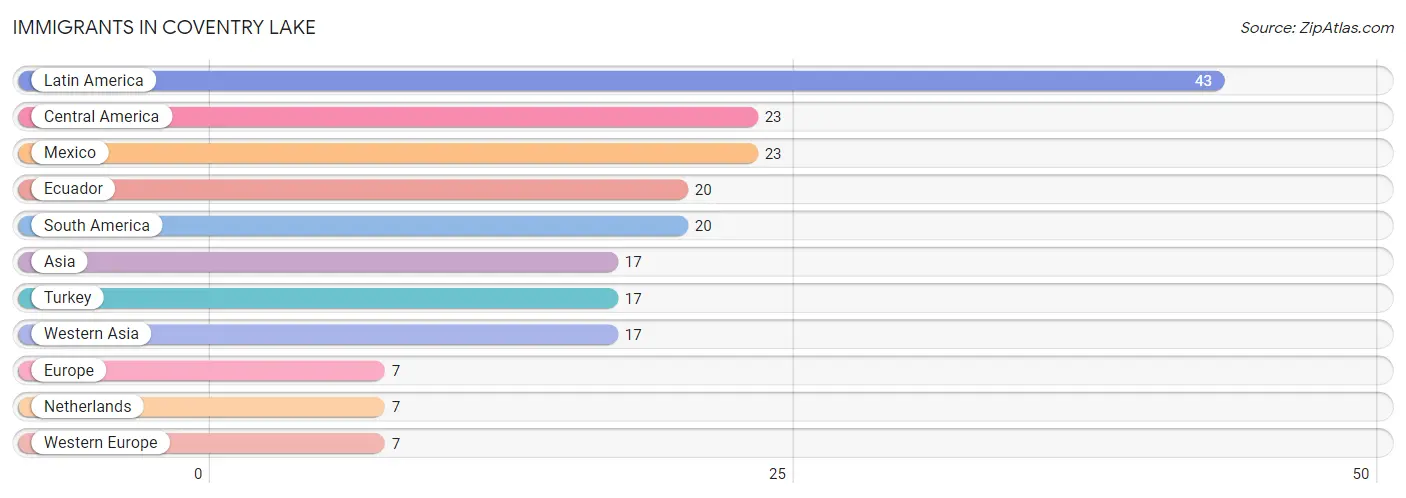
| Immigration Origin | # Population | % Population |
| Asia | 17 | 0.8% |
| Central America | 23 | 1.0% |
| Ecuador | 20 | 0.9% |
| Europe | 7 | 0.3% |
| Latin America | 43 | 1.9% |
| Mexico | 23 | 1.0% |
| Netherlands | 7 | 0.3% |
| South America | 20 | 0.9% |
| Turkey | 17 | 0.8% |
| Western Asia | 17 | 0.8% |
| Western Europe | 7 | 0.3% | View All 11 Rows |
Sex and Age in Coventry Lake
Sex and Age in Coventry Lake
The most populous age groups in Coventry Lake are 55 to 59 Years (155 | 14.1%) for men and 55 to 59 Years (258 | 22.9%) for women.
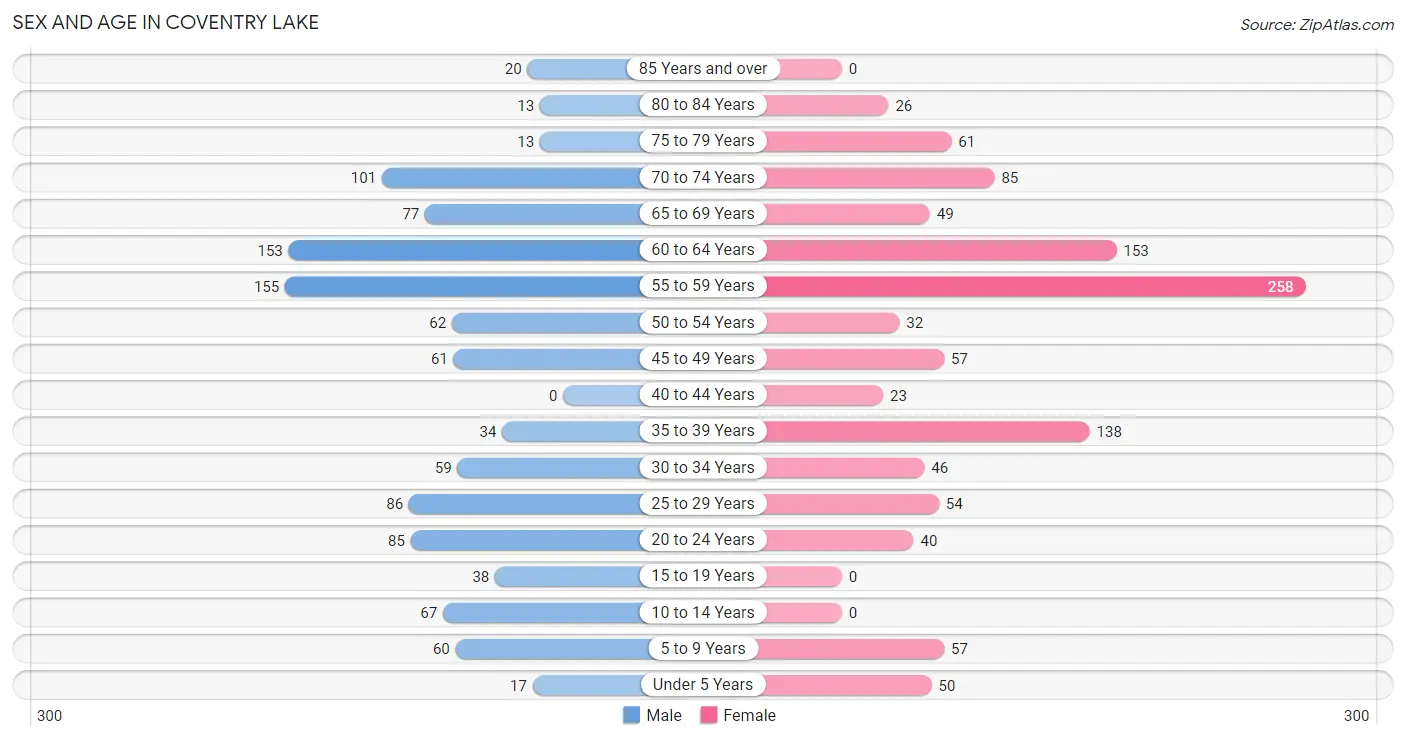
| Age Bracket | Male | Female |
| Under 5 Years | 17 (1.5%) | 50 (4.4%) |
| 5 to 9 Years | 60 (5.4%) | 57 (5.1%) |
| 10 to 14 Years | 67 (6.1%) | 0 (0.0%) |
| 15 to 19 Years | 38 (3.5%) | 0 (0.0%) |
| 20 to 24 Years | 85 (7.7%) | 40 (3.5%) |
| 25 to 29 Years | 86 (7.8%) | 54 (4.8%) |
| 30 to 34 Years | 59 (5.4%) | 46 (4.1%) |
| 35 to 39 Years | 34 (3.1%) | 138 (12.2%) |
| 40 to 44 Years | 0 (0.0%) | 23 (2.0%) |
| 45 to 49 Years | 61 (5.5%) | 57 (5.1%) |
| 50 to 54 Years | 62 (5.6%) | 32 (2.8%) |
| 55 to 59 Years | 155 (14.1%) | 258 (22.9%) |
| 60 to 64 Years | 153 (13.9%) | 153 (13.6%) |
| 65 to 69 Years | 77 (7.0%) | 49 (4.3%) |
| 70 to 74 Years | 101 (9.2%) | 85 (7.5%) |
| 75 to 79 Years | 13 (1.2%) | 61 (5.4%) |
| 80 to 84 Years | 13 (1.2%) | 26 (2.3%) |
| 85 Years and over | 20 (1.8%) | 0 (0.0%) |
| Total | 1,101 (100.0%) | 1,129 (100.0%) |
Families and Households in Coventry Lake
Median Family Size in Coventry Lake
The median family size in Coventry Lake is 2.45 persons per family, with single male/father families (58 | 9.3%) accounting for the largest median family size of 3.24 persons per family. On the other hand, married-couple families (469 | 75.3%) represent the smallest median family size with 2.29 persons per family.
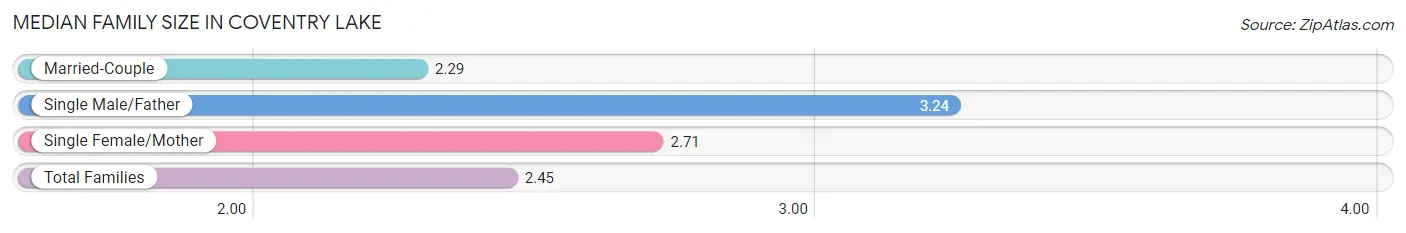
| Family Type | # Families | Family Size |
| Married-Couple | 469 (75.3%) | 2.29 |
| Single Male/Father | 58 (9.3%) | 3.24 |
| Single Female/Mother | 96 (15.4%) | 2.71 |
| Total Families | 623 (100.0%) | 2.45 |
Median Household Size in Coventry Lake
The median household size in Coventry Lake is 1.96 persons per household, with single male/father households (58 | 5.1%) accounting for the largest median household size of 4 persons per household. non-family households (513 | 45.2%) represent the smallest median household size with 1.26 persons per household.
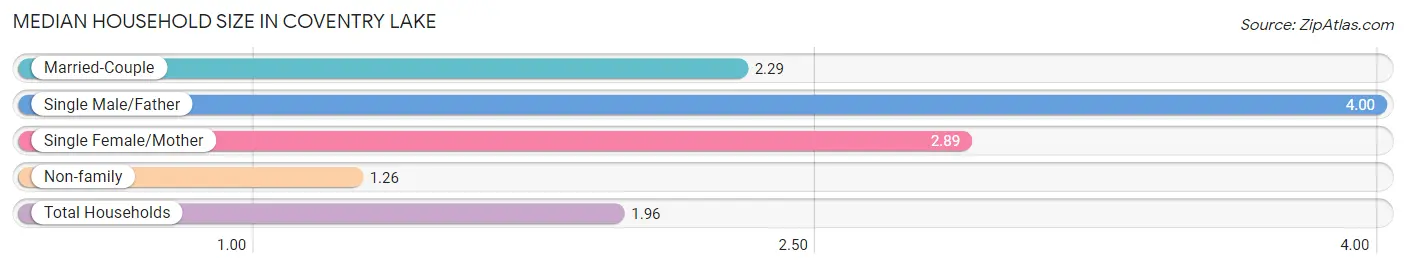
| Household Type | # Households | Household Size |
| Married-Couple | 469 (41.3%) | 2.29 |
| Single Male/Father | 58 (5.1%) | 4.00 |
| Single Female/Mother | 96 (8.5%) | 2.89 |
| Non-family | 513 (45.2%) | 1.26 |
| Total Households | 1,136 (100.0%) | 1.96 |
Household Size by Marriage Status in Coventry Lake
Out of a total of 1,136 households in Coventry Lake, 623 (54.8%) are family households, while 513 (45.2%) are nonfamily households. The most numerous type of family households are 2-person households, comprising 421, and the most common type of nonfamily households are 1-person households, comprising 387.
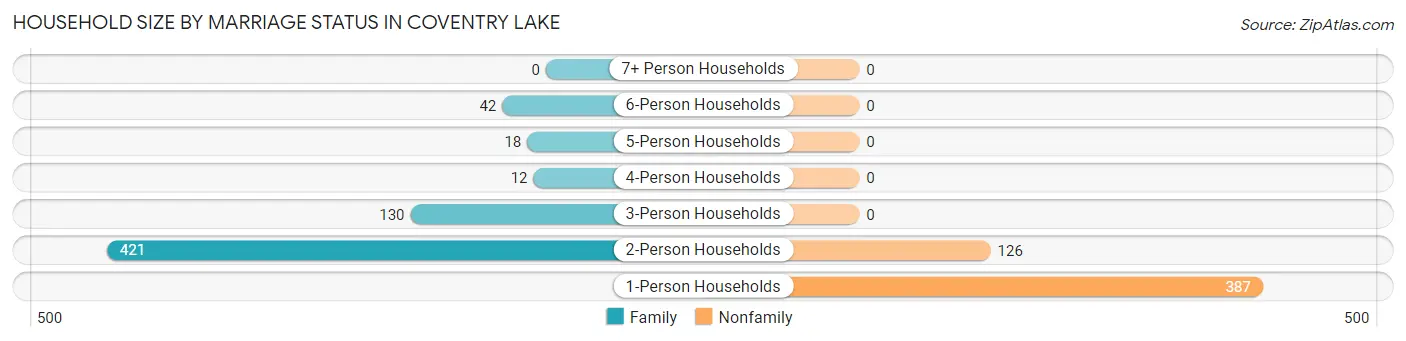
| Household Size | Family Households | Nonfamily Households |
| 1-Person Households | - | 387 (34.1%) |
| 2-Person Households | 421 (37.1%) | 126 (11.1%) |
| 3-Person Households | 130 (11.4%) | 0 (0.0%) |
| 4-Person Households | 12 (1.1%) | 0 (0.0%) |
| 5-Person Households | 18 (1.6%) | 0 (0.0%) |
| 6-Person Households | 42 (3.7%) | 0 (0.0%) |
| 7+ Person Households | 0 (0.0%) | 0 (0.0%) |
| Total | 623 (54.8%) | 513 (45.2%) |
Female Fertility in Coventry Lake
Fertility by Age in Coventry Lake
Average fertility rate in Coventry Lake is 138.0 births per 1,000 women. Women in the age bracket of 35 to 50 years have the highest fertility rate with 216.0 births per 1,000 women. Women in the age bracket of 35 to 50 years acount for 100.0% of all women with births.
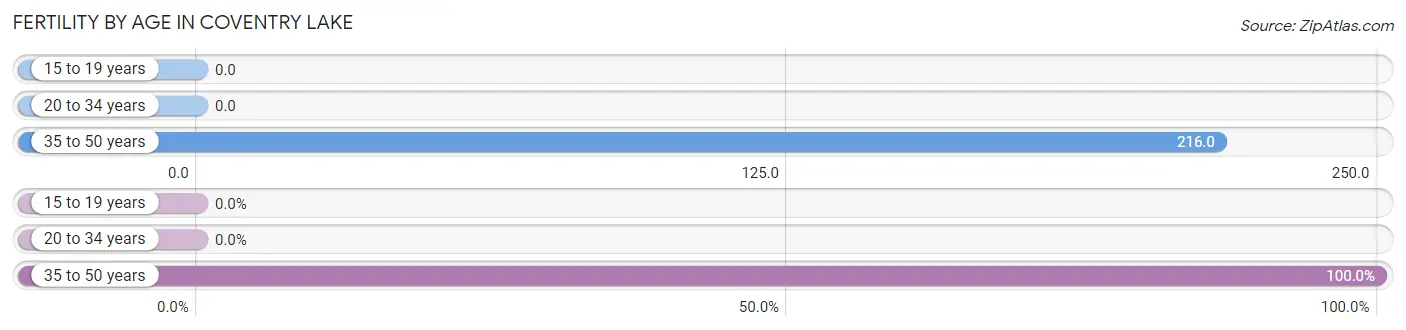
| Age Bracket | Women with Births | Births / 1,000 Women |
| 15 to 19 years | 0 (0.0%) | 0.0 |
| 20 to 34 years | 0 (0.0%) | 0.0 |
| 35 to 50 years | 54 (100.0%) | 216.0 |
| Total | 54 (100.0%) | 138.0 |
Fertility by Age by Marriage Status in Coventry Lake
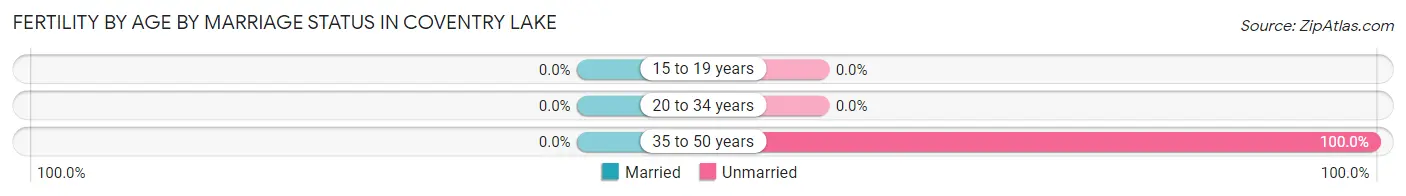
| Age Bracket | Married | Unmarried |
| 15 to 19 years | 0 (0.0%) | 0 (0.0%) |
| 20 to 34 years | 0 (0.0%) | 0 (0.0%) |
| 35 to 50 years | 0 (0.0%) | 54 (100.0%) |
| Total | 0 (0.0%) | 54 (100.0%) |
Fertility by Education in Coventry Lake
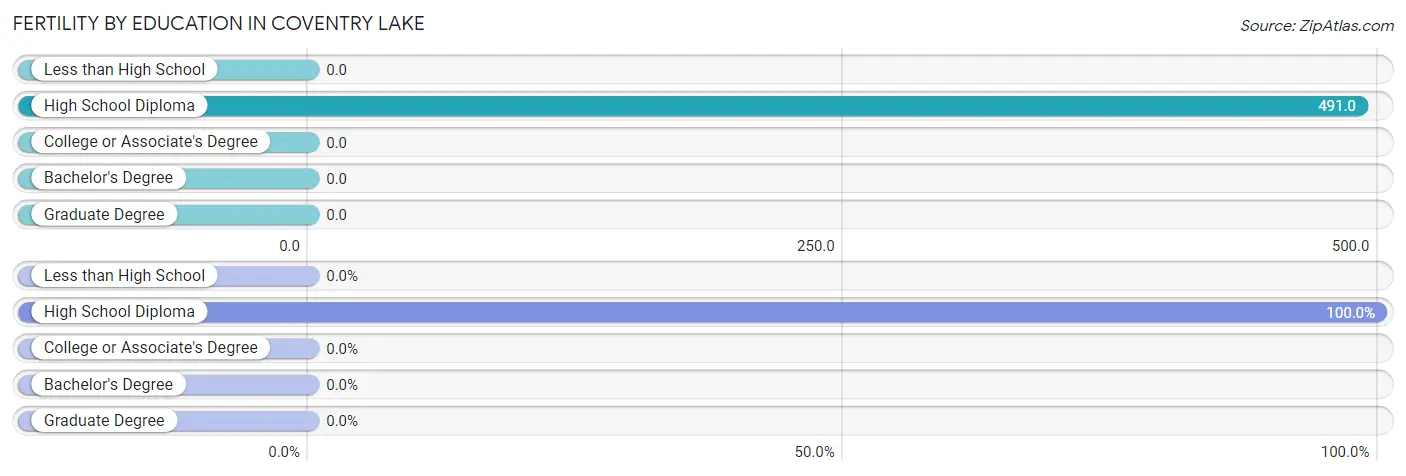
| Educational Attainment | Women with Births | Births / 1,000 Women |
| Less than High School | 0 (0.0%) | 0.0 |
| High School Diploma | 54 (100.0%) | 491.0 |
| College or Associate's Degree | 0 (0.0%) | 0.0 |
| Bachelor's Degree | 0 (0.0%) | 0.0 |
| Graduate Degree | 0 (0.0%) | 0.0 |
| Total | 54 (100.0%) | 138.0 |
Fertility by Education by Marriage Status in Coventry Lake
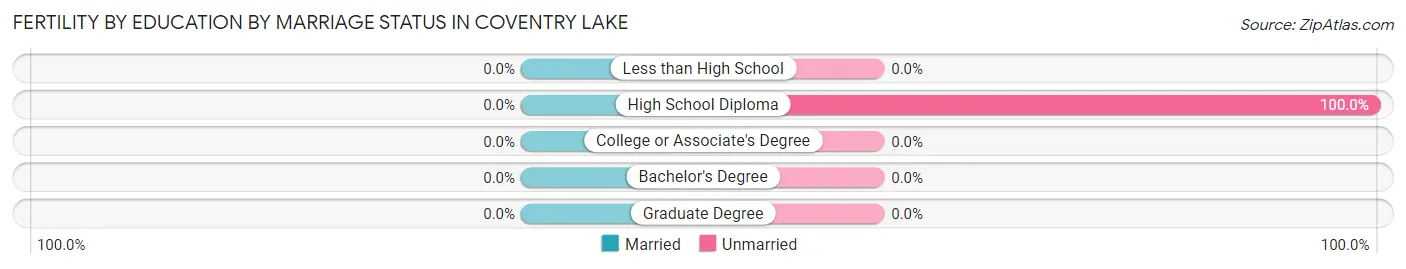
| Educational Attainment | Married | Unmarried |
| Less than High School | 0 (0.0%) | 0 (0.0%) |
| High School Diploma | 0 (0.0%) | 54 (100.0%) |
| College or Associate's Degree | 0 (0.0%) | 0 (0.0%) |
| Bachelor's Degree | 0 (0.0%) | 0 (0.0%) |
| Graduate Degree | 0 (0.0%) | 0 (0.0%) |
| Total | 0 (0.0%) | 54 (100.0%) |
Income in Coventry Lake
Income Overview in Coventry Lake
Per Capita Income in Coventry Lake is $60,074, while median incomes of families and households are $105,069 and $86,394 respectively.
| Characteristic | Number | Measure |
| Per Capita Income | 2,230 | $60,074 |
| Median Family Income | 623 | $105,069 |
| Mean Family Income | 623 | $154,593 |
| Median Household Income | 1,136 | $86,394 |
| Mean Household Income | 1,136 | $117,599 |
| Income Deficit | 623 | $0 |
| Wage / Income Gap (%) | 2,230 | 46.12% |
| Wage / Income Gap ($) | 2,230 | 53.88¢ per $1 |
| Gini / Inequality Index | 2,230 | 0.50 |
Earnings by Sex in Coventry Lake
Average Earnings in Coventry Lake are $44,599, $60,625 for men and $32,667 for women, a difference of 46.1%.
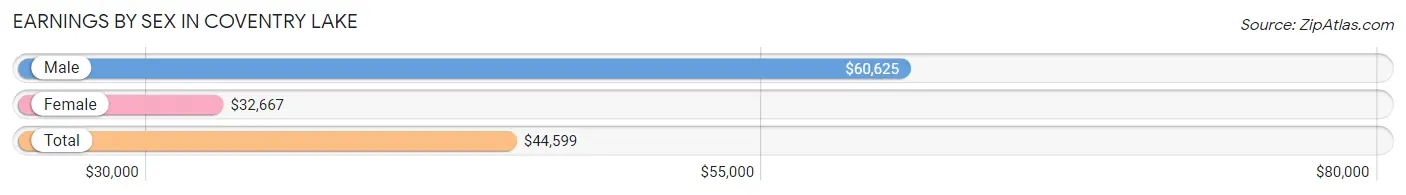
| Sex | Number | Average Earnings |
| Male | 759 (54.0%) | $60,625 |
| Female | 646 (46.0%) | $32,667 |
| Total | 1,405 (100.0%) | $44,599 |
Earnings by Sex by Income Bracket in Coventry Lake
The most common earnings brackets in Coventry Lake are $100,000+ for men (167 | 22.0%) and $75,000 to $99,999 for women (145 | 22.5%).
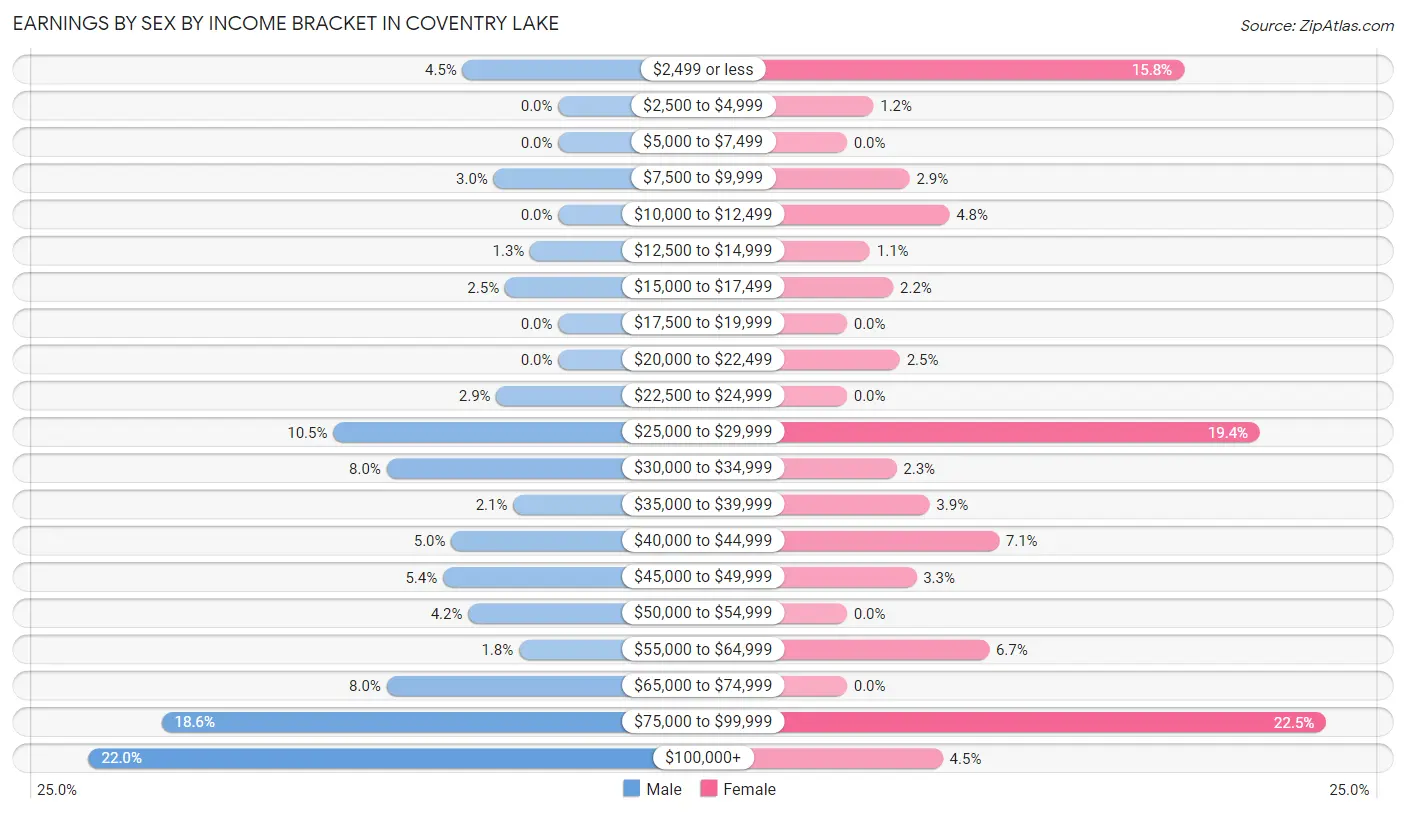
| Income | Male | Female |
| $2,499 or less | 34 (4.5%) | 102 (15.8%) |
| $2,500 to $4,999 | 0 (0.0%) | 8 (1.2%) |
| $5,000 to $7,499 | 0 (0.0%) | 0 (0.0%) |
| $7,500 to $9,999 | 23 (3.0%) | 19 (2.9%) |
| $10,000 to $12,499 | 0 (0.0%) | 31 (4.8%) |
| $12,500 to $14,999 | 10 (1.3%) | 7 (1.1%) |
| $15,000 to $17,499 | 19 (2.5%) | 14 (2.2%) |
| $17,500 to $19,999 | 0 (0.0%) | 0 (0.0%) |
| $20,000 to $22,499 | 0 (0.0%) | 16 (2.5%) |
| $22,500 to $24,999 | 22 (2.9%) | 0 (0.0%) |
| $25,000 to $29,999 | 80 (10.5%) | 125 (19.4%) |
| $30,000 to $34,999 | 61 (8.0%) | 15 (2.3%) |
| $35,000 to $39,999 | 16 (2.1%) | 25 (3.9%) |
| $40,000 to $44,999 | 38 (5.0%) | 46 (7.1%) |
| $45,000 to $49,999 | 41 (5.4%) | 21 (3.3%) |
| $50,000 to $54,999 | 32 (4.2%) | 0 (0.0%) |
| $55,000 to $64,999 | 14 (1.8%) | 43 (6.7%) |
| $65,000 to $74,999 | 61 (8.0%) | 0 (0.0%) |
| $75,000 to $99,999 | 141 (18.6%) | 145 (22.5%) |
| $100,000+ | 167 (22.0%) | 29 (4.5%) |
| Total | 759 (100.0%) | 646 (100.0%) |
Earnings by Sex by Educational Attainment in Coventry Lake
Average earnings in Coventry Lake are $69,655 for men and $35,600 for women, a difference of 48.9%. Men with an educational attainment of graduate degree enjoy the highest average annual earnings of $140,583, while those with high school diploma education earn the least with $32,336. Women with an educational attainment of graduate degree earn the most with the average annual earnings of $80,082, while those with high school diploma education have the smallest earnings of $2,499.
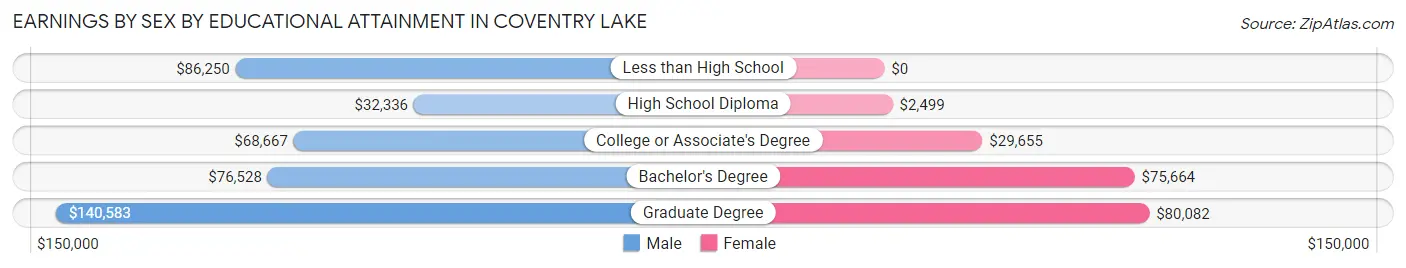
| Educational Attainment | Male Income | Female Income |
| Less than High School | $86,250 | $0 |
| High School Diploma | $32,336 | $2,499 |
| College or Associate's Degree | $68,667 | $29,655 |
| Bachelor's Degree | $76,528 | $75,664 |
| Graduate Degree | $140,583 | $80,082 |
| Total | $69,655 | $35,600 |
Family Income in Coventry Lake
Family Income Brackets in Coventry Lake
According to the Coventry Lake family income data, there are 149 families falling into the $100,000 to $149,999 income range, which is the most common income bracket and makes up 23.9% of all families.
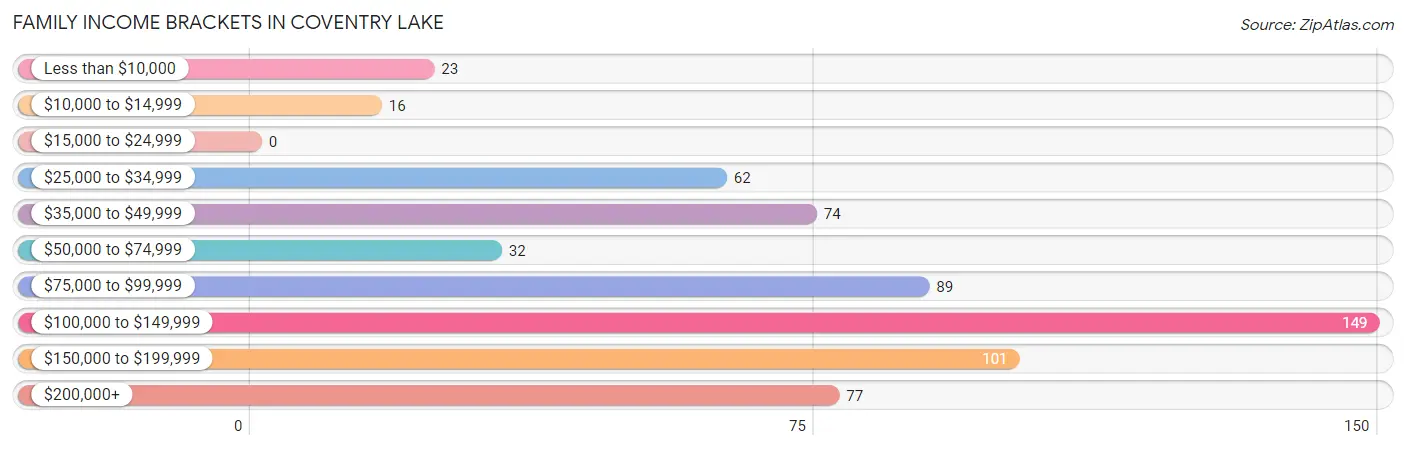
| Income Bracket | # Families | % Families |
| Less than $10,000 | 23 | 3.7% |
| $10,000 to $14,999 | 16 | 2.6% |
| $15,000 to $24,999 | 0 | 0.0% |
| $25,000 to $34,999 | 62 | 10.0% |
| $35,000 to $49,999 | 74 | 11.9% |
| $50,000 to $74,999 | 32 | 5.1% |
| $75,000 to $99,999 | 89 | 14.3% |
| $100,000 to $149,999 | 149 | 23.9% |
| $150,000 to $199,999 | 101 | 16.2% |
| $200,000+ | 77 | 12.4% |
Family Income by Famaliy Size in Coventry Lake
2-person families (437 | 70.1%) account for the highest median family income in Coventry Lake with $118,583 per family, while 2-person families (437 | 70.1%) have the highest median income of $59,292 per family member.
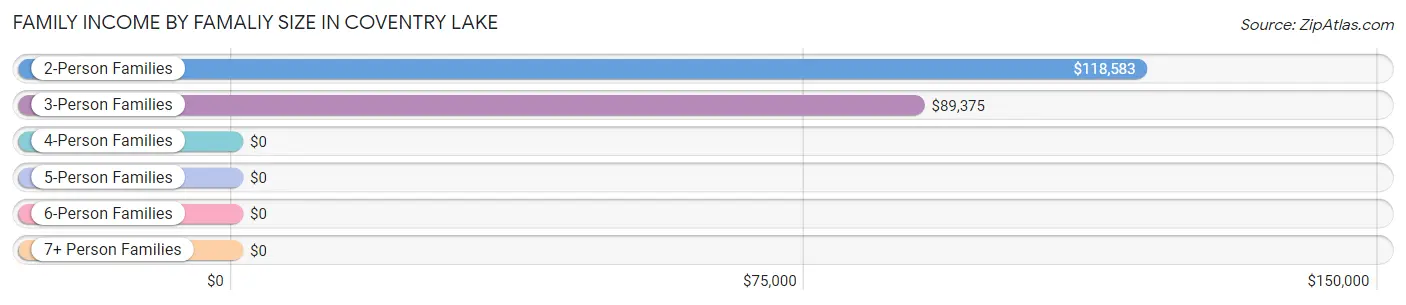
| Income Bracket | # Families | Median Income |
| 2-Person Families | 437 (70.1%) | $118,583 |
| 3-Person Families | 126 (20.2%) | $89,375 |
| 4-Person Families | 0 (0.0%) | $0 |
| 5-Person Families | 60 (9.6%) | $0 |
| 6-Person Families | 0 (0.0%) | $0 |
| 7+ Person Families | 0 (0.0%) | $0 |
| Total | 623 (100.0%) | $105,069 |
Family Income by Number of Earners in Coventry Lake
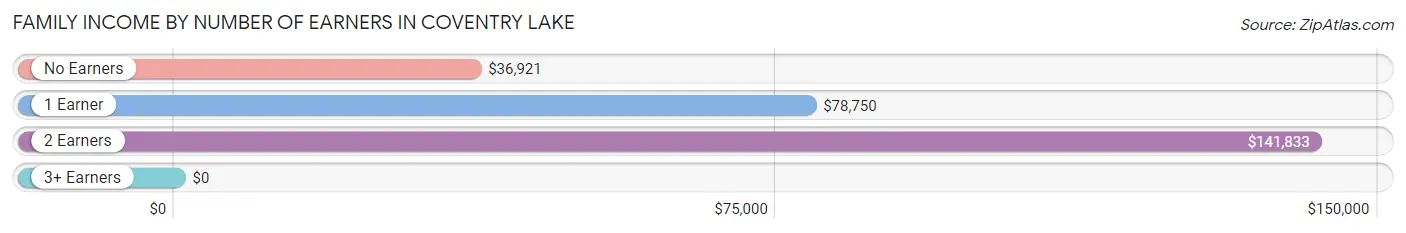
| Number of Earners | # Families | Median Income |
| No Earners | 109 (17.5%) | $36,921 |
| 1 Earner | 196 (31.5%) | $78,750 |
| 2 Earners | 286 (45.9%) | $141,833 |
| 3+ Earners | 32 (5.1%) | $0 |
| Total | 623 (100.0%) | $105,069 |
Household Income in Coventry Lake
Household Income Brackets in Coventry Lake
With 222 households falling in the category, the $100,000 to $149,999 income range is the most frequent in Coventry Lake, accounting for 19.5% of all households. In contrast, only 16 households (1.4%) fall into the $10,000 to $14,999 income bracket, making it the least populous group.
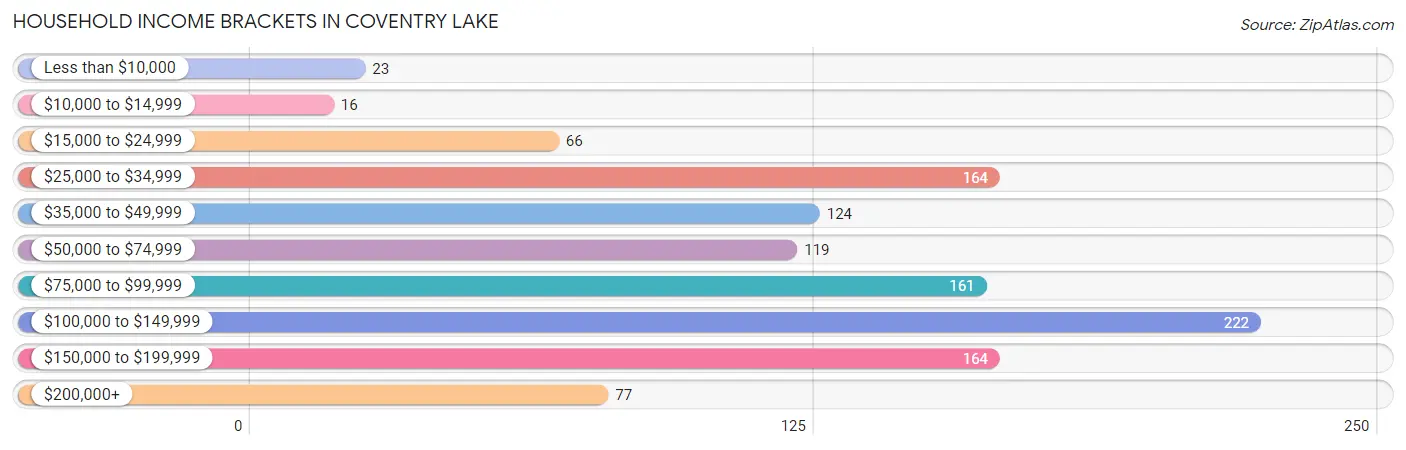
| Income Bracket | # Households | % Households |
| Less than $10,000 | 23 | 2.0% |
| $10,000 to $14,999 | 16 | 1.4% |
| $15,000 to $24,999 | 66 | 5.8% |
| $25,000 to $34,999 | 164 | 14.4% |
| $35,000 to $49,999 | 124 | 10.9% |
| $50,000 to $74,999 | 119 | 10.5% |
| $75,000 to $99,999 | 161 | 14.2% |
| $100,000 to $149,999 | 222 | 19.5% |
| $150,000 to $199,999 | 164 | 14.4% |
| $200,000+ | 77 | 6.8% |
Household Income by Householder Age in Coventry Lake
The median household income in Coventry Lake is $86,394, with the highest median household income of $110,588 found in the 45 to 64 years age bracket for the primary householder. A total of 502 households (44.2%) fall into this category. Meanwhile, the 15 to 24 years age bracket for the primary householder has the lowest median household income of $0, with 41 households (3.6%) in this group.
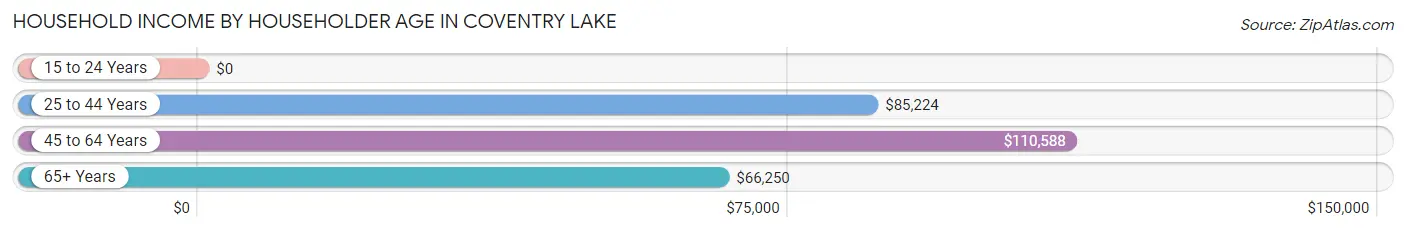
| Income Bracket | # Households | Median Income |
| 15 to 24 Years | 41 (3.6%) | $0 |
| 25 to 44 Years | 269 (23.7%) | $85,224 |
| 45 to 64 Years | 502 (44.2%) | $110,588 |
| 65+ Years | 324 (28.5%) | $66,250 |
| Total | 1,136 (100.0%) | $86,394 |
Poverty in Coventry Lake
Income Below Poverty by Sex and Age in Coventry Lake
With 11.4% poverty level for males and 14.8% for females among the residents of Coventry Lake, 5 year old males and under 5 year old females are the most vulnerable to poverty, with 35 males (100.0%) and 33 females (66.0%) in their respective age groups living below the poverty level.
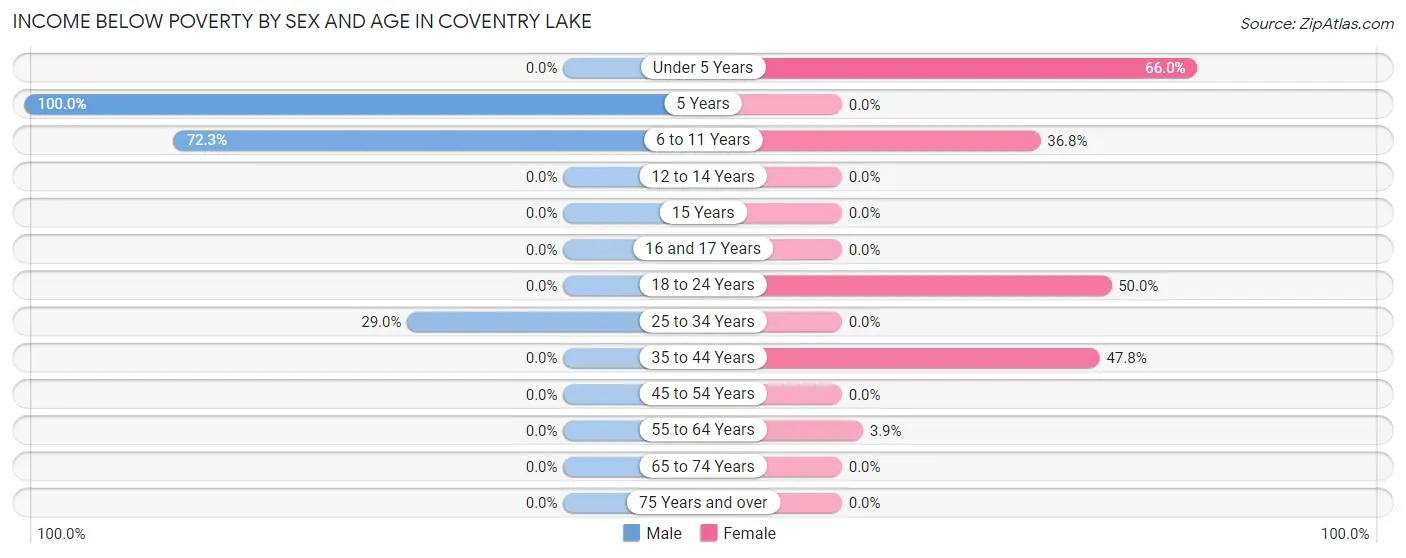
| Age Bracket | Male | Female |
| Under 5 Years | 0 (0.0%) | 33 (66.0%) |
| 5 Years | 35 (100.0%) | 0 (0.0%) |
| 6 to 11 Years | 47 (72.3%) | 21 (36.8%) |
| 12 to 14 Years | 0 (0.0%) | 0 (0.0%) |
| 15 Years | 0 (0.0%) | 0 (0.0%) |
| 16 and 17 Years | 0 (0.0%) | 0 (0.0%) |
| 18 to 24 Years | 0 (0.0%) | 20 (50.0%) |
| 25 to 34 Years | 42 (29.0%) | 0 (0.0%) |
| 35 to 44 Years | 0 (0.0%) | 77 (47.8%) |
| 45 to 54 Years | 0 (0.0%) | 0 (0.0%) |
| 55 to 64 Years | 0 (0.0%) | 16 (3.9%) |
| 65 to 74 Years | 0 (0.0%) | 0 (0.0%) |
| 75 Years and over | 0 (0.0%) | 0 (0.0%) |
| Total | 124 (11.4%) | 167 (14.8%) |
Income Above Poverty by Sex and Age in Coventry Lake
According to the poverty statistics in Coventry Lake, males aged 12 to 14 years and females aged 25 to 34 years are the age groups that are most secure financially, with 100.0% of males and 100.0% of females in these age groups living above the poverty line.
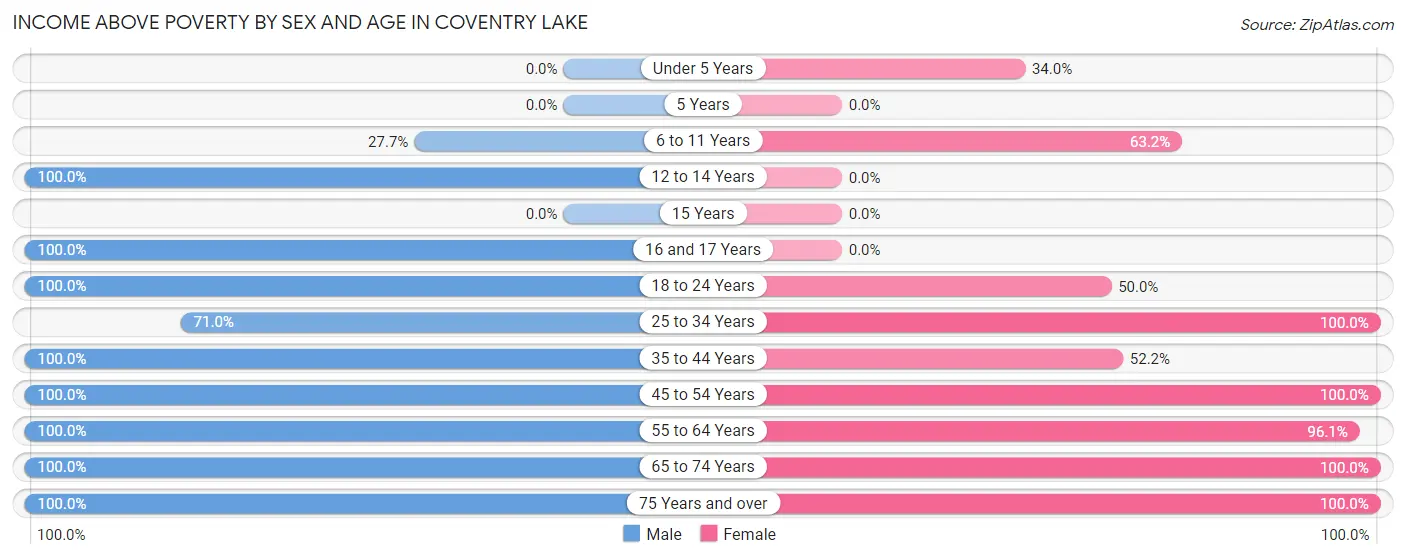
| Age Bracket | Male | Female |
| Under 5 Years | 0 (0.0%) | 17 (34.0%) |
| 5 Years | 0 (0.0%) | 0 (0.0%) |
| 6 to 11 Years | 18 (27.7%) | 36 (63.2%) |
| 12 to 14 Years | 27 (100.0%) | 0 (0.0%) |
| 15 Years | 0 (0.0%) | 0 (0.0%) |
| 16 and 17 Years | 38 (100.0%) | 0 (0.0%) |
| 18 to 24 Years | 85 (100.0%) | 20 (50.0%) |
| 25 to 34 Years | 103 (71.0%) | 100 (100.0%) |
| 35 to 44 Years | 34 (100.0%) | 84 (52.2%) |
| 45 to 54 Years | 123 (100.0%) | 89 (100.0%) |
| 55 to 64 Years | 308 (100.0%) | 395 (96.1%) |
| 65 to 74 Years | 178 (100.0%) | 134 (100.0%) |
| 75 Years and over | 46 (100.0%) | 87 (100.0%) |
| Total | 960 (88.6%) | 962 (85.2%) |
Income Below Poverty Among Married-Couple Families in Coventry Lake
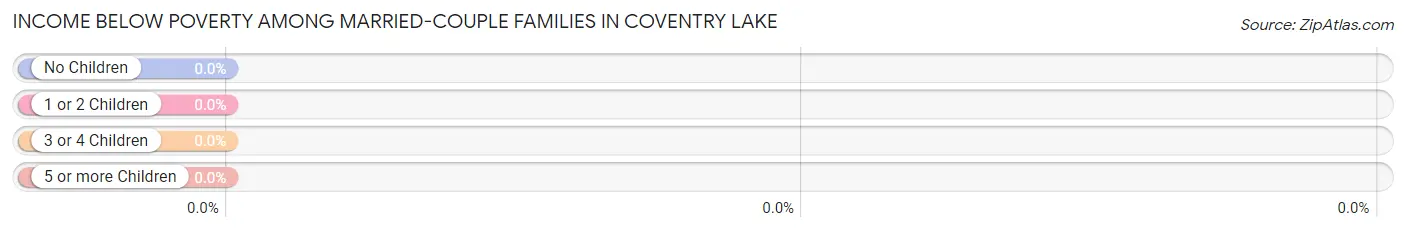
| Children | Above Poverty | Below Poverty |
| No Children | 432 (100.0%) | 0 (0.0%) |
| 1 or 2 Children | 19 (100.0%) | 0 (0.0%) |
| 3 or 4 Children | 18 (100.0%) | 0 (0.0%) |
| 5 or more Children | 0 (0.0%) | 0 (0.0%) |
| Total | 469 (100.0%) | 0 (0.0%) |
Income Below Poverty Among Single-Parent Households in Coventry Lake
According to the poverty data in Coventry Lake, 72.4% or 42 single-father households and 40.6% or 39 single-mother households are living below the poverty line. Among single-father households, those with 3 or 4 children have the highest poverty rate, with 42 households (100.0%) experiencing poverty. Likewise, among single-mother households, those with no children have the highest poverty rate, with 16 households (51.6%) falling below the poverty line.
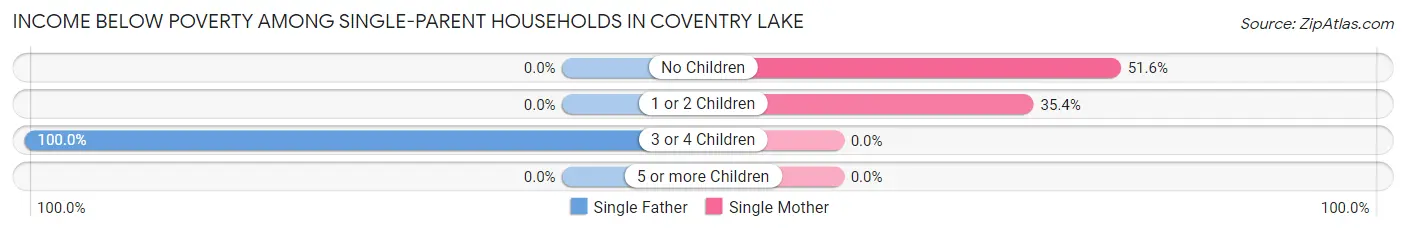
| Children | Single Father | Single Mother |
| No Children | 0 (0.0%) | 16 (51.6%) |
| 1 or 2 Children | 0 (0.0%) | 23 (35.4%) |
| 3 or 4 Children | 42 (100.0%) | 0 (0.0%) |
| 5 or more Children | 0 (0.0%) | 0 (0.0%) |
| Total | 42 (72.4%) | 39 (40.6%) |
Income Below Poverty Among Married-Couple vs Single-Parent Households in Coventry Lake
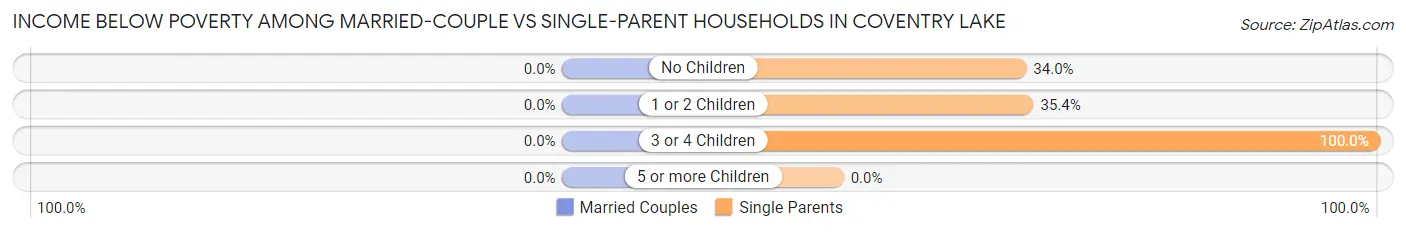
| Children | Married-Couple Families | Single-Parent Households |
| No Children | 0 (0.0%) | 16 (34.0%) |
| 1 or 2 Children | 0 (0.0%) | 23 (35.4%) |
| 3 or 4 Children | 0 (0.0%) | 42 (100.0%) |
| 5 or more Children | 0 (0.0%) | 0 (0.0%) |
| Total | 0 (0.0%) | 81 (52.6%) |
Employment Characteristics in Coventry Lake
Employment by Class of Employer in Coventry Lake
Among the 1,143 employed individuals in Coventry Lake, private company employees (742 | 64.9%), local government employees (184 | 16.1%), and not-for-profit organizations (95 | 8.3%) make up the most common classes of employment.
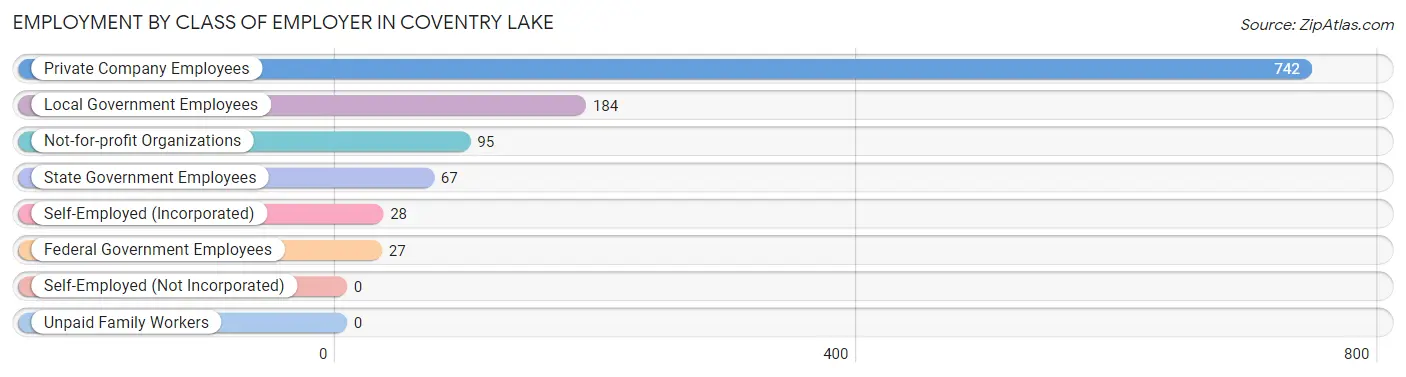
| Employer Class | # Employees | % Employees |
| Private Company Employees | 742 | 64.9% |
| Self-Employed (Incorporated) | 28 | 2.5% |
| Self-Employed (Not Incorporated) | 0 | 0.0% |
| Not-for-profit Organizations | 95 | 8.3% |
| Local Government Employees | 184 | 16.1% |
| State Government Employees | 67 | 5.9% |
| Federal Government Employees | 27 | 2.4% |
| Unpaid Family Workers | 0 | 0.0% |
| Total | 1,143 | 100.0% |
Employment Status by Age in Coventry Lake
According to the labor force statistics for Coventry Lake, out of the total population over 16 years of age (1,979), 62.4% or 1,235 individuals are in the labor force, with 3.7% or 46 of them unemployed. The age group with the highest labor force participation rate is 20 to 24 years, with 100.0% or 125 individuals in the labor force. Within the labor force, the 20 to 24 years age range has the highest percentage of unemployed individuals, with 36.0% or 45 of them being unemployed.
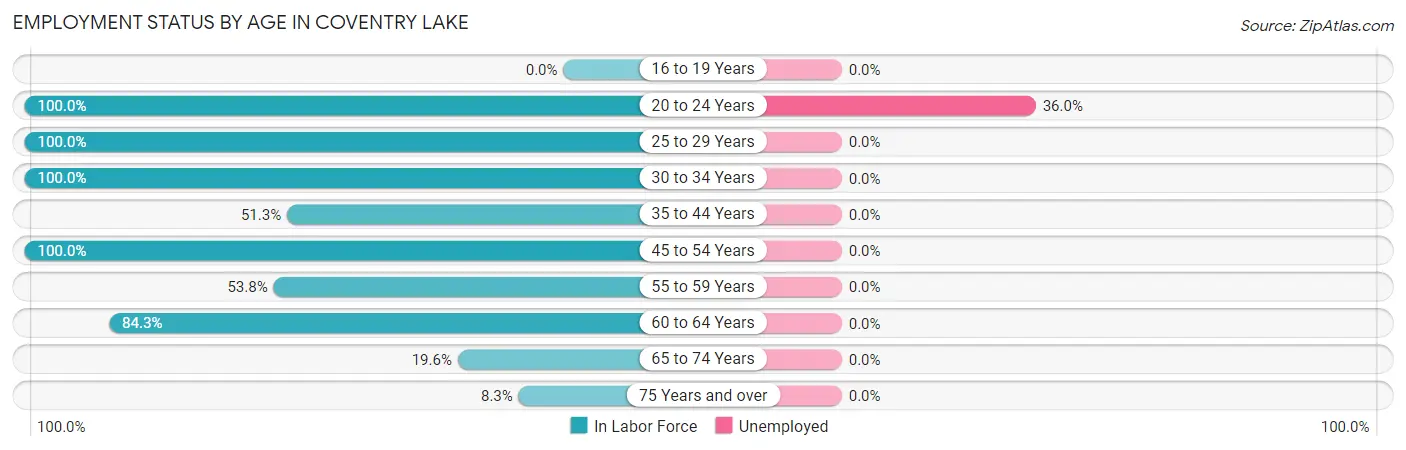
| Age Bracket | In Labor Force | Unemployed |
| 16 to 19 Years | 0 (0.0%) | 0 (0.0%) |
| 20 to 24 Years | 125 (100.0%) | 45 (36.0%) |
| 25 to 29 Years | 140 (100.0%) | 0 (0.0%) |
| 30 to 34 Years | 105 (100.0%) | 0 (0.0%) |
| 35 to 44 Years | 100 (51.3%) | 0 (0.0%) |
| 45 to 54 Years | 212 (100.0%) | 0 (0.0%) |
| 55 to 59 Years | 222 (53.8%) | 0 (0.0%) |
| 60 to 64 Years | 258 (84.3%) | 0 (0.0%) |
| 65 to 74 Years | 61 (19.6%) | 0 (0.0%) |
| 75 Years and over | 11 (8.3%) | 0 (0.0%) |
| Total | 1,235 (62.4%) | 46 (3.7%) |
Employment Status by Educational Attainment in Coventry Lake
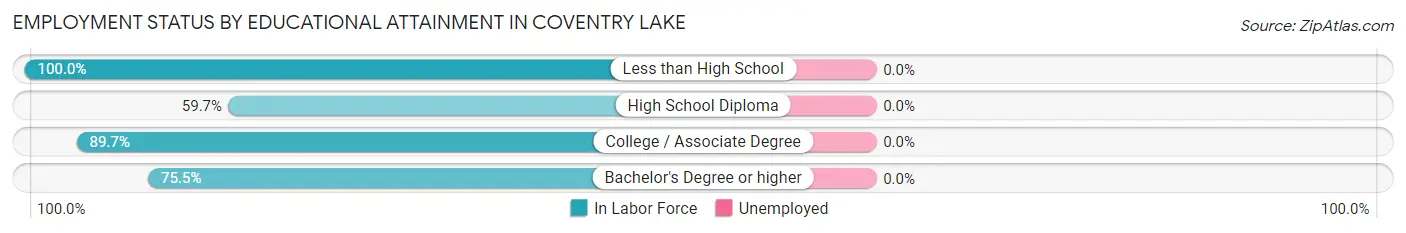
| Educational Attainment | In Labor Force | Unemployed |
| Less than High School | 61 (100.0%) | 0 (0.0%) |
| High School Diploma | 227 (59.7%) | 0 (0.0%) |
| College / Associate Degree | 296 (89.7%) | 0 (0.0%) |
| Bachelor's Degree or higher | 453 (75.5%) | 0 (0.0%) |
| Total | 1,036 (75.6%) | 0 (0.0%) |
Employment Occupations by Sex in Coventry Lake
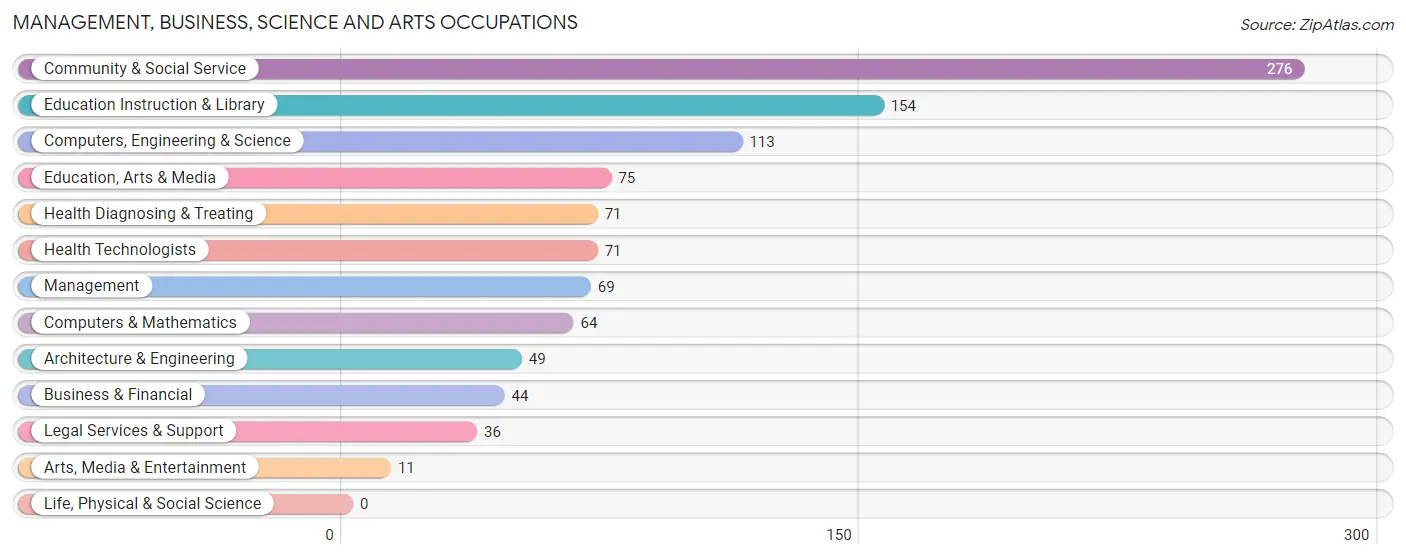
Management, Business, Science and Arts Occupations
The most common Management, Business, Science and Arts occupations in Coventry Lake are Community & Social Service (276 | 23.7%), Education Instruction & Library (154 | 13.3%), Computers, Engineering & Science (113 | 9.7%), Education, Arts & Media (75 | 6.5%), and Health Diagnosing & Treating (71 | 6.1%).
Management, Business, Science and Arts Occupations by Sex
Within the Management, Business, Science and Arts occupations in Coventry Lake, the most male-oriented occupations are Architecture & Engineering (100.0%), Computers, Engineering & Science (86.7%), and Education, Arts & Media (81.3%), while the most female-oriented occupations are Business & Financial (100.0%), Arts, Media & Entertainment (100.0%), and Education Instruction & Library (90.3%).
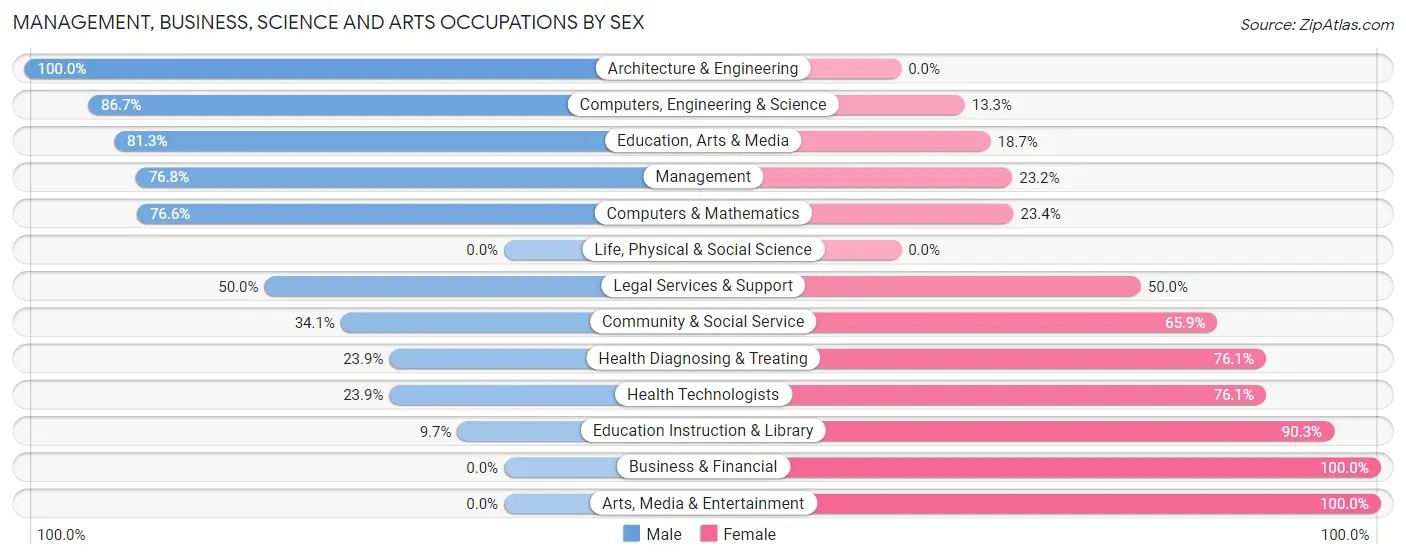
| Occupation | Male | Female |
| Management | 53 (76.8%) | 16 (23.2%) |
| Business & Financial | 0 (0.0%) | 44 (100.0%) |
| Computers, Engineering & Science | 98 (86.7%) | 15 (13.3%) |
| Computers & Mathematics | 49 (76.6%) | 15 (23.4%) |
| Architecture & Engineering | 49 (100.0%) | 0 (0.0%) |
| Life, Physical & Social Science | 0 (0.0%) | 0 (0.0%) |
| Community & Social Service | 94 (34.1%) | 182 (65.9%) |
| Education, Arts & Media | 61 (81.3%) | 14 (18.7%) |
| Legal Services & Support | 18 (50.0%) | 18 (50.0%) |
| Education Instruction & Library | 15 (9.7%) | 139 (90.3%) |
| Arts, Media & Entertainment | 0 (0.0%) | 11 (100.0%) |
| Health Diagnosing & Treating | 17 (23.9%) | 54 (76.1%) |
| Health Technologists | 17 (23.9%) | 54 (76.1%) |
| Total (Category) | 262 (45.7%) | 311 (54.3%) |
| Total (Overall) | 638 (54.9%) | 524 (45.1%) |
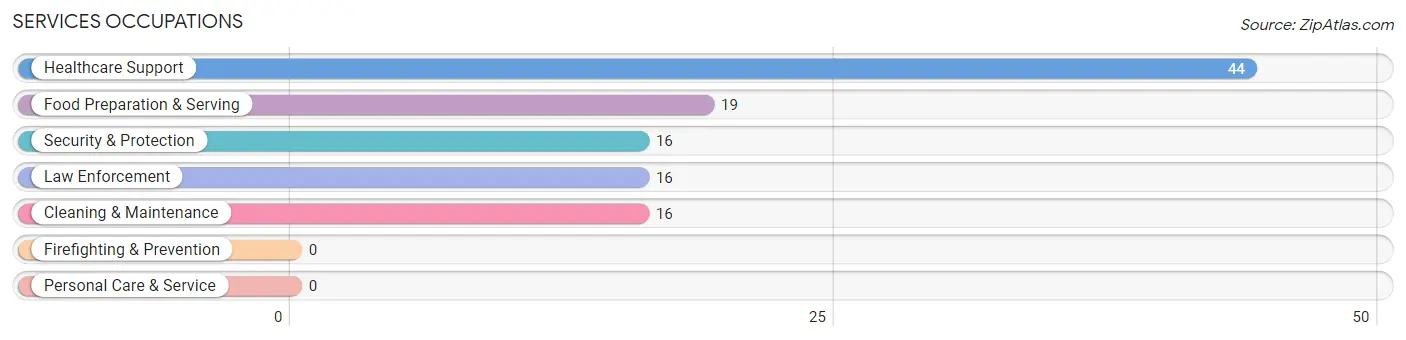
Services Occupations
The most common Services occupations in Coventry Lake are Healthcare Support (44 | 3.8%), Food Preparation & Serving (19 | 1.6%), Security & Protection (16 | 1.4%), Law Enforcement (16 | 1.4%), and Cleaning & Maintenance (16 | 1.4%).
Services Occupations by Sex
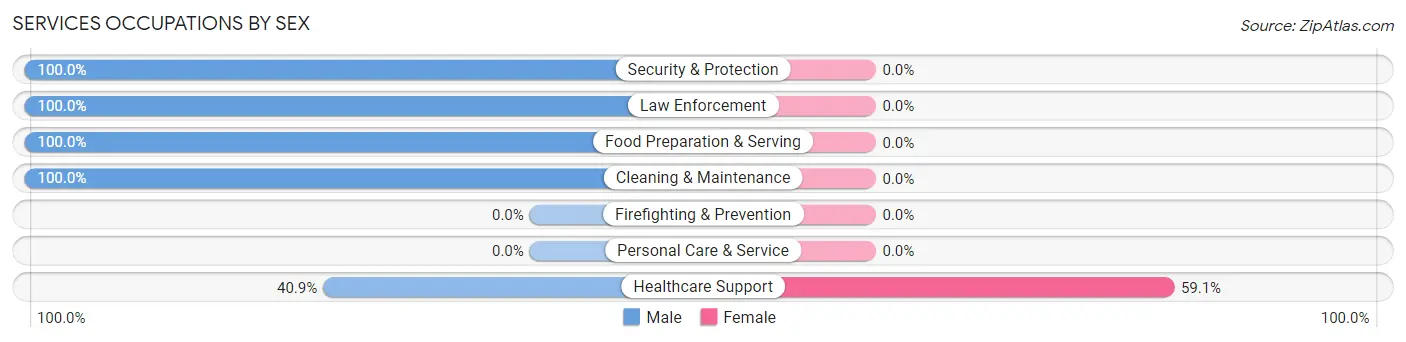
| Occupation | Male | Female |
| Healthcare Support | 18 (40.9%) | 26 (59.1%) |
| Security & Protection | 16 (100.0%) | 0 (0.0%) |
| Firefighting & Prevention | 0 (0.0%) | 0 (0.0%) |
| Law Enforcement | 16 (100.0%) | 0 (0.0%) |
| Food Preparation & Serving | 19 (100.0%) | 0 (0.0%) |
| Cleaning & Maintenance | 16 (100.0%) | 0 (0.0%) |
| Personal Care & Service | 0 (0.0%) | 0 (0.0%) |
| Total (Category) | 69 (72.6%) | 26 (27.4%) |
| Total (Overall) | 638 (54.9%) | 524 (45.1%) |
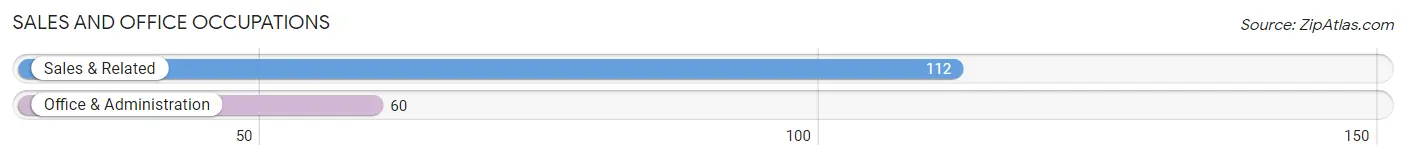
Sales and Office Occupations
The most common Sales and Office occupations in Coventry Lake are Sales & Related (112 | 9.6%), and Office & Administration (60 | 5.2%).
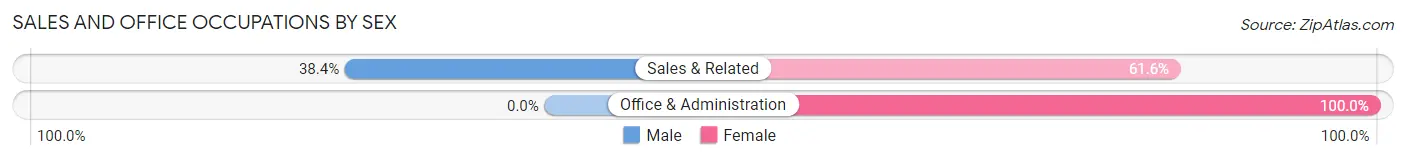
Sales and Office Occupations by Sex
| Occupation | Male | Female |
| Sales & Related | 43 (38.4%) | 69 (61.6%) |
| Office & Administration | 0 (0.0%) | 60 (100.0%) |
| Total (Category) | 43 (25.0%) | 129 (75.0%) |
| Total (Overall) | 638 (54.9%) | 524 (45.1%) |
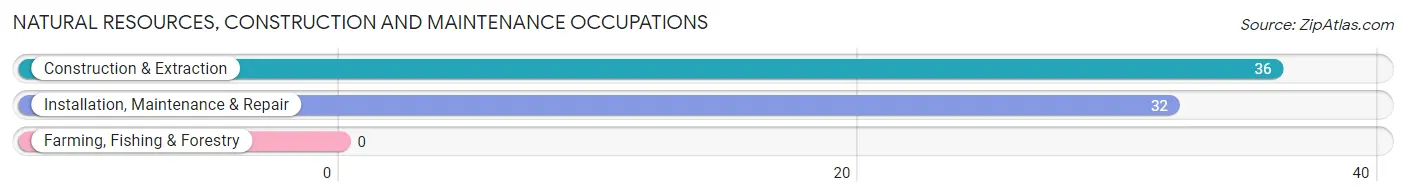
Natural Resources, Construction and Maintenance Occupations
The most common Natural Resources, Construction and Maintenance occupations in Coventry Lake are Construction & Extraction (36 | 3.1%), and Installation, Maintenance & Repair (32 | 2.8%).
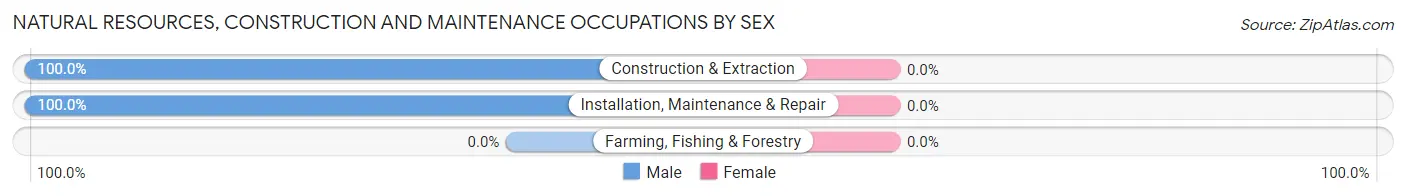
Natural Resources, Construction and Maintenance Occupations by Sex
| Occupation | Male | Female |
| Farming, Fishing & Forestry | 0 (0.0%) | 0 (0.0%) |
| Construction & Extraction | 36 (100.0%) | 0 (0.0%) |
| Installation, Maintenance & Repair | 32 (100.0%) | 0 (0.0%) |
| Total (Category) | 68 (100.0%) | 0 (0.0%) |
| Total (Overall) | 638 (54.9%) | 524 (45.1%) |
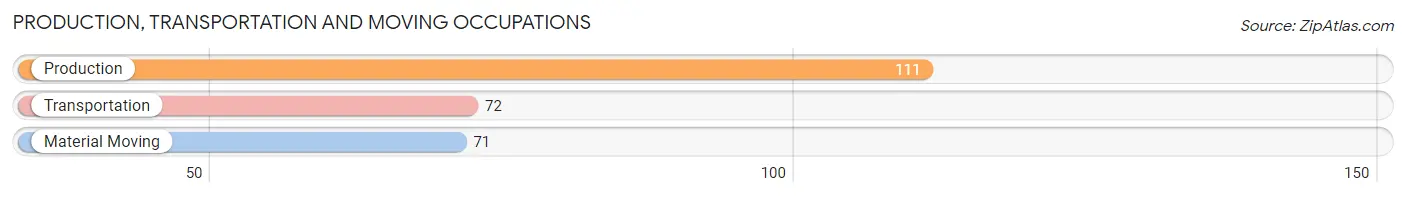
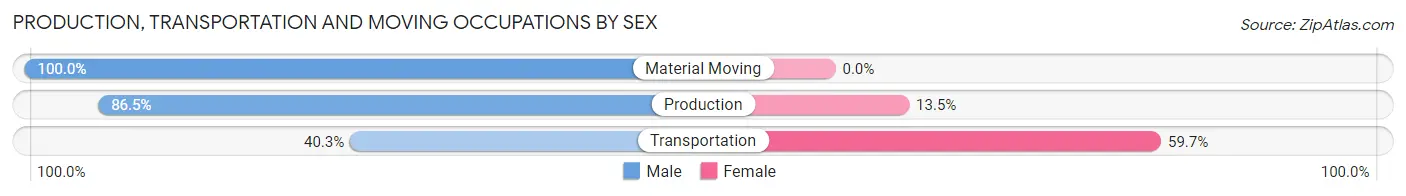
Production, Transportation and Moving Occupations
The most common Production, Transportation and Moving occupations in Coventry Lake are Production (111 | 9.6%), Transportation (72 | 6.2%), and Material Moving (71 | 6.1%).
Production, Transportation and Moving Occupations by Sex
| Occupation | Male | Female |
| Production | 96 (86.5%) | 15 (13.5%) |
| Transportation | 29 (40.3%) | 43 (59.7%) |
| Material Moving | 71 (100.0%) | 0 (0.0%) |
| Total (Category) | 196 (77.2%) | 58 (22.8%) |
| Total (Overall) | 638 (54.9%) | 524 (45.1%) |
Employment Industries by Sex in Coventry Lake
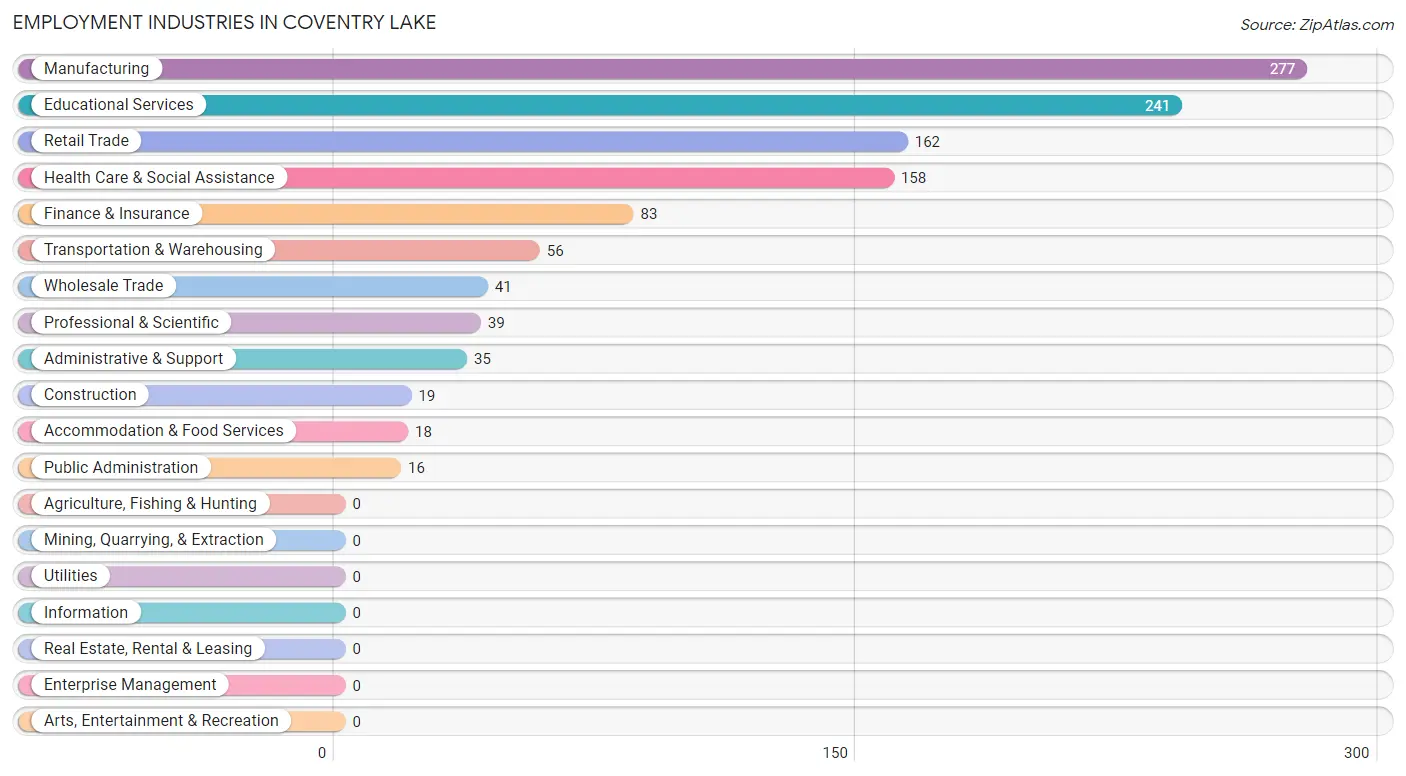
Employment Industries in Coventry Lake
The major employment industries in Coventry Lake include Manufacturing (277 | 23.8%), Educational Services (241 | 20.7%), Retail Trade (162 | 13.9%), Health Care & Social Assistance (158 | 13.6%), and Finance & Insurance (83 | 7.1%).
Employment Industries by Sex in Coventry Lake
The Coventry Lake industries that see more men than women are Construction (100.0%), Accommodation & Food Services (100.0%), and Public Administration (100.0%), whereas the industries that tend to have a higher number of women are Administrative & Support (100.0%), Finance & Insurance (78.3%), and Transportation & Warehousing (76.8%).

| Industry | Male | Female |
| Agriculture, Fishing & Hunting | 0 (0.0%) | 0 (0.0%) |
| Mining, Quarrying, & Extraction | 0 (0.0%) | 0 (0.0%) |
| Construction | 19 (100.0%) | 0 (0.0%) |
| Manufacturing | 258 (93.1%) | 19 (6.9%) |
| Wholesale Trade | 31 (75.6%) | 10 (24.4%) |
| Retail Trade | 72 (44.4%) | 90 (55.6%) |
| Transportation & Warehousing | 13 (23.2%) | 43 (76.8%) |
| Utilities | 0 (0.0%) | 0 (0.0%) |
| Information | 0 (0.0%) | 0 (0.0%) |
| Finance & Insurance | 18 (21.7%) | 65 (78.3%) |
| Real Estate, Rental & Leasing | 0 (0.0%) | 0 (0.0%) |
| Professional & Scientific | 21 (53.8%) | 18 (46.2%) |
| Enterprise Management | 0 (0.0%) | 0 (0.0%) |
| Administrative & Support | 0 (0.0%) | 35 (100.0%) |
| Educational Services | 90 (37.3%) | 151 (62.7%) |
| Health Care & Social Assistance | 65 (41.1%) | 93 (58.9%) |
| Arts, Entertainment & Recreation | 0 (0.0%) | 0 (0.0%) |
| Accommodation & Food Services | 18 (100.0%) | 0 (0.0%) |
| Public Administration | 16 (100.0%) | 0 (0.0%) |
| Total | 638 (54.9%) | 524 (45.1%) |
Education in Coventry Lake
School Enrollment in Coventry Lake
The most common levels of schooling among the 312 students in Coventry Lake are elementary school (82 | 26.3%), middle school (53 | 17.0%), and high school (52 | 16.7%).
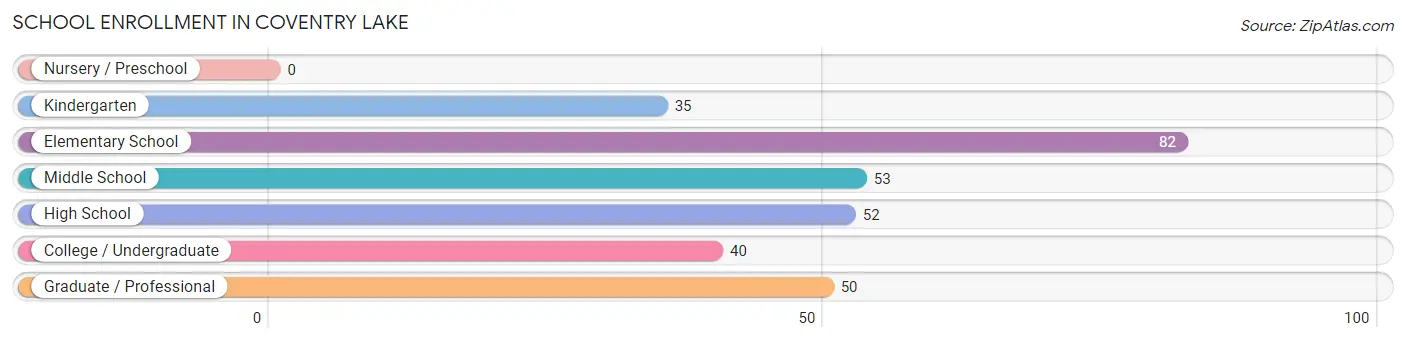
| School Level | # Students | % Students |
| Nursery / Preschool | 0 | 0.0% |
| Kindergarten | 35 | 11.2% |
| Elementary School | 82 | 26.3% |
| Middle School | 53 | 17.0% |
| High School | 52 | 16.7% |
| College / Undergraduate | 40 | 12.8% |
| Graduate / Professional | 50 | 16.0% |
| Total | 312 | 100.0% |
School Enrollment by Age by Funding Source in Coventry Lake
Out of a total of 312 students who are enrolled in schools in Coventry Lake, 16 (5.1%) attend a private institution, while the remaining 296 (94.9%) are enrolled in public schools. The age group of 35 years and over has the highest likelihood of being enrolled in private schools, with 16 (50.0% in the age bracket) enrolled. Conversely, the age group of 5 to 9 year old has the lowest likelihood of being enrolled in a private school, with 117 (100.0% in the age bracket) attending a public institution.
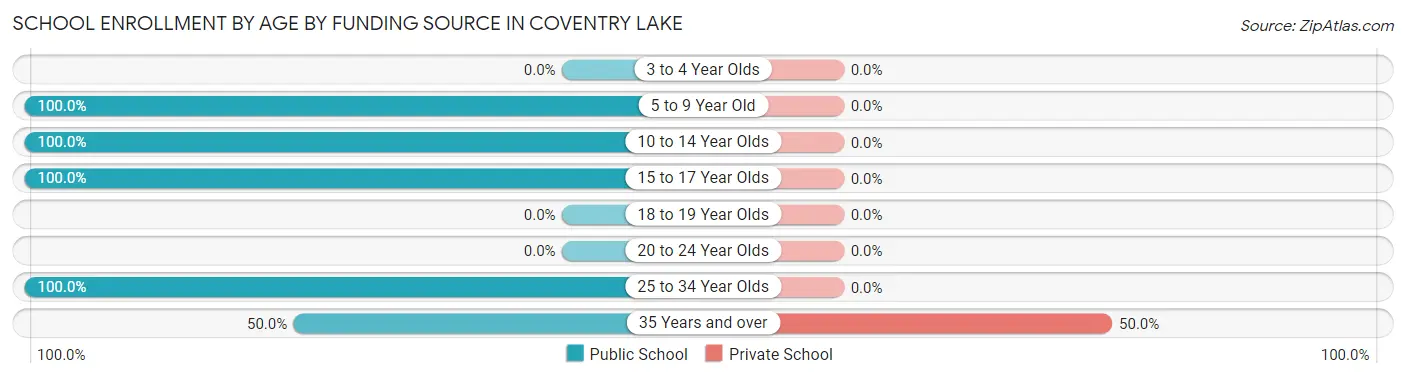
| Age Bracket | Public School | Private School |
| 3 to 4 Year Olds | 0 (0.0%) | 0 (0.0%) |
| 5 to 9 Year Old | 117 (100.0%) | 0 (0.0%) |
| 10 to 14 Year Olds | 67 (100.0%) | 0 (0.0%) |
| 15 to 17 Year Olds | 38 (100.0%) | 0 (0.0%) |
| 18 to 19 Year Olds | 0 (0.0%) | 0 (0.0%) |
| 20 to 24 Year Olds | 0 (0.0%) | 0 (0.0%) |
| 25 to 34 Year Olds | 58 (100.0%) | 0 (0.0%) |
| 35 Years and over | 16 (50.0%) | 16 (50.0%) |
| Total | 296 (94.9%) | 16 (5.1%) |
Educational Attainment by Field of Study in Coventry Lake
Education (193 | 25.1%), business (120 | 15.6%), liberal arts & history (77 | 10.0%), arts & humanities (73 | 9.5%), and science & technology (51 | 6.6%) are the most common fields of study among 768 individuals in Coventry Lake who have obtained a bachelor's degree or higher.
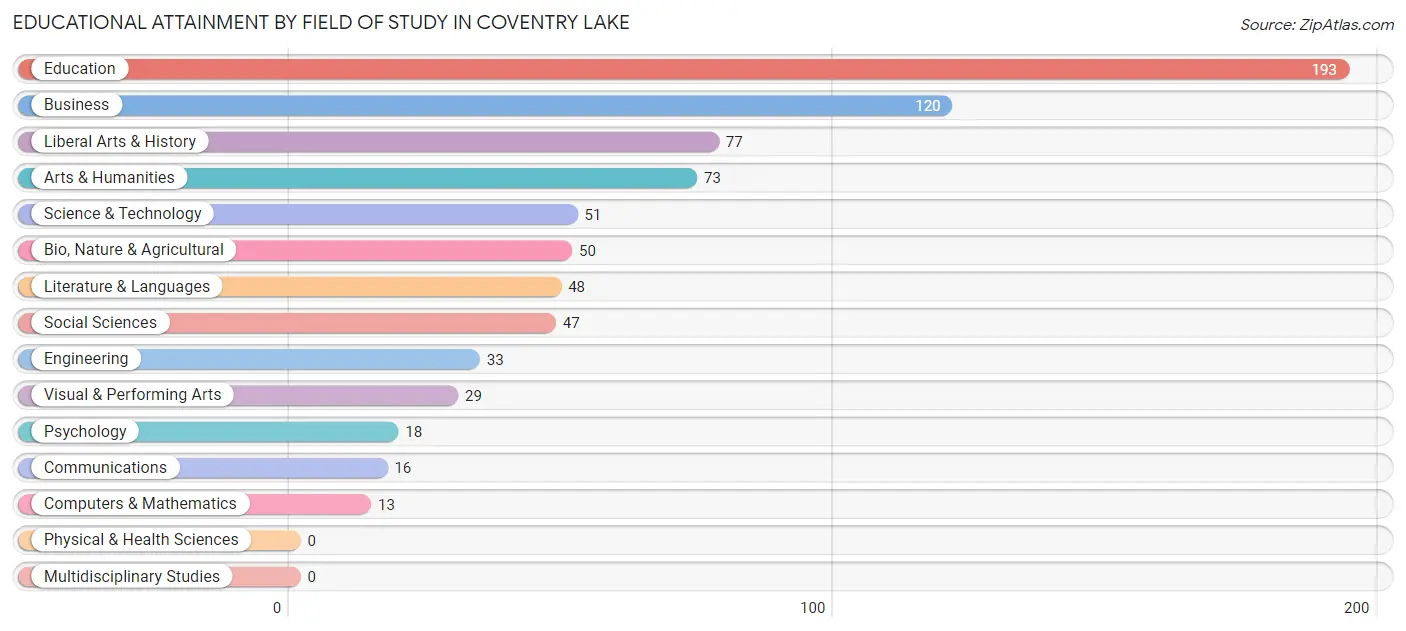
| Field of Study | # Graduates | % Graduates |
| Computers & Mathematics | 13 | 1.7% |
| Bio, Nature & Agricultural | 50 | 6.5% |
| Physical & Health Sciences | 0 | 0.0% |
| Psychology | 18 | 2.3% |
| Social Sciences | 47 | 6.1% |
| Engineering | 33 | 4.3% |
| Multidisciplinary Studies | 0 | 0.0% |
| Science & Technology | 51 | 6.6% |
| Business | 120 | 15.6% |
| Education | 193 | 25.1% |
| Literature & Languages | 48 | 6.2% |
| Liberal Arts & History | 77 | 10.0% |
| Visual & Performing Arts | 29 | 3.8% |
| Communications | 16 | 2.1% |
| Arts & Humanities | 73 | 9.5% |
| Total | 768 | 100.0% |
Transportation & Commute in Coventry Lake
Vehicle Availability by Sex in Coventry Lake
The most prevalent vehicle ownership categories in Coventry Lake are males with 2 vehicles (435, accounting for 68.0%) and females with 2 vehicles (255, making up 86.5%).
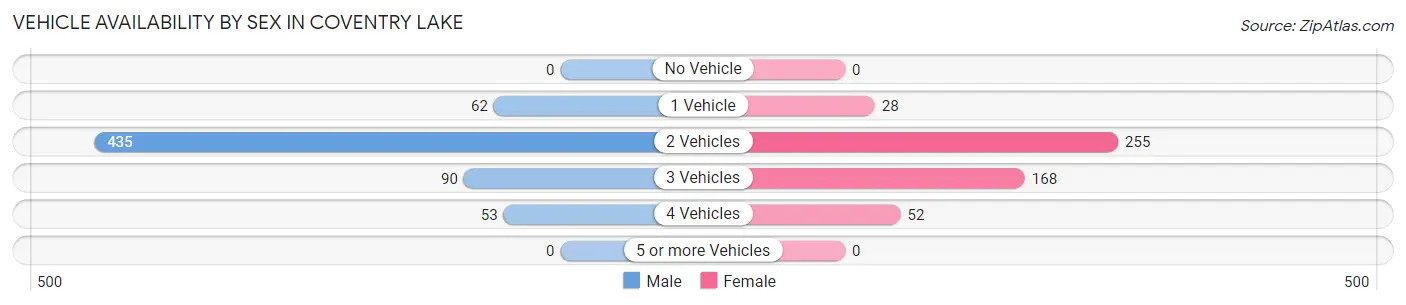
| Vehicles Available | Male | Female |
| No Vehicle | 0 (0.0%) | 0 (0.0%) |
| 1 Vehicle | 62 (9.7%) | 28 (5.6%) |
| 2 Vehicles | 435 (68.0%) | 255 (50.7%) |
| 3 Vehicles | 90 (14.1%) | 168 (33.4%) |
| 4 Vehicles | 53 (8.3%) | 52 (10.3%) |
| 5 or more Vehicles | 0 (0.0%) | 0 (0.0%) |
| Total | 640 (100.0%) | 503 (100.0%) |
Commute Time in Coventry Lake
The most frequently occuring commute durations in Coventry Lake are 30 to 34 minutes (198 commuters, 18.3%), 15 to 19 minutes (172 commuters, 15.9%), and 45 to 59 minutes (160 commuters, 14.8%).
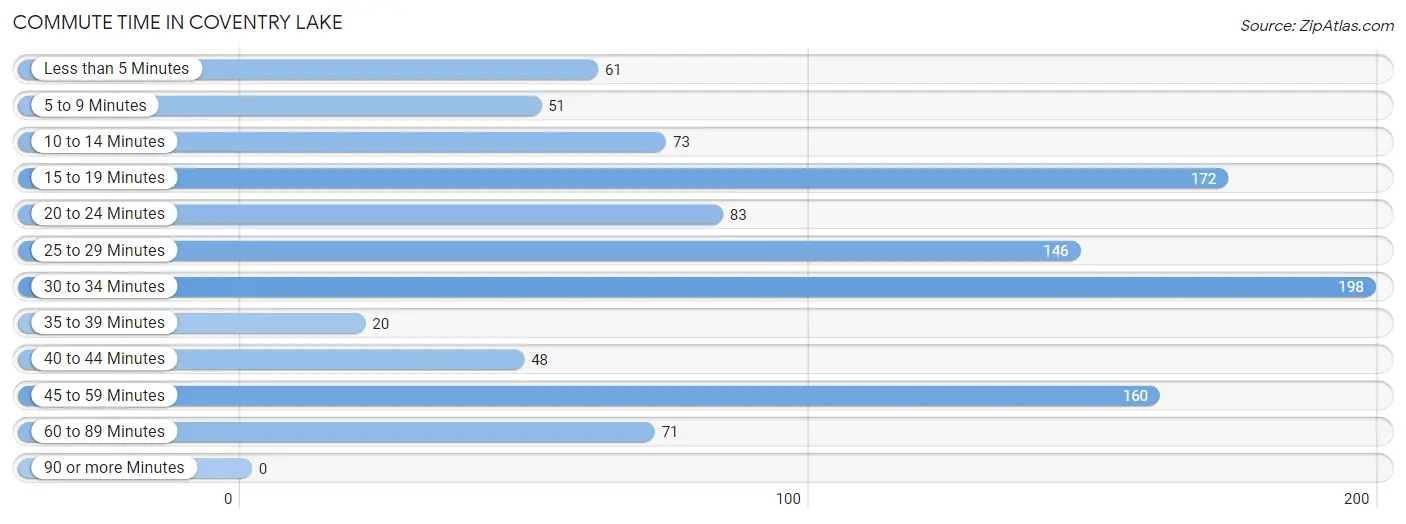
| Commute Time | # Commuters | % Commuters |
| Less than 5 Minutes | 61 | 5.6% |
| 5 to 9 Minutes | 51 | 4.7% |
| 10 to 14 Minutes | 73 | 6.7% |
| 15 to 19 Minutes | 172 | 15.9% |
| 20 to 24 Minutes | 83 | 7.7% |
| 25 to 29 Minutes | 146 | 13.5% |
| 30 to 34 Minutes | 198 | 18.3% |
| 35 to 39 Minutes | 20 | 1.8% |
| 40 to 44 Minutes | 48 | 4.4% |
| 45 to 59 Minutes | 160 | 14.8% |
| 60 to 89 Minutes | 71 | 6.6% |
| 90 or more Minutes | 0 | 0.0% |
Commute Time by Sex in Coventry Lake
The most common commute times in Coventry Lake are 45 to 59 minutes (144 commuters, 23.1%) for males and 25 to 29 minutes (87 commuters, 19.0%) for females.
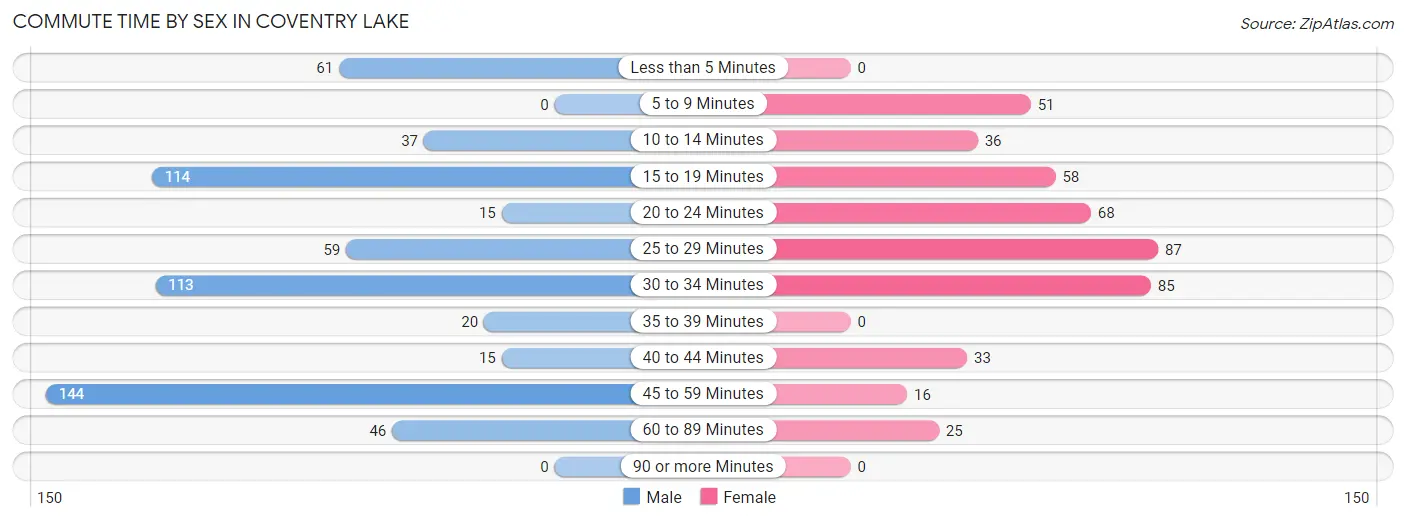
| Commute Time | Male | Female |
| Less than 5 Minutes | 61 (9.8%) | 0 (0.0%) |
| 5 to 9 Minutes | 0 (0.0%) | 51 (11.1%) |
| 10 to 14 Minutes | 37 (5.9%) | 36 (7.8%) |
| 15 to 19 Minutes | 114 (18.3%) | 58 (12.6%) |
| 20 to 24 Minutes | 15 (2.4%) | 68 (14.8%) |
| 25 to 29 Minutes | 59 (9.5%) | 87 (19.0%) |
| 30 to 34 Minutes | 113 (18.1%) | 85 (18.5%) |
| 35 to 39 Minutes | 20 (3.2%) | 0 (0.0%) |
| 40 to 44 Minutes | 15 (2.4%) | 33 (7.2%) |
| 45 to 59 Minutes | 144 (23.1%) | 16 (3.5%) |
| 60 to 89 Minutes | 46 (7.4%) | 25 (5.4%) |
| 90 or more Minutes | 0 (0.0%) | 0 (0.0%) |
Time of Departure to Work by Sex in Coventry Lake
The most frequent times of departure to work in Coventry Lake are 5:00 AM to 5:29 AM (121, 19.4%) for males and 7:00 AM to 7:29 AM (103, 22.4%) for females.
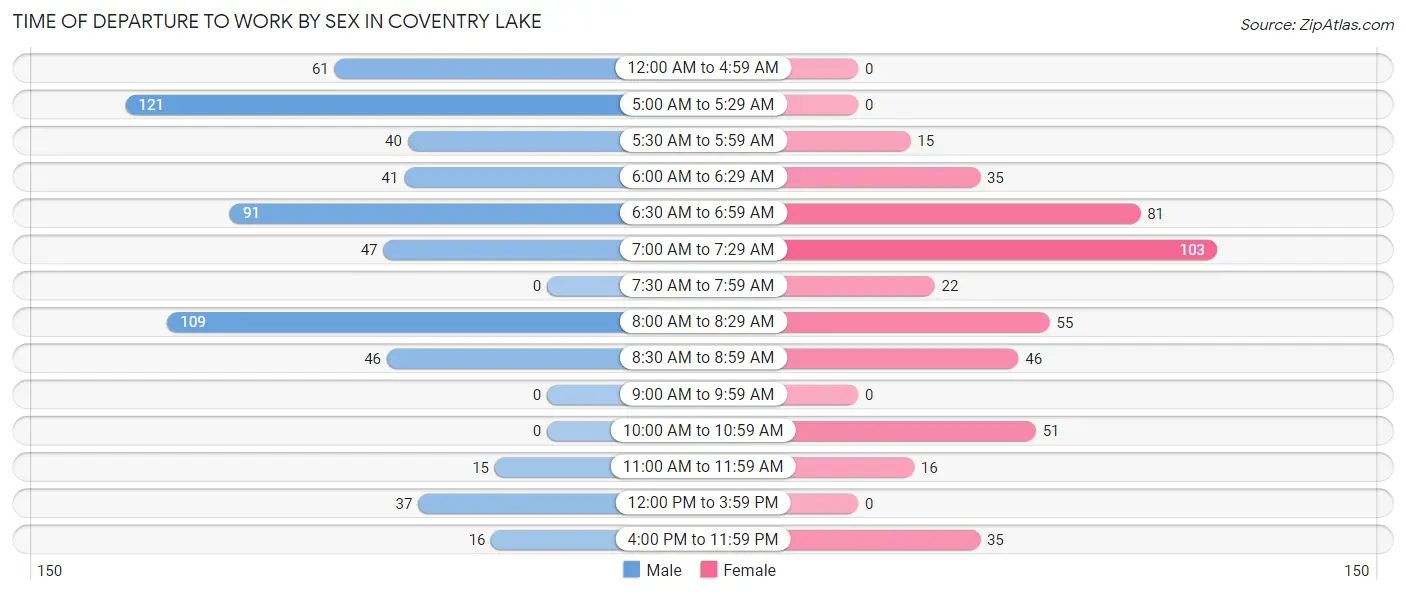
| Time of Departure | Male | Female |
| 12:00 AM to 4:59 AM | 61 (9.8%) | 0 (0.0%) |
| 5:00 AM to 5:29 AM | 121 (19.4%) | 0 (0.0%) |
| 5:30 AM to 5:59 AM | 40 (6.4%) | 15 (3.3%) |
| 6:00 AM to 6:29 AM | 41 (6.6%) | 35 (7.6%) |
| 6:30 AM to 6:59 AM | 91 (14.6%) | 81 (17.6%) |
| 7:00 AM to 7:29 AM | 47 (7.5%) | 103 (22.4%) |
| 7:30 AM to 7:59 AM | 0 (0.0%) | 22 (4.8%) |
| 8:00 AM to 8:29 AM | 109 (17.5%) | 55 (12.0%) |
| 8:30 AM to 8:59 AM | 46 (7.4%) | 46 (10.0%) |
| 9:00 AM to 9:59 AM | 0 (0.0%) | 0 (0.0%) |
| 10:00 AM to 10:59 AM | 0 (0.0%) | 51 (11.1%) |
| 11:00 AM to 11:59 AM | 15 (2.4%) | 16 (3.5%) |
| 12:00 PM to 3:59 PM | 37 (5.9%) | 0 (0.0%) |
| 4:00 PM to 11:59 PM | 16 (2.6%) | 35 (7.6%) |
| Total | 624 (100.0%) | 459 (100.0%) |
Housing Occupancy in Coventry Lake
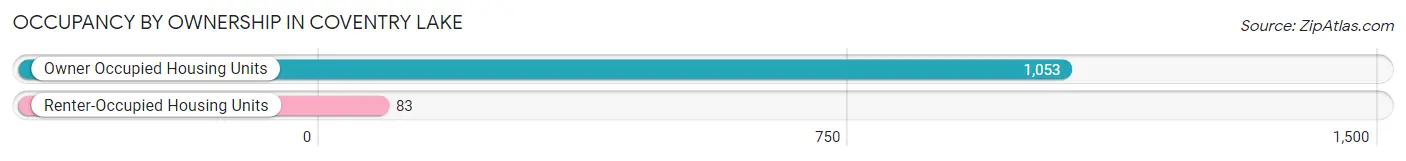
Occupancy by Ownership in Coventry Lake
Of the total 1,136 dwellings in Coventry Lake, owner-occupied units account for 1,053 (92.7%), while renter-occupied units make up 83 (7.3%).
| Occupancy | # Housing Units | % Housing Units |
| Owner Occupied Housing Units | 1,053 | 92.7% |
| Renter-Occupied Housing Units | 83 | 7.3% |
| Total Occupied Housing Units | 1,136 | 100.0% |
Occupancy by Household Size in Coventry Lake
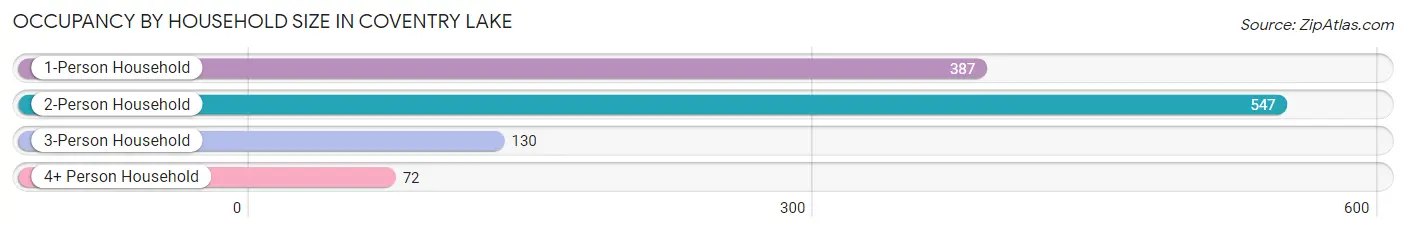
| Household Size | # Housing Units | % Housing Units |
| 1-Person Household | 387 | 34.1% |
| 2-Person Household | 547 | 48.1% |
| 3-Person Household | 130 | 11.4% |
| 4+ Person Household | 72 | 6.3% |
| Total Housing Units | 1,136 | 100.0% |
Occupancy by Ownership by Household Size in Coventry Lake
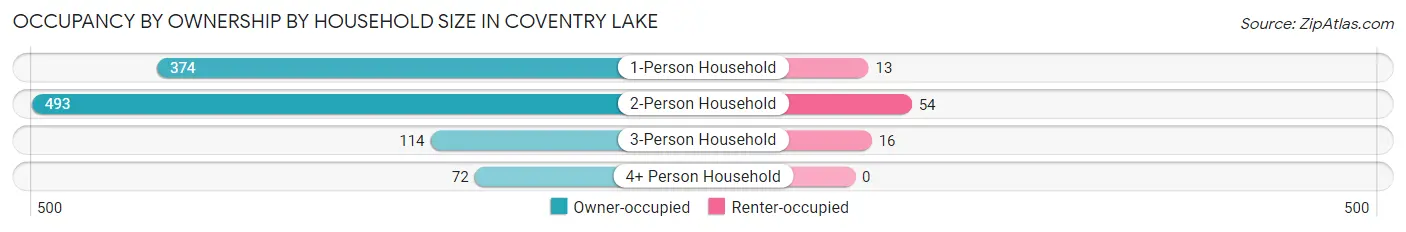
| Household Size | Owner-occupied | Renter-occupied |
| 1-Person Household | 374 (96.6%) | 13 (3.4%) |
| 2-Person Household | 493 (90.1%) | 54 (9.9%) |
| 3-Person Household | 114 (87.7%) | 16 (12.3%) |
| 4+ Person Household | 72 (100.0%) | 0 (0.0%) |
| Total Housing Units | 1,053 (92.7%) | 83 (7.3%) |
Occupancy by Educational Attainment in Coventry Lake
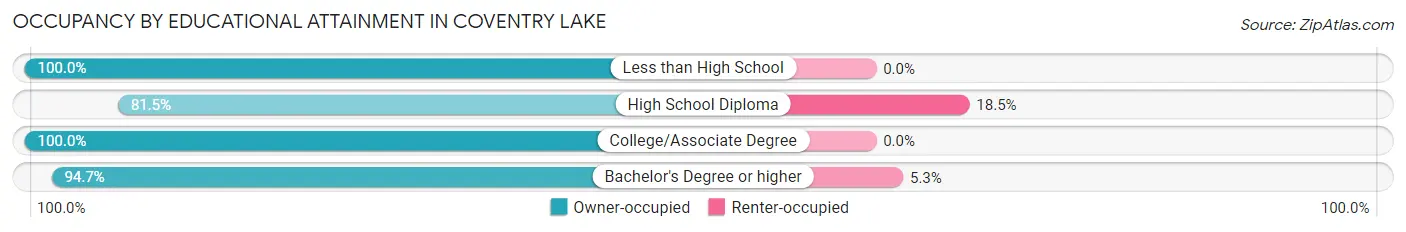
| Household Size | Owner-occupied | Renter-occupied |
| Less than High School | 61 (100.0%) | 0 (0.0%) |
| High School Diploma | 238 (81.5%) | 54 (18.5%) |
| College/Associate Degree | 239 (100.0%) | 0 (0.0%) |
| Bachelor's Degree or higher | 515 (94.7%) | 29 (5.3%) |
Occupancy by Age of Householder in Coventry Lake
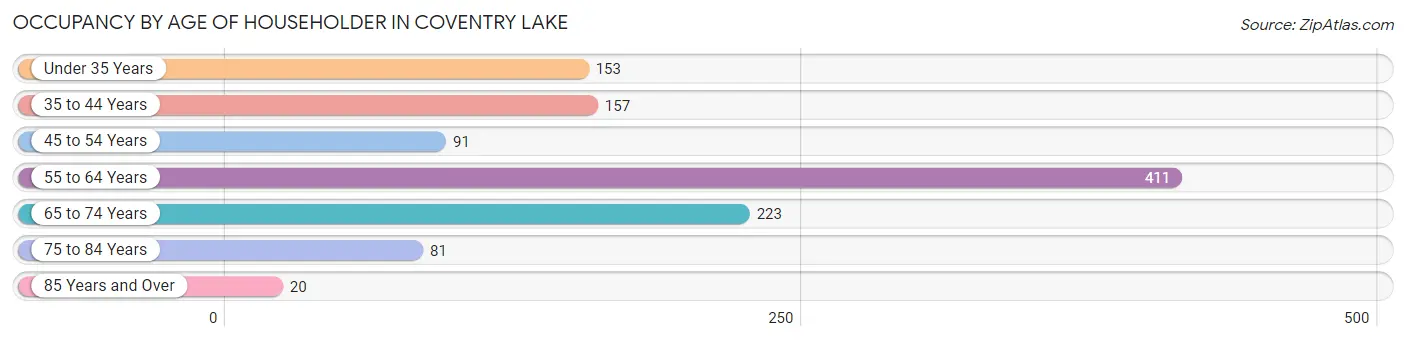
| Age Bracket | # Households | % Households |
| Under 35 Years | 153 | 13.5% |
| 35 to 44 Years | 157 | 13.8% |
| 45 to 54 Years | 91 | 8.0% |
| 55 to 64 Years | 411 | 36.2% |
| 65 to 74 Years | 223 | 19.6% |
| 75 to 84 Years | 81 | 7.1% |
| 85 Years and Over | 20 | 1.8% |
| Total | 1,136 | 100.0% |
Housing Finances in Coventry Lake
Median Income by Occupancy in Coventry Lake
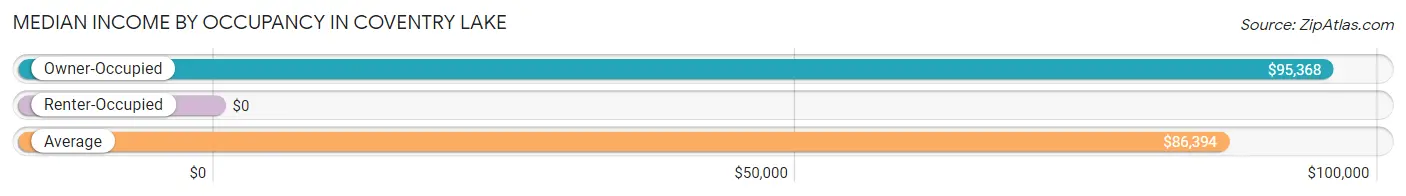
| Occupancy Type | # Households | Median Income |
| Owner-Occupied | 1,053 (92.7%) | $95,368 |
| Renter-Occupied | 83 (7.3%) | $0 |
| Average | 1,136 (100.0%) | $86,394 |
Occupancy by Householder Income Bracket in Coventry Lake
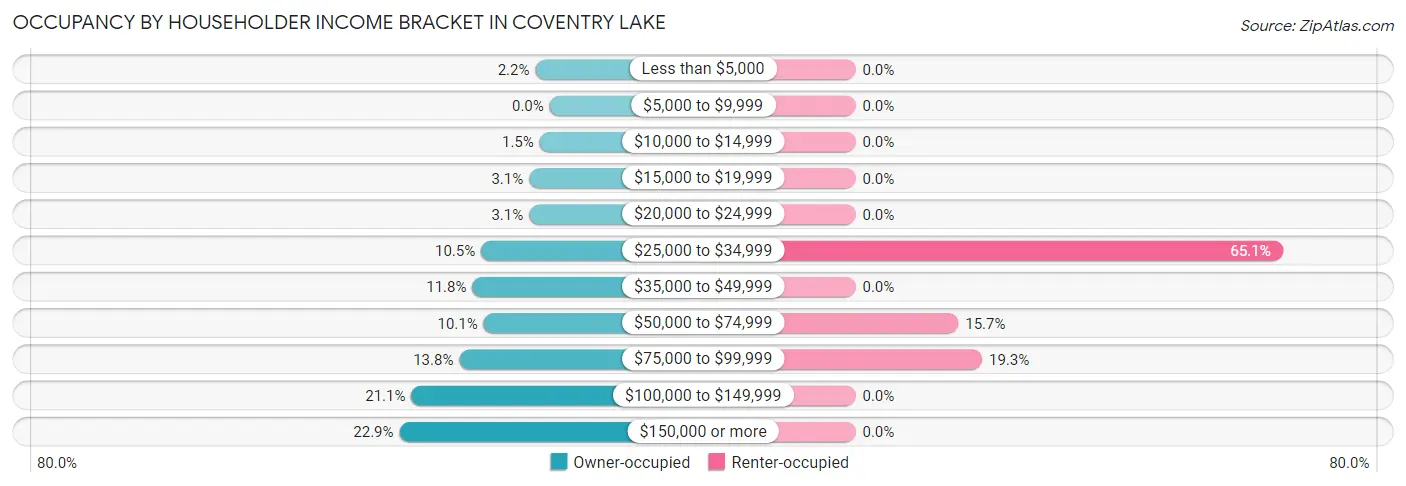
| Income Bracket | Owner-occupied | Renter-occupied |
| Less than $5,000 | 23 (2.2%) | 0 (0.0%) |
| $5,000 to $9,999 | 0 (0.0%) | 0 (0.0%) |
| $10,000 to $14,999 | 16 (1.5%) | 0 (0.0%) |
| $15,000 to $19,999 | 33 (3.1%) | 0 (0.0%) |
| $20,000 to $24,999 | 33 (3.1%) | 0 (0.0%) |
| $25,000 to $34,999 | 110 (10.4%) | 54 (65.1%) |
| $35,000 to $49,999 | 124 (11.8%) | 0 (0.0%) |
| $50,000 to $74,999 | 106 (10.1%) | 13 (15.7%) |
| $75,000 to $99,999 | 145 (13.8%) | 16 (19.3%) |
| $100,000 to $149,999 | 222 (21.1%) | 0 (0.0%) |
| $150,000 or more | 241 (22.9%) | 0 (0.0%) |
| Total | 1,053 (100.0%) | 83 (100.0%) |
Monthly Housing Cost Tiers in Coventry Lake
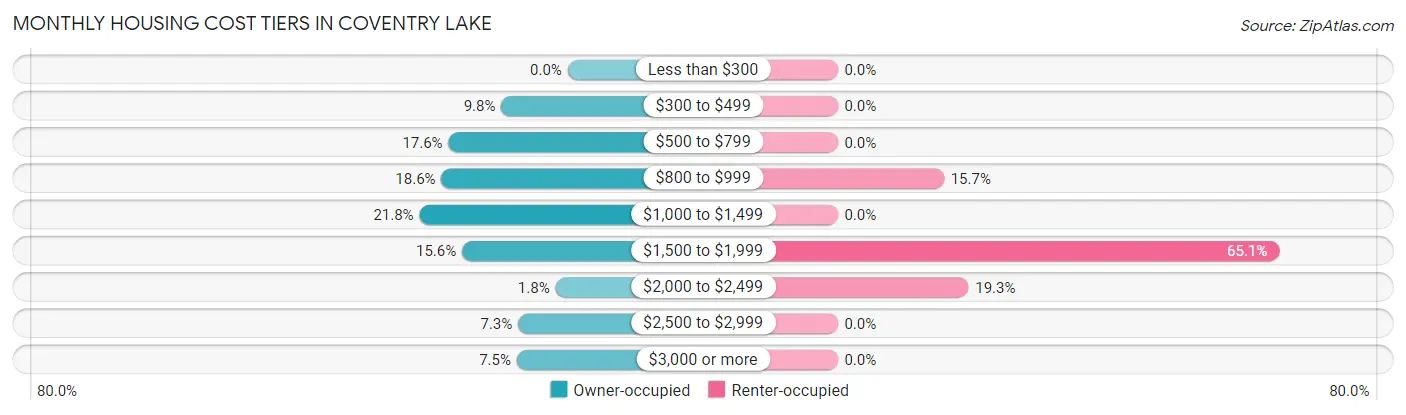
| Monthly Cost | Owner-occupied | Renter-occupied |
| Less than $300 | 0 (0.0%) | 0 (0.0%) |
| $300 to $499 | 103 (9.8%) | 0 (0.0%) |
| $500 to $799 | 185 (17.6%) | 0 (0.0%) |
| $800 to $999 | 196 (18.6%) | 13 (15.7%) |
| $1,000 to $1,499 | 230 (21.8%) | 0 (0.0%) |
| $1,500 to $1,999 | 164 (15.6%) | 54 (65.1%) |
| $2,000 to $2,499 | 19 (1.8%) | 16 (19.3%) |
| $2,500 to $2,999 | 77 (7.3%) | 0 (0.0%) |
| $3,000 or more | 79 (7.5%) | 0 (0.0%) |
| Total | 1,053 (100.0%) | 83 (100.0%) |
Physical Housing Characteristics in Coventry Lake
Housing Structures in Coventry Lake
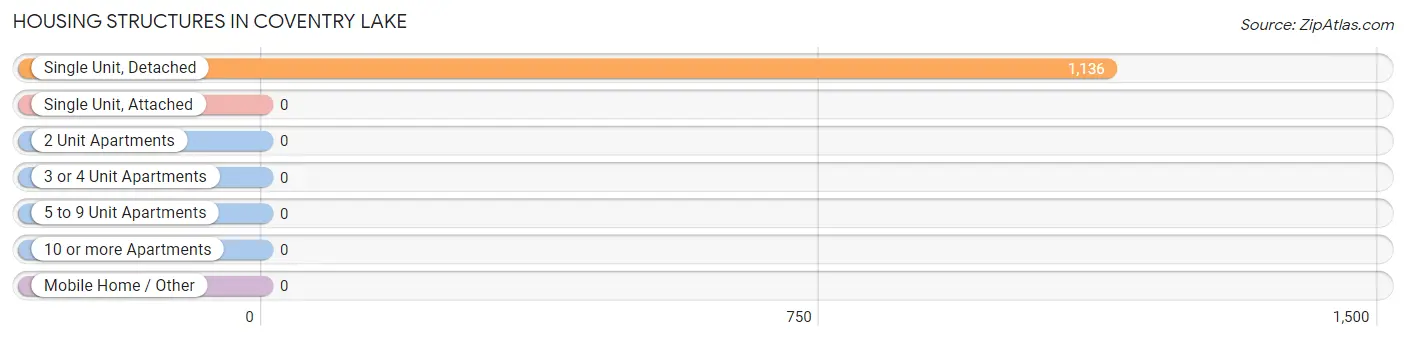
| Structure Type | # Housing Units | % Housing Units |
| Single Unit, Detached | 1,136 | 100.0% |
| Single Unit, Attached | 0 | 0.0% |
| 2 Unit Apartments | 0 | 0.0% |
| 3 or 4 Unit Apartments | 0 | 0.0% |
| 5 to 9 Unit Apartments | 0 | 0.0% |
| 10 or more Apartments | 0 | 0.0% |
| Mobile Home / Other | 0 | 0.0% |
| Total | 1,136 | 100.0% |
Housing Structures by Occupancy in Coventry Lake
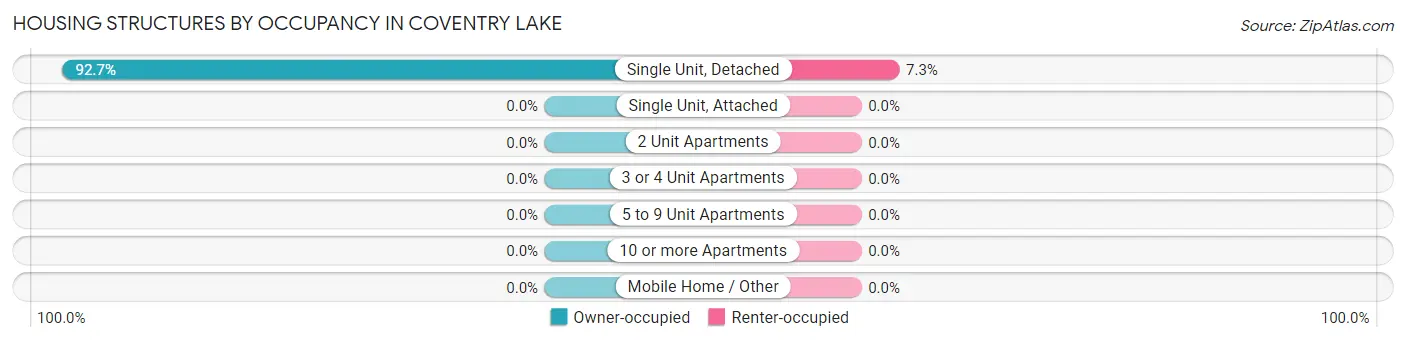
| Structure Type | Owner-occupied | Renter-occupied |
| Single Unit, Detached | 1,053 (92.7%) | 83 (7.3%) |
| Single Unit, Attached | 0 (0.0%) | 0 (0.0%) |
| 2 Unit Apartments | 0 (0.0%) | 0 (0.0%) |
| 3 or 4 Unit Apartments | 0 (0.0%) | 0 (0.0%) |
| 5 to 9 Unit Apartments | 0 (0.0%) | 0 (0.0%) |
| 10 or more Apartments | 0 (0.0%) | 0 (0.0%) |
| Mobile Home / Other | 0 (0.0%) | 0 (0.0%) |
| Total | 1,053 (92.7%) | 83 (7.3%) |
Housing Structures by Number of Rooms in Coventry Lake
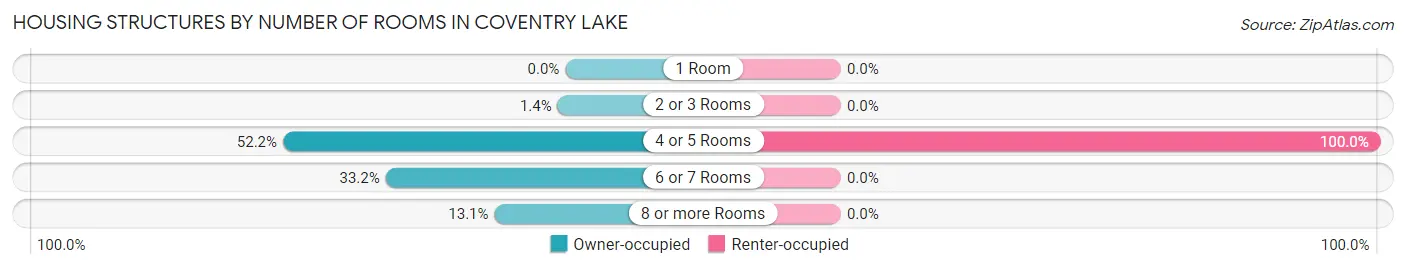
| Number of Rooms | Owner-occupied | Renter-occupied |
| 1 Room | 0 (0.0%) | 0 (0.0%) |
| 2 or 3 Rooms | 15 (1.4%) | 0 (0.0%) |
| 4 or 5 Rooms | 550 (52.2%) | 83 (100.0%) |
| 6 or 7 Rooms | 350 (33.2%) | 0 (0.0%) |
| 8 or more Rooms | 138 (13.1%) | 0 (0.0%) |
| Total | 1,053 (100.0%) | 83 (100.0%) |
Housing Structure by Heating Type in Coventry Lake
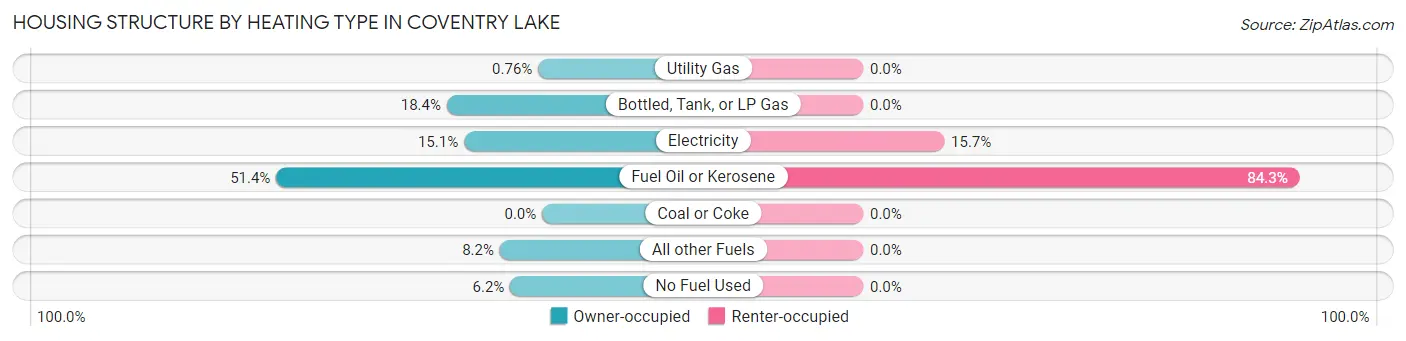
| Heating Type | Owner-occupied | Renter-occupied |
| Utility Gas | 8 (0.8%) | 0 (0.0%) |
| Bottled, Tank, or LP Gas | 194 (18.4%) | 0 (0.0%) |
| Electricity | 159 (15.1%) | 13 (15.7%) |
| Fuel Oil or Kerosene | 541 (51.4%) | 70 (84.3%) |
| Coal or Coke | 0 (0.0%) | 0 (0.0%) |
| All other Fuels | 86 (8.2%) | 0 (0.0%) |
| No Fuel Used | 65 (6.2%) | 0 (0.0%) |
| Total | 1,053 (100.0%) | 83 (100.0%) |
Household Vehicle Usage in Coventry Lake
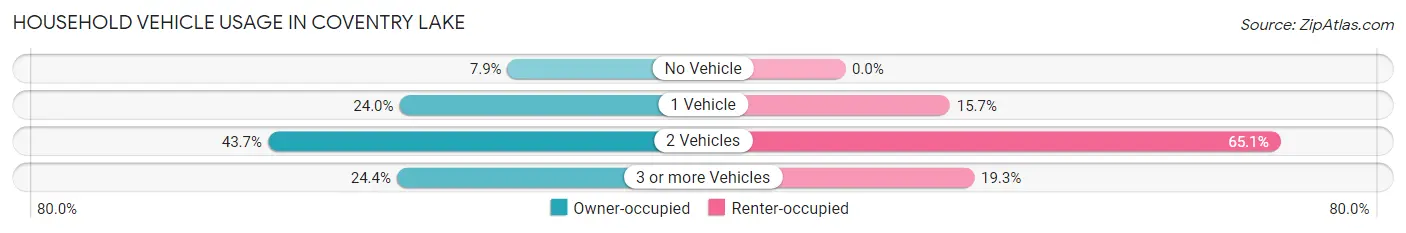
| Vehicles per Household | Owner-occupied | Renter-occupied |
| No Vehicle | 83 (7.9%) | 0 (0.0%) |
| 1 Vehicle | 253 (24.0%) | 13 (15.7%) |
| 2 Vehicles | 460 (43.7%) | 54 (65.1%) |
| 3 or more Vehicles | 257 (24.4%) | 16 (19.3%) |
| Total | 1,053 (100.0%) | 83 (100.0%) |
Real Estate & Mortgages in Coventry Lake
Real Estate and Mortgage Overview in Coventry Lake
| Characteristic | Without Mortgage | With Mortgage |
| Housing Units | 465 | 588 |
| Median Property Value | $271,800 | $219,000 |
| Median Household Income | $51,691 | $178 |
| Monthly Housing Costs | $738 | $79 |
| Real Estate Taxes | $4,679 | $0 |
Property Value by Mortgage Status in Coventry Lake
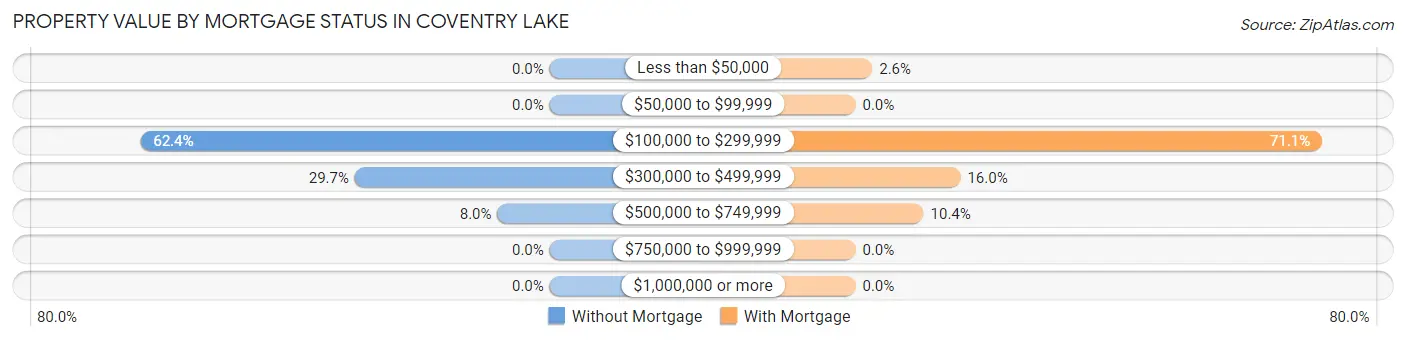
| Property Value | Without Mortgage | With Mortgage |
| Less than $50,000 | 0 (0.0%) | 15 (2.5%) |
| $50,000 to $99,999 | 0 (0.0%) | 0 (0.0%) |
| $100,000 to $299,999 | 290 (62.4%) | 418 (71.1%) |
| $300,000 to $499,999 | 138 (29.7%) | 94 (16.0%) |
| $500,000 to $749,999 | 37 (8.0%) | 61 (10.4%) |
| $750,000 to $999,999 | 0 (0.0%) | 0 (0.0%) |
| $1,000,000 or more | 0 (0.0%) | 0 (0.0%) |
| Total | 465 (100.0%) | 588 (100.0%) |
Household Income by Mortgage Status in Coventry Lake
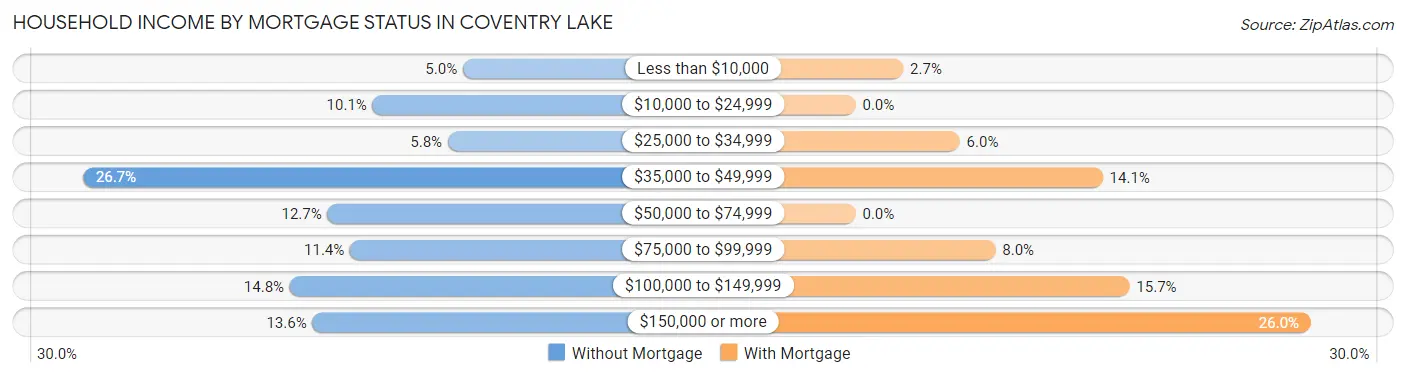
| Household Income | Without Mortgage | With Mortgage |
| Less than $10,000 | 23 (5.0%) | 16 (2.7%) |
| $10,000 to $24,999 | 47 (10.1%) | 0 (0.0%) |
| $25,000 to $34,999 | 27 (5.8%) | 35 (5.9%) |
| $35,000 to $49,999 | 124 (26.7%) | 83 (14.1%) |
| $50,000 to $74,999 | 59 (12.7%) | 0 (0.0%) |
| $75,000 to $99,999 | 53 (11.4%) | 47 (8.0%) |
| $100,000 to $149,999 | 69 (14.8%) | 92 (15.7%) |
| $150,000 or more | 63 (13.6%) | 153 (26.0%) |
| Total | 465 (100.0%) | 588 (100.0%) |
Property Value to Household Income Ratio in Coventry Lake
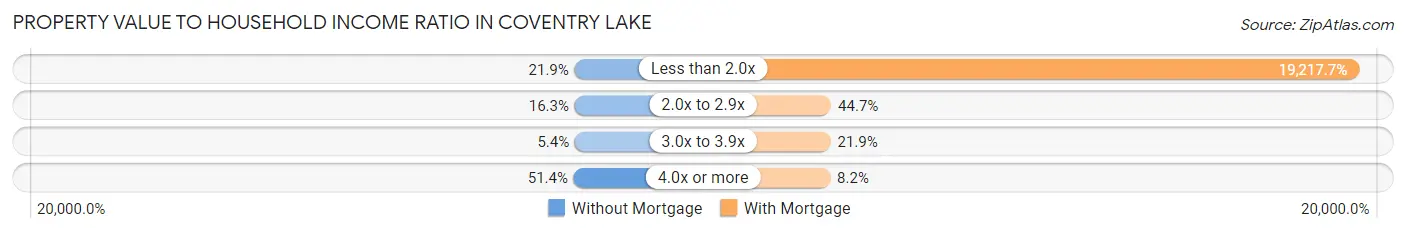
| Value-to-Income Ratio | Without Mortgage | With Mortgage |
| Less than 2.0x | 102 (21.9%) | 113,000 (19,217.7%) |
| 2.0x to 2.9x | 76 (16.3%) | 263 (44.7%) |
| 3.0x to 3.9x | 25 (5.4%) | 129 (21.9%) |
| 4.0x or more | 239 (51.4%) | 48 (8.2%) |
| Total | 465 (100.0%) | 588 (100.0%) |
Real Estate Taxes by Mortgage Status in Coventry Lake
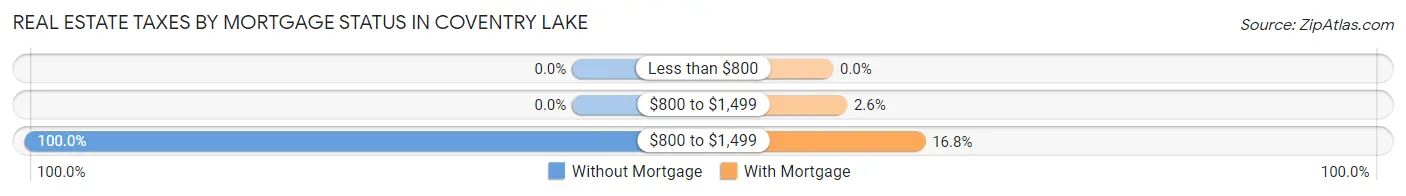
| Property Taxes | Without Mortgage | With Mortgage |
| Less than $800 | 0 (0.0%) | 0 (0.0%) |
| $800 to $1,499 | 0 (0.0%) | 15 (2.5%) |
| $800 to $1,499 | 465 (100.0%) | 99 (16.8%) |
| Total | 465 (100.0%) | 588 (100.0%) |
Health & Disability in Coventry Lake
Health Insurance Coverage by Age in Coventry Lake
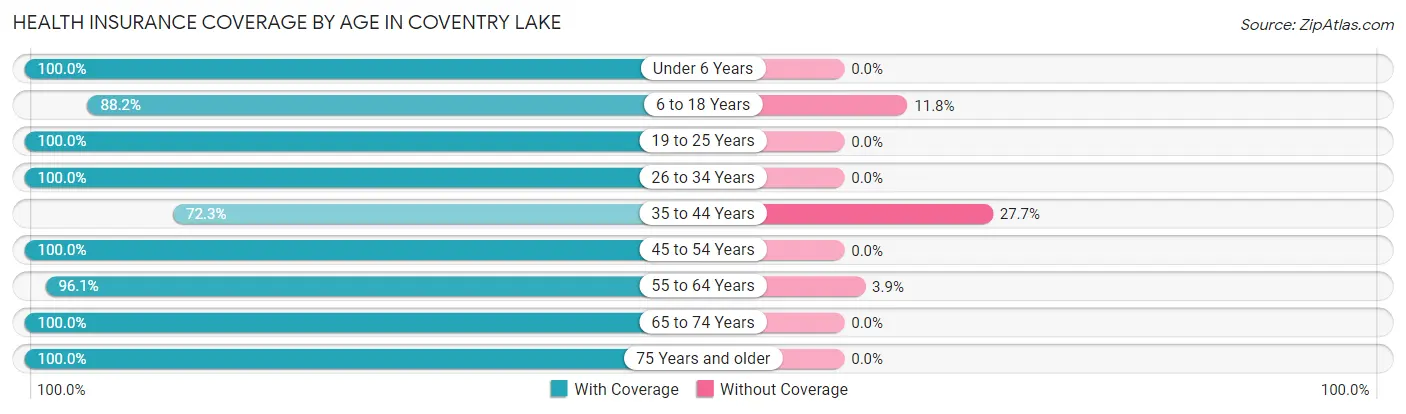
| Age Bracket | With Coverage | Without Coverage |
| Under 6 Years | 102 (100.0%) | 0 (0.0%) |
| 6 to 18 Years | 165 (88.2%) | 22 (11.8%) |
| 19 to 25 Years | 192 (100.0%) | 0 (0.0%) |
| 26 to 34 Years | 178 (100.0%) | 0 (0.0%) |
| 35 to 44 Years | 141 (72.3%) | 54 (27.7%) |
| 45 to 54 Years | 185 (100.0%) | 0 (0.0%) |
| 55 to 64 Years | 691 (96.1%) | 28 (3.9%) |
| 65 to 74 Years | 312 (100.0%) | 0 (0.0%) |
| 75 Years and older | 133 (100.0%) | 0 (0.0%) |
| Total | 2,099 (95.3%) | 104 (4.7%) |
Health Insurance Coverage by Citizenship Status in Coventry Lake
| Citizenship Status | With Coverage | Without Coverage |
| Native Born | 102 (100.0%) | 0 (0.0%) |
| Foreign Born, Citizen | 165 (88.2%) | 22 (11.8%) |
| Foreign Born, not a Citizen | 192 (100.0%) | 0 (0.0%) |
Health Insurance Coverage by Household Income in Coventry Lake

| Household Income | With Coverage | Without Coverage |
| Under $25,000 | 125 (85.0%) | 22 (15.0%) |
| $25,000 to $49,999 | 380 (87.6%) | 54 (12.4%) |
| $50,000 to $74,999 | 336 (95.5%) | 16 (4.5%) |
| $75,000 to $99,999 | 299 (100.0%) | 0 (0.0%) |
| $100,000 and over | 959 (98.8%) | 12 (1.2%) |
Public vs Private Health Insurance Coverage by Age in Coventry Lake
| Age Bracket | Public Insurance | Private Insurance |
| Under 6 | 85 (83.3%) | 17 (16.7%) |
| 6 to 18 Years | 46 (24.6%) | 119 (63.6%) |
| 19 to 25 Years | 83 (43.2%) | 109 (56.8%) |
| 25 to 34 Years | 0 (0.0%) | 178 (100.0%) |
| 35 to 44 Years | 0 (0.0%) | 141 (72.3%) |
| 45 to 54 Years | 19 (10.3%) | 185 (100.0%) |
| 55 to 64 Years | 118 (16.4%) | 573 (79.7%) |
| 65 to 74 Years | 312 (100.0%) | 141 (45.2%) |
| 75 Years and over | 133 (100.0%) | 126 (94.7%) |
| Total | 796 (36.1%) | 1,589 (72.1%) |
Disability Status by Sex by Age in Coventry Lake
| Age Bracket | Male | Female |
| Under 5 Years | 0 (0.0%) | 0 (0.0%) |
| 5 to 17 Years | 14 (8.5%) | 0 (0.0%) |
| 18 to 34 Years | 23 (10.0%) | 0 (0.0%) |
| 35 to 64 Years | 21 (4.8%) | 178 (26.9%) |
| 65 to 74 Years | 69 (38.8%) | 0 (0.0%) |
| 75 Years and over | 20 (43.5%) | 11 (12.6%) |
Disability Class by Sex by Age in Coventry Lake
Disability Class: Hearing Difficulty
| Age Bracket | Male | Female |
| Under 5 Years | 0 (0.0%) | 0 (0.0%) |
| 5 to 17 Years | 0 (0.0%) | 0 (0.0%) |
| 18 to 34 Years | 0 (0.0%) | 0 (0.0%) |
| 35 to 64 Years | 0 (0.0%) | 0 (0.0%) |
| 65 to 74 Years | 53 (29.8%) | 0 (0.0%) |
| 75 Years and over | 0 (0.0%) | 0 (0.0%) |
Disability Class: Vision Difficulty
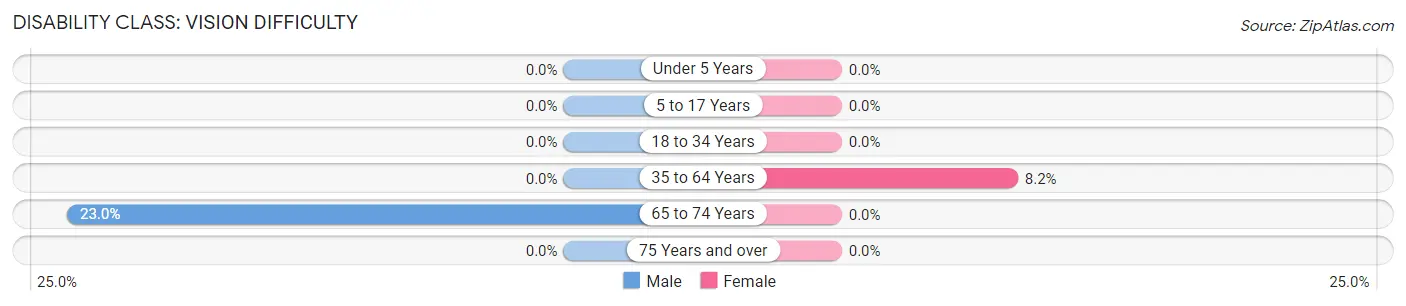
| Age Bracket | Male | Female |
| Under 5 Years | 0 (0.0%) | 0 (0.0%) |
| 5 to 17 Years | 0 (0.0%) | 0 (0.0%) |
| 18 to 34 Years | 0 (0.0%) | 0 (0.0%) |
| 35 to 64 Years | 0 (0.0%) | 54 (8.2%) |
| 65 to 74 Years | 41 (23.0%) | 0 (0.0%) |
| 75 Years and over | 0 (0.0%) | 0 (0.0%) |
Disability Class: Cognitive Difficulty
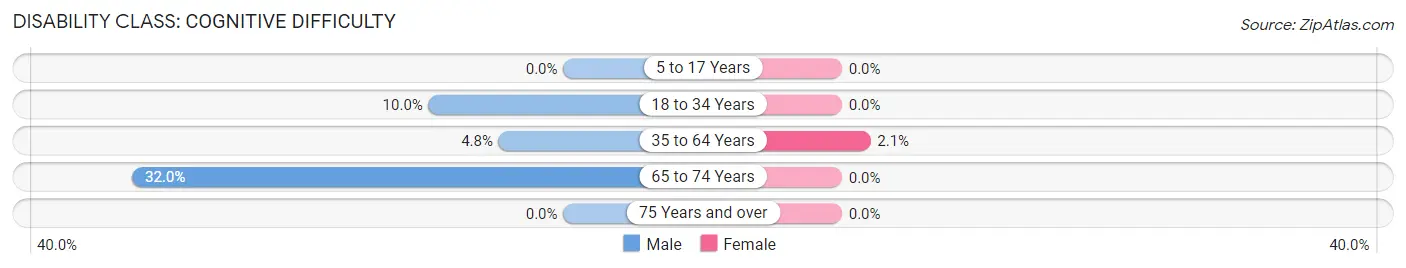
| Age Bracket | Male | Female |
| 5 to 17 Years | 0 (0.0%) | 0 (0.0%) |
| 18 to 34 Years | 23 (10.0%) | 0 (0.0%) |
| 35 to 64 Years | 21 (4.8%) | 14 (2.1%) |
| 65 to 74 Years | 57 (32.0%) | 0 (0.0%) |
| 75 Years and over | 0 (0.0%) | 0 (0.0%) |
Disability Class: Ambulatory Difficulty
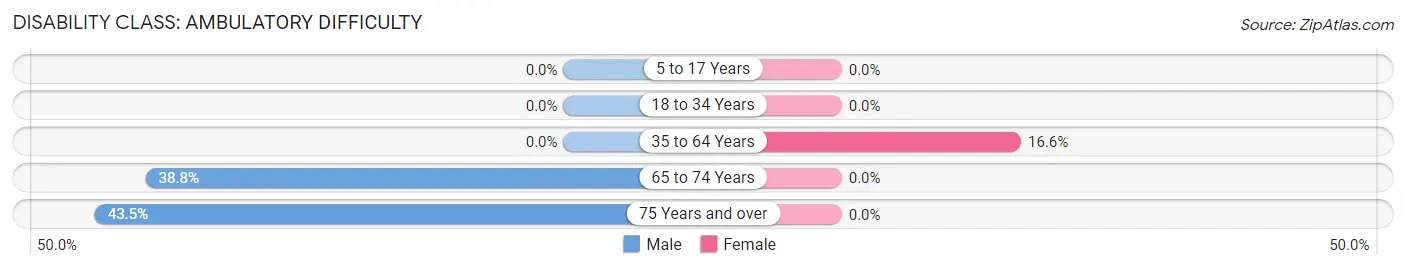
| Age Bracket | Male | Female |
| 5 to 17 Years | 0 (0.0%) | 0 (0.0%) |
| 18 to 34 Years | 0 (0.0%) | 0 (0.0%) |
| 35 to 64 Years | 0 (0.0%) | 110 (16.6%) |
| 65 to 74 Years | 69 (38.8%) | 0 (0.0%) |
| 75 Years and over | 20 (43.5%) | 0 (0.0%) |
Disability Class: Self-Care Difficulty
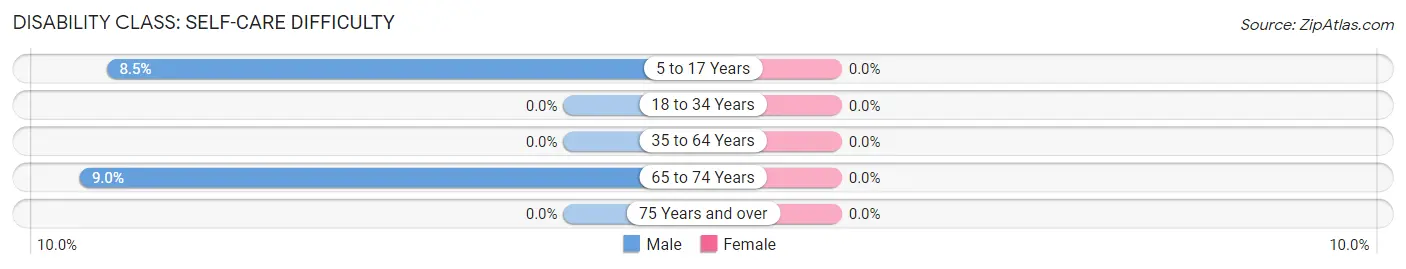
| Age Bracket | Male | Female |
| 5 to 17 Years | 14 (8.5%) | 0 (0.0%) |
| 18 to 34 Years | 0 (0.0%) | 0 (0.0%) |
| 35 to 64 Years | 0 (0.0%) | 0 (0.0%) |
| 65 to 74 Years | 16 (9.0%) | 0 (0.0%) |
| 75 Years and over | 0 (0.0%) | 0 (0.0%) |
Technology Access in Coventry Lake
Computing Device Access in Coventry Lake
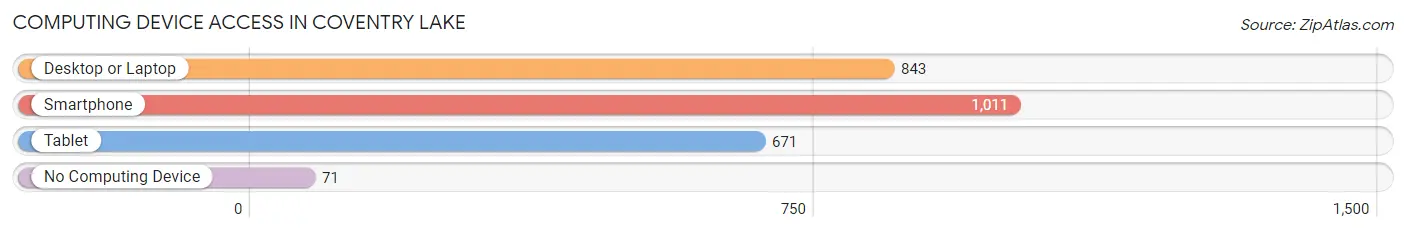
| Device Type | # Households | % Households |
| Desktop or Laptop | 843 | 74.2% |
| Smartphone | 1,011 | 89.0% |
| Tablet | 671 | 59.1% |
| No Computing Device | 71 | 6.2% |
| Total | 1,136 | 100.0% |
Internet Access in Coventry Lake
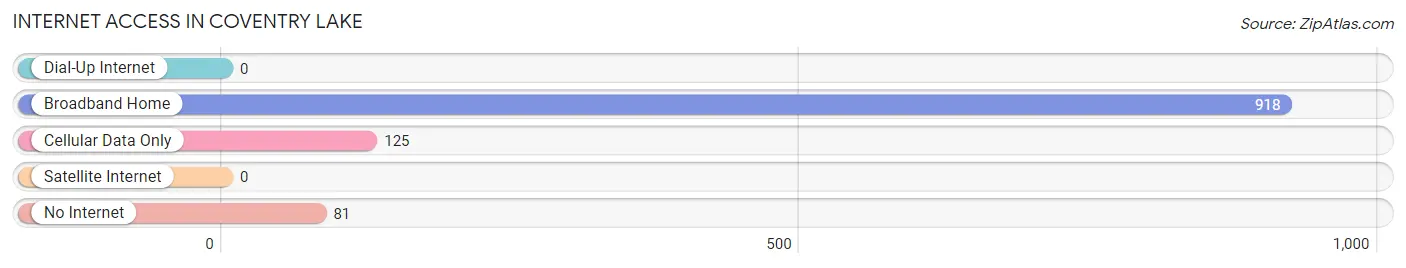
| Internet Type | # Households | % Households |
| Dial-Up Internet | 0 | 0.0% |
| Broadband Home | 918 | 80.8% |
| Cellular Data Only | 125 | 11.0% |
| Satellite Internet | 0 | 0.0% |
| No Internet | 81 | 7.1% |
| Total | 1,136 | 100.0% |
Coventry Lake Summary
Coventry Lake is a small lake located in the town of Coventry, Connecticut. It is a popular recreational spot for locals and visitors alike, offering a variety of activities such as fishing, swimming, boating, and camping. The lake is also home to a variety of wildlife, including beavers, muskrats, and waterfowl.
History
Coventry Lake was originally known as “Coventry Pond” and was created in the late 1700s when a dam was built across the Coventry River. The dam was built to provide power for a grist mill and saw mill. The lake was also used for ice harvesting in the winter months.
In the early 1900s, the lake was used for recreational activities such as swimming, fishing, and boating. In the 1950s, the lake was stocked with trout and bass, and a boat launch was built. In the 1970s, the lake was designated as a state park and a campground was built.
Geography
Coventry Lake is located in the town of Coventry, Connecticut. It is approximately 1.5 miles long and 0.5 miles wide. The lake is fed by the Coventry River and is surrounded by wooded hills and wetlands. The lake has a maximum depth of 30 feet and an average depth of 10 feet.
Economy
Coventry Lake is a popular recreational spot for locals and visitors alike. The lake is home to a variety of businesses, including marinas, boat rentals, and restaurants. The lake also attracts tourists who come to enjoy the lake’s natural beauty and recreational activities.
Demographics
Coventry Lake is located in the town of Coventry, Connecticut. According to the 2010 census, the town had a population of 12,435. The median age of the population was 41.7 years, and the median household income was $68,945. The town is predominantly white (94.3%) with a small percentage of African Americans (2.2%) and Hispanics (2.5%).
Conclusion
Coventry Lake is a popular recreational spot for locals and visitors alike. It is located in the town of Coventry, Connecticut and is surrounded by wooded hills and wetlands. The lake is home to a variety of businesses, including marinas, boat rentals, and restaurants. The lake also attracts tourists who come to enjoy the lake’s natural beauty and recreational activities. The town of Coventry has a population of 12,435 and a median household income of $68,945.
Common Questions
What is the Total Population of Coventry Lake?
Total Population of Coventry Lake is 2,230.
What is the Total Male Population of Coventry Lake?
Total Male Population of Coventry Lake is 1,101.
What is the Total Female Population of Coventry Lake?
Total Female Population of Coventry Lake is 1,129.
What is the Ratio of Males per 100 Females in Coventry Lake?
There are 97.52 Males per 100 Females in Coventry Lake.
What is the Ratio of Females per 100 Males in Coventry Lake?
There are 102.54 Females per 100 Males in Coventry Lake.
What is the Median Population Age in Coventry Lake?
Median Population Age in Coventry Lake is 55.9 Years.
What is the Average Family Size in Coventry Lake
Average Family Size in Coventry Lake is 2.5 People.
What is the Average Household Size in Coventry Lake
Average Household Size in Coventry Lake is 2.0 People.
What is Per Capita Income in Coventry Lake?
Per Capita income in Coventry Lake is $60,074.
What is the Median Family Income in Coventry Lake?
Median Family Income in Coventry Lake is $105,069.
What is the Median Household income in Coventry Lake?
Median Household Income in Coventry Lake is $86,394.
What is Income or Wage Gap in Coventry Lake?
Income or Wage Gap in Coventry Lake is 46.1%.
Women in Coventry Lake earn 53.9 cents for every dollar earned by a man.
What is Inequality or Gini Index in Coventry Lake?
Inequality or Gini Index in Coventry Lake is 0.50.
How Large is the Labor Force in Coventry Lake?
There are 1,235 People in the Labor Forcein in Coventry Lake.
What is the Percentage of People in the Labor Force in Coventry Lake?
62.4% of People are in the Labor Force in Coventry Lake.
What is the Unemployment Rate in Coventry Lake?
Unemployment Rate in Coventry Lake is 3.7%.