Zip Codes with the Highest Percentage of Population Employed in Health Diagnosing & Treating in Fort Worth, TX
RELATED REPORTS & OPTIONS
Health Diagnosing & Treating
Fort Worth
Compare Zip Codes
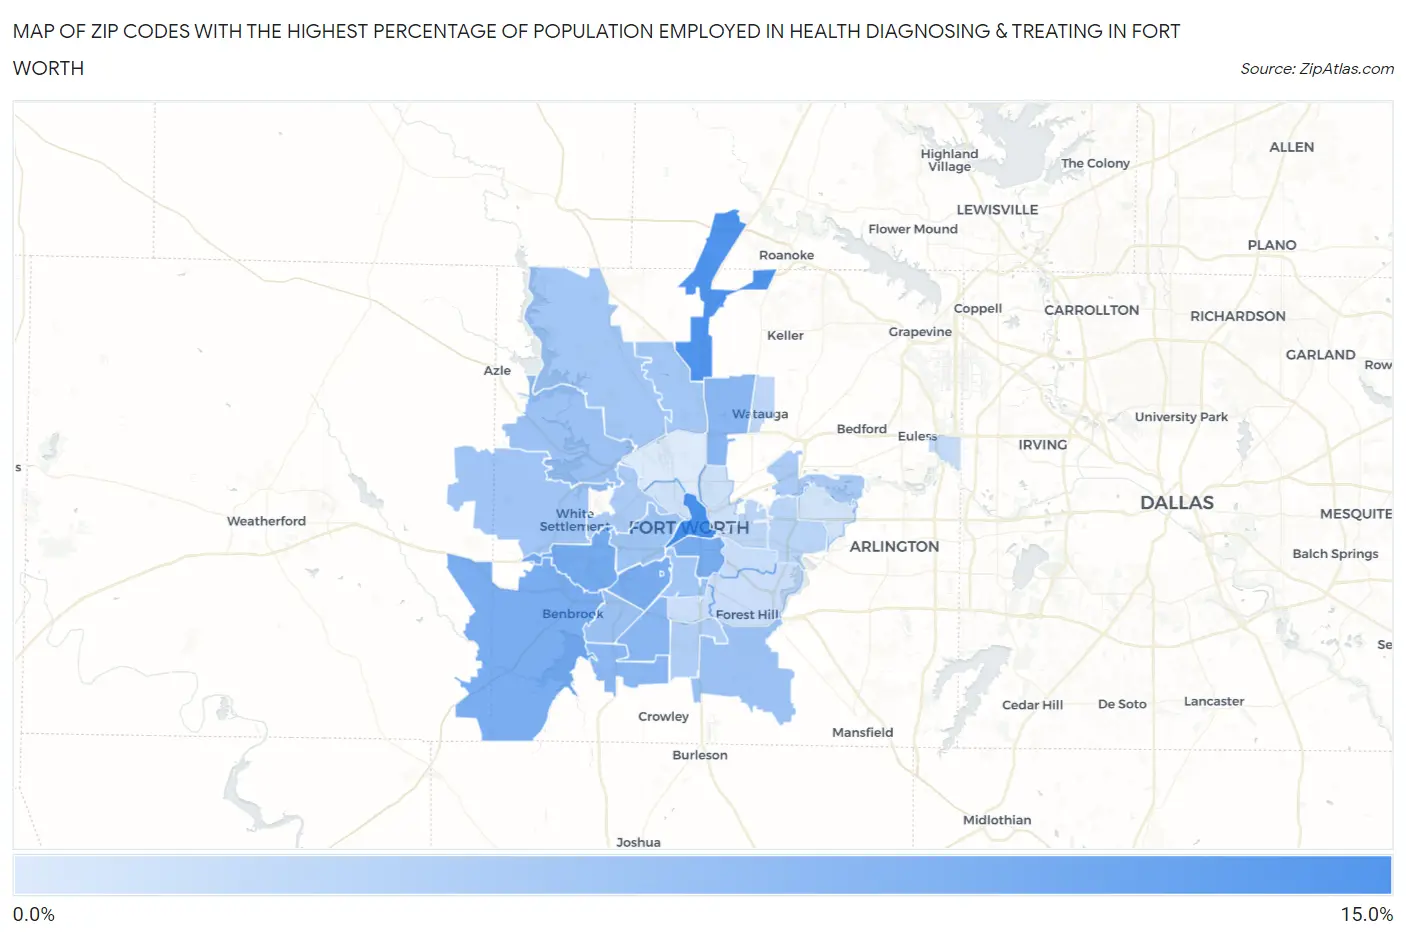
Map of Zip Codes with the Highest Percentage of Population Employed in Health Diagnosing & Treating in Fort Worth
0.0%
15.0%
Zip Codes with the Highest Percentage of Population Employed in Health Diagnosing & Treating in Fort Worth, TX
| Zip Code | % Employed | vs State | vs National | |
| 1. | 76102 | 10.8% | 5.5%(+5.26)#130 | 6.2%(+4.54)#3,072 |
| 2. | 76177 | 10.3% | 5.5%(+4.78)#149 | 6.2%(+4.05)#3,530 |
| 3. | 76129 | 8.0% | 5.5%(+2.48)#320 | 6.2%(+1.76)#7,494 |
| 4. | 76116 | 7.6% | 5.5%(+2.10)#367 | 6.2%(+1.37)#8,477 |
| 5. | 76104 | 7.5% | 5.5%(+1.96)#383 | 6.2%(+1.23)#8,878 |
| 6. | 76109 | 7.3% | 5.5%(+1.80)#406 | 6.2%(+1.08)#9,347 |
| 7. | 76126 | 7.3% | 5.5%(+1.76)#413 | 6.2%(+1.04)#9,474 |
| 8. | 76133 | 6.2% | 5.5%(+0.726)#553 | 6.2%(-0.000)#12,973 |
| 9. | 76123 | 6.1% | 5.5%(+0.592)#581 | 6.2%(-0.134)#13,490 |
| 10. | 76137 | 6.1% | 5.5%(+0.587)#582 | 6.2%(-0.139)#13,510 |
| 11. | 76132 | 5.0% | 5.5%(-0.473)#817 | 6.2%(-1.20)#17,519 |
| 12. | 76140 | 5.0% | 5.5%(-0.483)#821 | 6.2%(-1.21)#17,558 |
| 13. | 76135 | 4.9% | 5.5%(-0.612)#850 | 6.2%(-1.34)#18,072 |
| 14. | 76107 | 4.8% | 5.5%(-0.692)#863 | 6.2%(-1.42)#18,390 |
| 15. | 76108 | 4.6% | 5.5%(-0.963)#931 | 6.2%(-1.69)#19,428 |
| 16. | 76179 | 4.6% | 5.5%(-0.965)#932 | 6.2%(-1.69)#19,433 |
| 17. | 76131 | 4.4% | 5.5%(-1.08)#959 | 6.2%(-1.81)#19,885 |
| 18. | 76110 | 4.4% | 5.5%(-1.10)#961 | 6.2%(-1.82)#19,920 |
| 19. | 76114 | 4.1% | 5.5%(-1.46)#1,051 | 6.2%(-2.18)#21,169 |
| 20. | 76118 | 4.0% | 5.5%(-1.50)#1,060 | 6.2%(-2.22)#21,301 |
| 21. | 76134 | 3.6% | 5.5%(-1.93)#1,157 | 6.2%(-2.65)#22,641 |
| 22. | 76112 | 3.0% | 5.5%(-2.48)#1,290 | 6.2%(-3.21)#24,222 |
| 23. | 76148 | 2.9% | 5.5%(-2.65)#1,320 | 6.2%(-3.38)#24,667 |
| 24. | 76103 | 2.8% | 5.5%(-2.74)#1,333 | 6.2%(-3.47)#24,884 |
| 25. | 76155 | 2.4% | 5.5%(-3.16)#1,410 | 6.2%(-3.89)#25,811 |
| 26. | 76105 | 2.0% | 5.5%(-3.52)#1,465 | 6.2%(-4.25)#26,463 |
| 27. | 76115 | 2.0% | 5.5%(-3.56)#1,476 | 6.2%(-4.29)#26,530 |
| 28. | 76119 | 1.9% | 5.5%(-3.64)#1,494 | 6.2%(-4.37)#26,675 |
| 29. | 76111 | 1.8% | 5.5%(-3.71)#1,509 | 6.2%(-4.44)#26,789 |
| 30. | 76164 | 1.7% | 5.5%(-3.84)#1,533 | 6.2%(-4.57)#26,974 |
| 31. | 76120 | 1.4% | 5.5%(-4.07)#1,555 | 6.2%(-4.80)#27,274 |
| 32. | 76106 | 0.72% | 5.5%(-4.80)#1,621 | 6.2%(-5.52)#28,130 |
1
Common Questions
What are the Top 10 Zip Codes with the Highest Percentage of Population Employed in Health Diagnosing & Treating in Fort Worth, TX?
Top 10 Zip Codes with the Highest Percentage of Population Employed in Health Diagnosing & Treating in Fort Worth, TX are:
What zip code has the Highest Percentage of Population Employed in Health Diagnosing & Treating in Fort Worth, TX?
76102 has the Highest Percentage of Population Employed in Health Diagnosing & Treating in Fort Worth, TX with 10.8%.
What is the Percentage of Population Employed in Health Diagnosing & Treating in Fort Worth, TX?
Percentage of Population Employed in Health Diagnosing & Treating in Fort Worth is 5.0%.
What is the Percentage of Population Employed in Health Diagnosing & Treating in Texas?
Percentage of Population Employed in Health Diagnosing & Treating in Texas is 5.5%.
What is the Percentage of Population Employed in Health Diagnosing & Treating in the United States?
Percentage of Population Employed in Health Diagnosing & Treating in the United States is 6.2%.