Zip Codes with the Highest Percentage of Households Heated by Bottled Gas / Liquid Propane in Fort Worth, TX
RELATED REPORTS & OPTIONS
Bottled Gas / LP Heating
Fort Worth
Compare Zip Codes
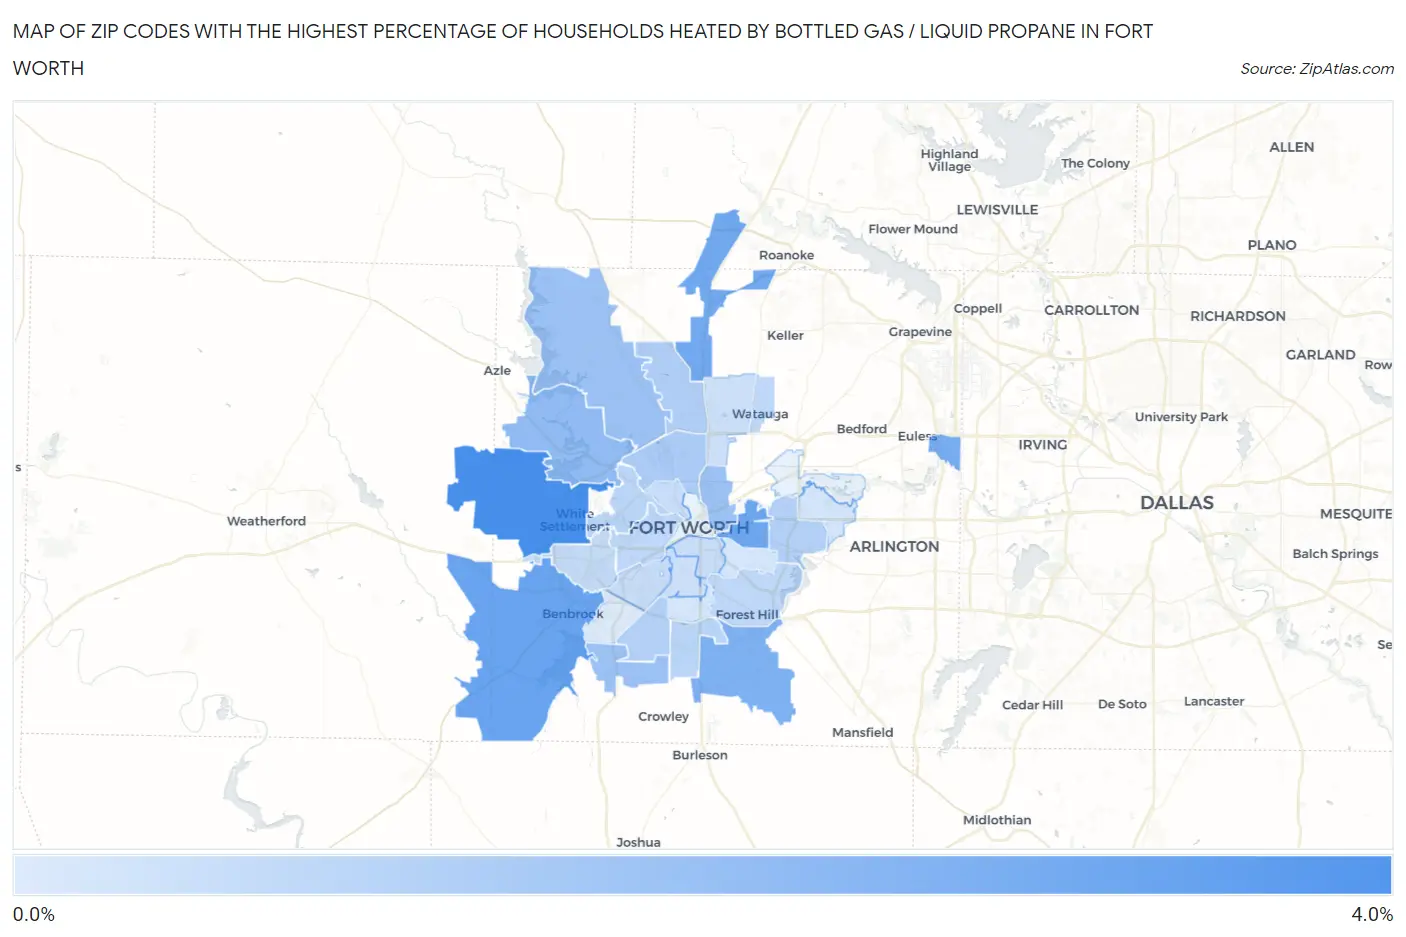
Map of Zip Codes with the Highest Percentage of Households Heated by Bottled Gas / Liquid Propane in Fort Worth
0.0%
4.0%
Zip Codes with the Highest Percentage of Households Heated by Bottled Gas / Liquid Propane in Fort Worth, TX
| Zip Code | Bottled Gas / LP Heating | vs State | vs National | |
| 1. | 76108 | 3.1% | 2.9%(+0.200)#1,023 | 4.9%(-1.80)#20,817 |
| 2. | 76126 | 2.4% | 2.9%(-0.500)#1,091 | 4.9%(-2.50)#22,180 |
| 3. | 76103 | 2.3% | 2.9%(-0.600)#1,115 | 4.9%(-2.60)#22,454 |
| 4. | 76177 | 2.2% | 2.9%(-0.700)#1,132 | 4.9%(-2.70)#22,664 |
| 5. | 76155 | 2.1% | 2.9%(-0.800)#1,146 | 4.9%(-2.80)#23,027 |
| 6. | 76140 | 2.0% | 2.9%(-0.900)#1,157 | 4.9%(-2.90)#23,169 |
| 7. | 76135 | 1.6% | 2.9%(-1.30)#1,221 | 4.9%(-3.30)#24,459 |
| 8. | 76179 | 1.4% | 2.9%(-1.50)#1,254 | 4.9%(-3.50)#24,957 |
| 9. | 76123 | 1.4% | 2.9%(-1.50)#1,264 | 4.9%(-3.50)#25,027 |
| 10. | 76111 | 1.4% | 2.9%(-1.50)#1,274 | 4.9%(-3.50)#25,165 |
| 11. | 76106 | 1.1% | 2.9%(-1.80)#1,337 | 4.9%(-3.80)#26,201 |
| 12. | 76131 | 1.0% | 2.9%(-1.90)#1,371 | 4.9%(-3.90)#26,548 |
| 13. | 76133 | 0.90% | 2.9%(-2.00)#1,399 | 4.9%(-4.00)#26,954 |
| 14. | 76112 | 0.90% | 2.9%(-2.00)#1,407 | 4.9%(-4.00)#26,991 |
| 15. | 76134 | 0.80% | 2.9%(-2.10)#1,447 | 4.9%(-4.10)#27,494 |
| 16. | 76114 | 0.80% | 2.9%(-2.10)#1,451 | 4.9%(-4.10)#27,514 |
| 17. | 76119 | 0.70% | 2.9%(-2.20)#1,472 | 4.9%(-4.20)#27,762 |
| 18. | 76107 | 0.70% | 2.9%(-2.20)#1,488 | 4.9%(-4.20)#27,863 |
| 19. | 76148 | 0.70% | 2.9%(-2.20)#1,491 | 4.9%(-4.20)#27,907 |
| 20. | 76116 | 0.60% | 2.9%(-2.30)#1,510 | 4.9%(-4.30)#28,132 |
| 21. | 76109 | 0.50% | 2.9%(-2.40)#1,570 | 4.9%(-4.40)#28,606 |
| 22. | 76104 | 0.50% | 2.9%(-2.40)#1,579 | 4.9%(-4.40)#28,667 |
| 23. | 76164 | 0.50% | 2.9%(-2.40)#1,584 | 4.9%(-4.40)#28,702 |
| 24. | 76137 | 0.40% | 2.9%(-2.50)#1,593 | 4.9%(-4.50)#28,811 |
| 25. | 76110 | 0.40% | 2.9%(-2.50)#1,605 | 4.9%(-4.50)#28,874 |
| 26. | 76105 | 0.30% | 2.9%(-2.60)#1,651 | 4.9%(-4.60)#29,182 |
| 27. | 76115 | 0.30% | 2.9%(-2.60)#1,655 | 4.9%(-4.60)#29,197 |
| 28. | 76120 | 0.30% | 2.9%(-2.60)#1,657 | 4.9%(-4.60)#29,207 |
| 29. | 76132 | 0.10% | 2.9%(-2.80)#1,696 | 4.9%(-4.80)#29,559 |
1
Common Questions
What are the Top 10 Zip Codes with the Highest Percentage of Households Heated by Bottled Gas / Liquid Propane in Fort Worth, TX?
Top 10 Zip Codes with the Highest Percentage of Households Heated by Bottled Gas / Liquid Propane in Fort Worth, TX are:
What zip code has the Highest Percentage of Households Heated by Bottled Gas / Liquid Propane in Fort Worth, TX?
76108 has the Highest Percentage of Households Heated by Bottled Gas / Liquid Propane in Fort Worth, TX with 3.1%.
What is the Percentage of Households Heated by Bottled Gas / Liquid Propane in Fort Worth, TX?
Percentage of Households Heated by Bottled Gas / Liquid Propane in Fort Worth is 0.90%.
What is the Percentage of Households Heated by Bottled Gas / Liquid Propane in Texas?
Percentage of Households Heated by Bottled Gas / Liquid Propane in Texas is 2.9%.
What is the Percentage of Households Heated by Bottled Gas / Liquid Propane in the United States?
Percentage of Households Heated by Bottled Gas / Liquid Propane in the United States is 4.9%.