Zip Codes with the Highest Percentage of Population Employed in Life, Physical & Social Science in Fort Worth, TX
RELATED REPORTS & OPTIONS
Life, Physical & Social Science
Fort Worth
Compare Zip Codes
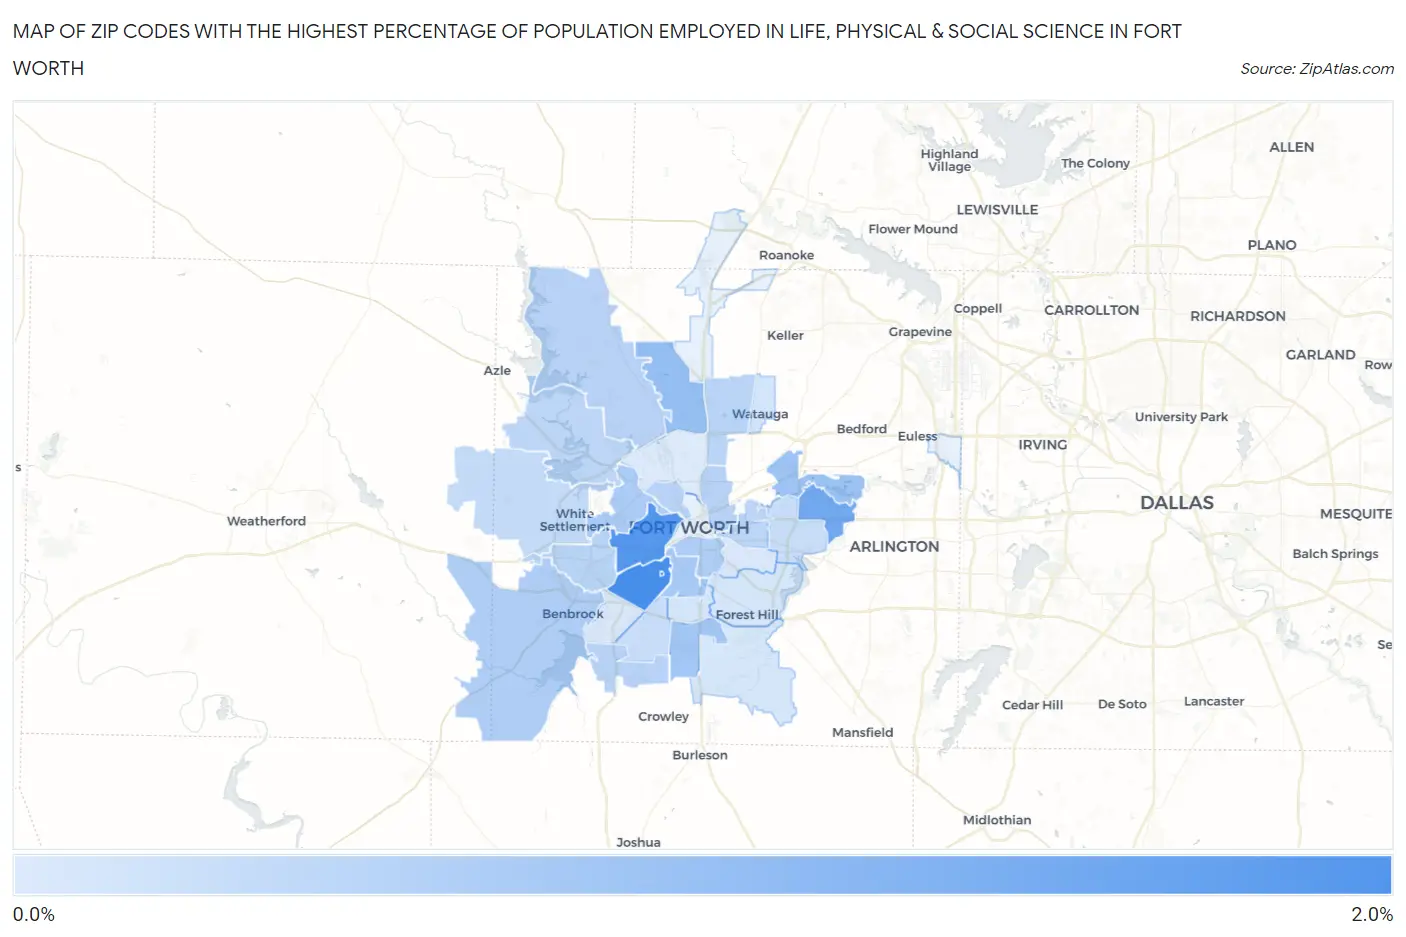
Map of Zip Codes with the Highest Percentage of Population Employed in Life, Physical & Social Science in Fort Worth
0.0%
2.0%
Zip Codes with the Highest Percentage of Population Employed in Life, Physical & Social Science in Fort Worth, TX
| Zip Code | % Employed | vs State | vs National | |
| 1. | 76129 | 1.9% | 0.84%(+1.02)#144 | 1.1%(+0.776)#4,084 |
| 2. | 76109 | 1.9% | 0.84%(+1.01)#145 | 1.1%(+0.763)#4,124 |
| 3. | 76107 | 1.7% | 0.84%(+0.858)#177 | 1.1%(+0.610)#4,720 |
| 4. | 76120 | 1.3% | 0.84%(+0.487)#273 | 1.1%(+0.239)#6,606 |
| 5. | 76131 | 0.92% | 0.84%(+0.082)#444 | 1.1%(-0.167)#9,719 |
| 6. | 76118 | 0.79% | 0.84%(-0.053)#520 | 1.1%(-0.302)#11,102 |
| 7. | 76134 | 0.74% | 0.84%(-0.104)#546 | 1.1%(-0.353)#11,629 |
| 8. | 76110 | 0.70% | 0.84%(-0.144)#573 | 1.1%(-0.392)#12,055 |
| 9. | 76114 | 0.63% | 0.84%(-0.215)#635 | 1.1%(-0.463)#12,935 |
| 10. | 76126 | 0.61% | 0.84%(-0.233)#648 | 1.1%(-0.481)#13,159 |
| 11. | 76104 | 0.61% | 0.84%(-0.234)#649 | 1.1%(-0.483)#13,185 |
| 12. | 76123 | 0.49% | 0.84%(-0.351)#742 | 1.1%(-0.600)#14,617 |
| 13. | 76164 | 0.49% | 0.84%(-0.357)#745 | 1.1%(-0.606)#14,687 |
| 14. | 76179 | 0.48% | 0.84%(-0.358)#748 | 1.1%(-0.606)#14,698 |
| 15. | 76111 | 0.48% | 0.84%(-0.363)#755 | 1.1%(-0.612)#14,775 |
| 16. | 76137 | 0.46% | 0.84%(-0.379)#763 | 1.1%(-0.627)#14,970 |
| 17. | 76116 | 0.45% | 0.84%(-0.391)#777 | 1.1%(-0.639)#15,117 |
| 18. | 76103 | 0.44% | 0.84%(-0.402)#784 | 1.1%(-0.651)#15,256 |
| 19. | 76135 | 0.43% | 0.84%(-0.415)#800 | 1.1%(-0.663)#15,397 |
| 20. | 76108 | 0.35% | 0.84%(-0.497)#874 | 1.1%(-0.745)#16,462 |
| 21. | 76133 | 0.31% | 0.84%(-0.537)#907 | 1.1%(-0.785)#16,998 |
| 22. | 76112 | 0.29% | 0.84%(-0.557)#928 | 1.1%(-0.806)#17,230 |
| 23. | 76148 | 0.16% | 0.84%(-0.679)#1,029 | 1.1%(-0.927)#18,562 |
| 24. | 76140 | 0.13% | 0.84%(-0.715)#1,056 | 1.1%(-0.964)#18,885 |
| 25. | 76119 | 0.13% | 0.84%(-0.716)#1,058 | 1.1%(-0.965)#18,890 |
| 26. | 76115 | 0.12% | 0.84%(-0.724)#1,068 | 1.1%(-0.972)#18,955 |
| 27. | 76105 | 0.097% | 0.84%(-0.746)#1,088 | 1.1%(-0.994)#19,093 |
| 28. | 76132 | 0.085% | 0.84%(-0.757)#1,095 | 1.1%(-1.01)#19,166 |
| 29. | 76106 | 0.047% | 0.84%(-0.796)#1,114 | 1.1%(-1.04)#19,348 |
1
Common Questions
What are the Top 10 Zip Codes with the Highest Percentage of Population Employed in Life, Physical & Social Science in Fort Worth, TX?
Top 10 Zip Codes with the Highest Percentage of Population Employed in Life, Physical & Social Science in Fort Worth, TX are:
What zip code has the Highest Percentage of Population Employed in Life, Physical & Social Science in Fort Worth, TX?
76129 has the Highest Percentage of Population Employed in Life, Physical & Social Science in Fort Worth, TX with 1.9%.
What is the Percentage of Population Employed in Life, Physical & Social Science in Fort Worth, TX?
Percentage of Population Employed in Life, Physical & Social Science in Fort Worth is 0.57%.
What is the Percentage of Population Employed in Life, Physical & Social Science in Texas?
Percentage of Population Employed in Life, Physical & Social Science in Texas is 0.84%.
What is the Percentage of Population Employed in Life, Physical & Social Science in the United States?
Percentage of Population Employed in Life, Physical & Social Science in the United States is 1.1%.