Zip Codes with the Highest Percentage of Population Employed in Health Diagnosing & Treating in Gilmer, TX
RELATED REPORTS & OPTIONS
Health Diagnosing & Treating
Gilmer
Compare Zip Codes
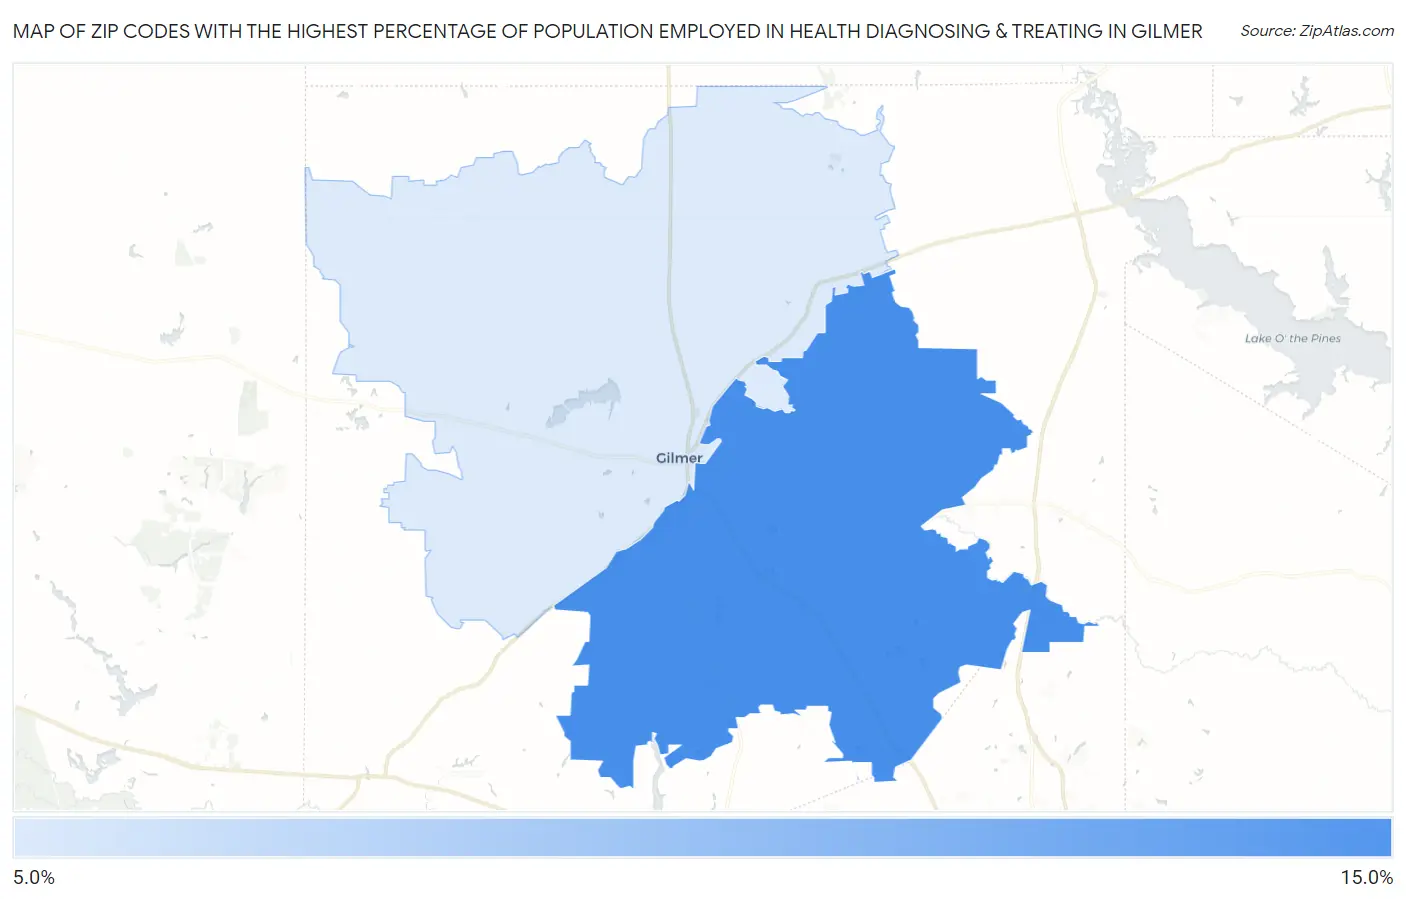
Map of Zip Codes with the Highest Percentage of Population Employed in Health Diagnosing & Treating in Gilmer
0.0%
15.0%
Zip Codes with the Highest Percentage of Population Employed in Health Diagnosing & Treating in Gilmer, TX
| Zip Code | % Employed | vs State | vs National | |
| 1. | 75645 | 12.5% | 5.5%(+6.93)#90 | 6.2%(+6.21)#1,978 |
| 2. | 75644 | 5.7% | 5.5%(+0.162)#661 | 6.2%(-0.564)#15,056 |
1
Common Questions
What are the Top Zip Codes with the Highest Percentage of Population Employed in Health Diagnosing & Treating in Gilmer, TX?
Top Zip Codes with the Highest Percentage of Population Employed in Health Diagnosing & Treating in Gilmer, TX are:
What zip code has the Highest Percentage of Population Employed in Health Diagnosing & Treating in Gilmer, TX?
75645 has the Highest Percentage of Population Employed in Health Diagnosing & Treating in Gilmer, TX with 12.5%.
What is the Percentage of Population Employed in Health Diagnosing & Treating in Gilmer, TX?
Percentage of Population Employed in Health Diagnosing & Treating in Gilmer is 3.5%.
What is the Percentage of Population Employed in Health Diagnosing & Treating in Texas?
Percentage of Population Employed in Health Diagnosing & Treating in Texas is 5.5%.
What is the Percentage of Population Employed in Health Diagnosing & Treating in the United States?
Percentage of Population Employed in Health Diagnosing & Treating in the United States is 6.2%.