Zip Codes with the Highest Percentage of Population with a Degree in Science and Engineering in Fort Worth, TX
RELATED REPORTS & OPTIONS
Science and Engineering
Fort Worth
Compare Zip Codes
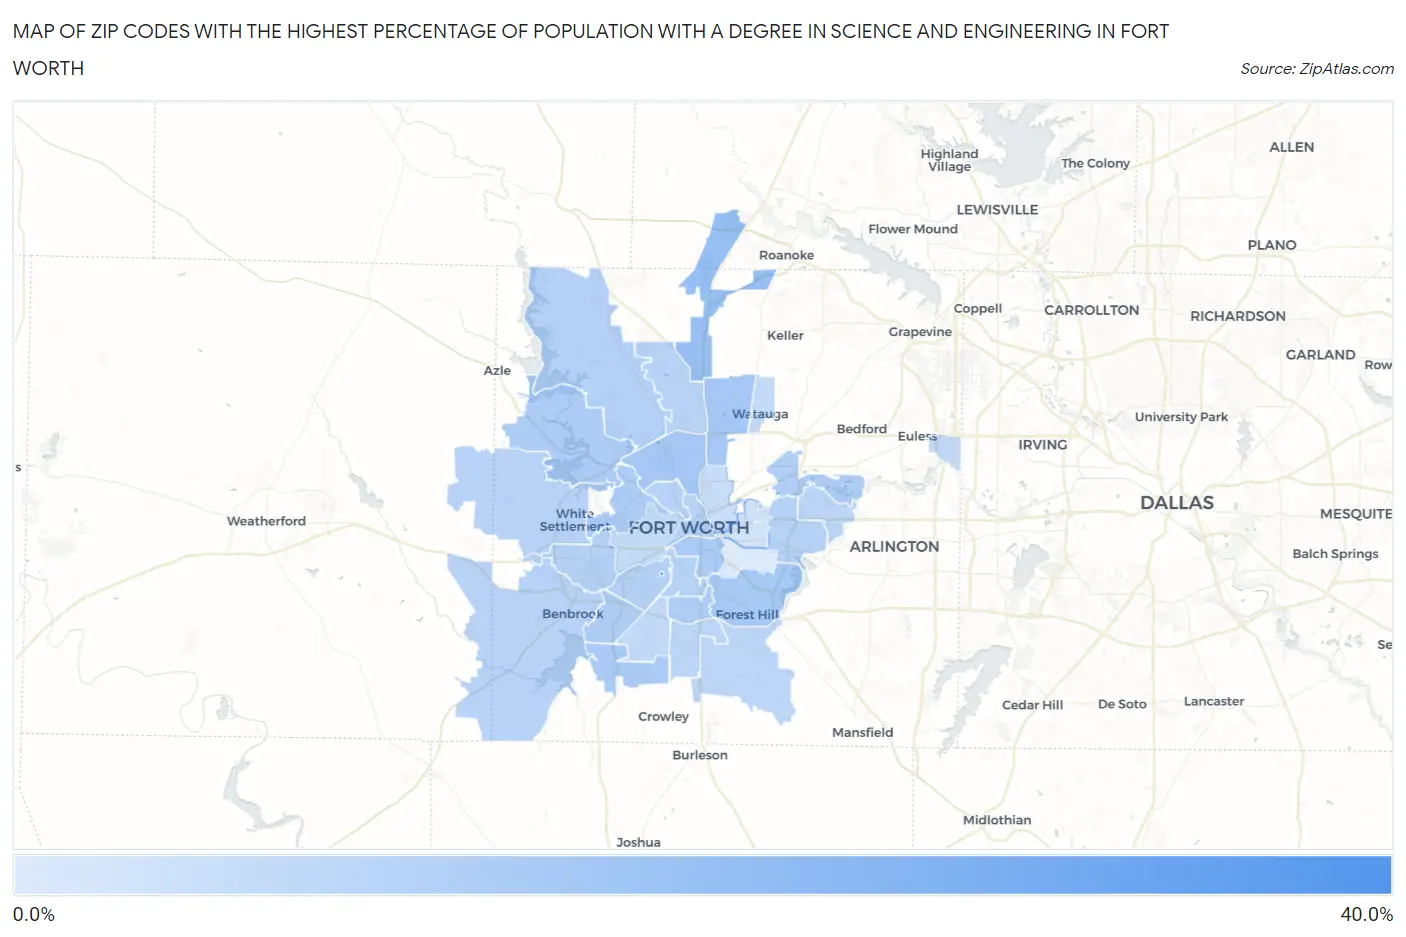
Map of Zip Codes with the Highest Percentage of Population with a Degree in Science and Engineering in Fort Worth
0.0%
40.0%
Zip Codes with the Highest Percentage of Population with a Degree in Science and Engineering in Fort Worth, TX
| Zip Code | % Graduates | vs State | vs National | |
| 1. | 76129 | 36.8% | 9.5%(+27.3)#27 | 9.8%(+27.1)#817 |
| 2. | 76177 | 16.4% | 9.5%(+6.87)#204 | 9.8%(+6.61)#5,445 |
| 3. | 76106 | 13.2% | 9.5%(+3.67)#378 | 9.8%(+3.41)#8,942 |
| 4. | 76137 | 13.0% | 9.5%(+3.48)#392 | 9.8%(+3.22)#9,248 |
| 5. | 76119 | 12.3% | 9.5%(+2.78)#452 | 9.8%(+2.53)#10,360 |
| 6. | 76123 | 12.2% | 9.5%(+2.64)#466 | 9.8%(+2.38)#10,616 |
| 7. | 76104 | 12.0% | 9.5%(+2.45)#486 | 9.8%(+2.19)#10,930 |
| 8. | 76114 | 11.3% | 9.5%(+1.77)#555 | 9.8%(+1.51)#12,247 |
| 9. | 76135 | 11.2% | 9.5%(+1.66)#569 | 9.8%(+1.40)#12,463 |
| 10. | 76132 | 11.1% | 9.5%(+1.53)#589 | 9.8%(+1.27)#12,754 |
| 11. | 76115 | 11.0% | 9.5%(+1.46)#599 | 9.8%(+1.20)#12,918 |
| 12. | 76118 | 10.5% | 9.5%(+0.980)#648 | 9.8%(+0.720)#13,965 |
| 13. | 76179 | 10.1% | 9.5%(+0.589)#694 | 9.8%(+0.330)#14,792 |
| 14. | 76102 | 9.5% | 9.5%(-0.067)#796 | 9.8%(-0.327)#16,273 |
| 15. | 76109 | 9.4% | 9.5%(-0.126)#802 | 9.8%(-0.386)#16,411 |
| 16. | 76110 | 9.3% | 9.5%(-0.250)#823 | 9.8%(-0.510)#16,708 |
| 17. | 76116 | 9.2% | 9.5%(-0.338)#838 | 9.8%(-0.597)#16,896 |
| 18. | 76112 | 9.2% | 9.5%(-0.366)#843 | 9.8%(-0.625)#16,956 |
| 19. | 76164 | 9.1% | 9.5%(-0.411)#850 | 9.8%(-0.671)#17,049 |
| 20. | 76131 | 8.9% | 9.5%(-0.617)#878 | 9.8%(-0.877)#17,544 |
| 21. | 76108 | 8.9% | 9.5%(-0.644)#883 | 9.8%(-0.904)#17,605 |
| 22. | 76126 | 8.7% | 9.5%(-0.807)#910 | 9.8%(-1.07)#17,988 |
| 23. | 76134 | 8.0% | 9.5%(-1.51)#1,007 | 9.8%(-1.77)#19,606 |
| 24. | 76140 | 7.9% | 9.5%(-1.65)#1,029 | 9.8%(-1.91)#19,926 |
| 25. | 76120 | 7.8% | 9.5%(-1.71)#1,039 | 9.8%(-1.97)#20,057 |
| 26. | 76133 | 7.0% | 9.5%(-2.56)#1,149 | 9.8%(-2.82)#21,795 |
| 27. | 76155 | 6.9% | 9.5%(-2.63)#1,158 | 9.8%(-2.88)#21,890 |
| 28. | 76148 | 6.2% | 9.5%(-3.30)#1,241 | 9.8%(-3.56)#23,085 |
| 29. | 76107 | 5.7% | 9.5%(-3.87)#1,310 | 9.8%(-4.13)#23,933 |
| 30. | 76111 | 5.2% | 9.5%(-4.28)#1,348 | 9.8%(-4.53)#24,439 |
| 31. | 76103 | 3.6% | 9.5%(-5.88)#1,466 | 9.8%(-6.14)#26,029 |
| 32. | 76105 | 1.0% | 9.5%(-8.49)#1,557 | 9.8%(-8.75)#27,340 |
1
Common Questions
What are the Top 10 Zip Codes with the Highest Percentage of Population with a Degree in Science and Engineering in Fort Worth, TX?
Top 10 Zip Codes with the Highest Percentage of Population with a Degree in Science and Engineering in Fort Worth, TX are:
What zip code has the Highest Percentage of Population with a Degree in Science and Engineering in Fort Worth, TX?
76129 has the Highest Percentage of Population with a Degree in Science and Engineering in Fort Worth, TX with 36.8%.
What is the Percentage of Population with a Degree in Science and Engineering in Fort Worth, TX?
Percentage of Population with a Degree in Science and Engineering in Fort Worth is 9.9%.
What is the Percentage of Population with a Degree in Science and Engineering in Texas?
Percentage of Population with a Degree in Science and Engineering in Texas is 9.5%.
What is the Percentage of Population with a Degree in Science and Engineering in the United States?
Percentage of Population with a Degree in Science and Engineering in the United States is 9.8%.