Zip Codes with the Highest Percentage of Population Employed in Construction & Extraction in Fort Worth, TX
RELATED REPORTS & OPTIONS
Construction & Extraction
Fort Worth
Compare Zip Codes
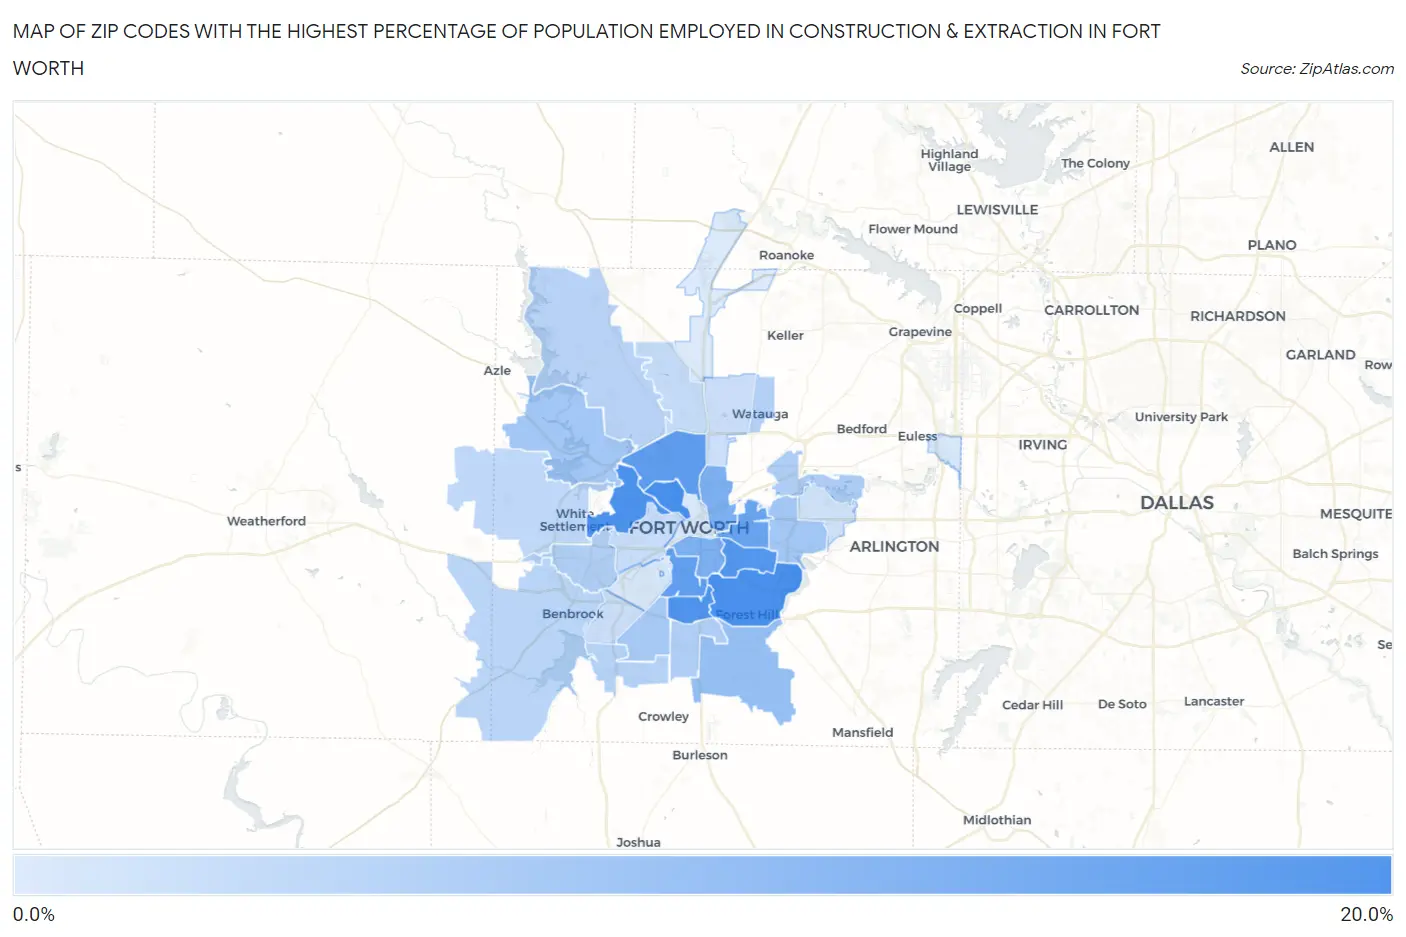
Map of Zip Codes with the Highest Percentage of Population Employed in Construction & Extraction in Fort Worth
0.0%
20.0%
Zip Codes with the Highest Percentage of Population Employed in Construction & Extraction in Fort Worth, TX
| Zip Code | % Employed | vs State | vs National | |
| 1. | 76164 | 18.2% | 6.6%(+11.6)#113 | 5.0%(+13.2)#1,270 |
| 2. | 76119 | 17.8% | 6.6%(+11.2)#122 | 5.0%(+12.8)#1,330 |
| 3. | 76114 | 17.7% | 6.6%(+11.1)#123 | 5.0%(+12.7)#1,336 |
| 4. | 76115 | 17.0% | 6.6%(+10.4)#131 | 5.0%(+12.0)#1,467 |
| 5. | 76105 | 16.7% | 6.6%(+10.1)#142 | 5.0%(+11.7)#1,559 |
| 6. | 76106 | 15.4% | 6.6%(+8.80)#182 | 5.0%(+10.4)#1,875 |
| 7. | 76110 | 15.0% | 6.6%(+8.44)#201 | 5.0%(+10.0)#2,003 |
| 8. | 76103 | 13.8% | 6.6%(+7.22)#264 | 5.0%(+8.82)#2,541 |
| 9. | 76111 | 11.8% | 6.6%(+5.18)#363 | 5.0%(+6.78)#3,732 |
| 10. | 76104 | 11.7% | 6.6%(+5.08)#372 | 5.0%(+6.69)#3,820 |
| 11. | 76140 | 8.9% | 6.6%(+2.25)#634 | 5.0%(+3.86)#6,995 |
| 12. | 76135 | 7.3% | 6.6%(+0.722)#831 | 5.0%(+2.33)#9,938 |
| 13. | 76112 | 7.3% | 6.6%(+0.704)#837 | 5.0%(+2.31)#9,983 |
| 14. | 76133 | 6.7% | 6.6%(+0.101)#928 | 5.0%(+1.71)#11,486 |
| 15. | 76118 | 6.0% | 6.6%(-0.610)#1,019 | 5.0%(+0.996)#13,534 |
| 16. | 76134 | 5.8% | 6.6%(-0.801)#1,044 | 5.0%(+0.805)#14,080 |
| 17. | 76116 | 5.8% | 6.6%(-0.840)#1,050 | 5.0%(+0.766)#14,184 |
| 18. | 76148 | 5.3% | 6.6%(-1.29)#1,114 | 5.0%(+0.315)#15,694 |
| 19. | 76123 | 5.2% | 6.6%(-1.40)#1,129 | 5.0%(+0.208)#16,043 |
| 20. | 76179 | 4.8% | 6.6%(-1.76)#1,189 | 5.0%(-0.150)#17,293 |
| 21. | 76126 | 4.7% | 6.6%(-1.87)#1,209 | 5.0%(-0.260)#17,675 |
| 22. | 76108 | 4.0% | 6.6%(-2.57)#1,306 | 5.0%(-0.960)#20,208 |
| 23. | 76131 | 3.6% | 6.6%(-2.99)#1,369 | 5.0%(-1.38)#21,638 |
| 24. | 76107 | 3.1% | 6.6%(-3.52)#1,433 | 5.0%(-1.91)#23,317 |
| 25. | 76132 | 2.8% | 6.6%(-3.82)#1,479 | 5.0%(-2.22)#24,264 |
| 26. | 76137 | 2.8% | 6.6%(-3.83)#1,480 | 5.0%(-2.22)#24,266 |
| 27. | 76120 | 2.3% | 6.6%(-4.30)#1,529 | 5.0%(-2.70)#25,580 |
| 28. | 76155 | 1.7% | 6.6%(-4.94)#1,602 | 5.0%(-3.33)#27,073 |
| 29. | 76102 | 1.4% | 6.6%(-5.23)#1,635 | 5.0%(-3.62)#27,691 |
| 30. | 76109 | 1.3% | 6.6%(-5.28)#1,640 | 5.0%(-3.68)#27,800 |
| 31. | 76177 | 0.91% | 6.6%(-5.69)#1,669 | 5.0%(-4.09)#28,470 |
1
Common Questions
What are the Top 10 Zip Codes with the Highest Percentage of Population Employed in Construction & Extraction in Fort Worth, TX?
Top 10 Zip Codes with the Highest Percentage of Population Employed in Construction & Extraction in Fort Worth, TX are:
What zip code has the Highest Percentage of Population Employed in Construction & Extraction in Fort Worth, TX?
76164 has the Highest Percentage of Population Employed in Construction & Extraction in Fort Worth, TX with 18.2%.
What is the Percentage of Population Employed in Construction & Extraction in Fort Worth, TX?
Percentage of Population Employed in Construction & Extraction in Fort Worth is 6.5%.
What is the Percentage of Population Employed in Construction & Extraction in Texas?
Percentage of Population Employed in Construction & Extraction in Texas is 6.6%.
What is the Percentage of Population Employed in Construction & Extraction in the United States?
Percentage of Population Employed in Construction & Extraction in the United States is 5.0%.