Zip Codes with the Highest Percentage of Population Employed in Health Diagnosing & Treating in Hawaii
RELATED REPORTS & OPTIONS
Health Diagnosing & Treating
Hawaii
Compare Zip Codes
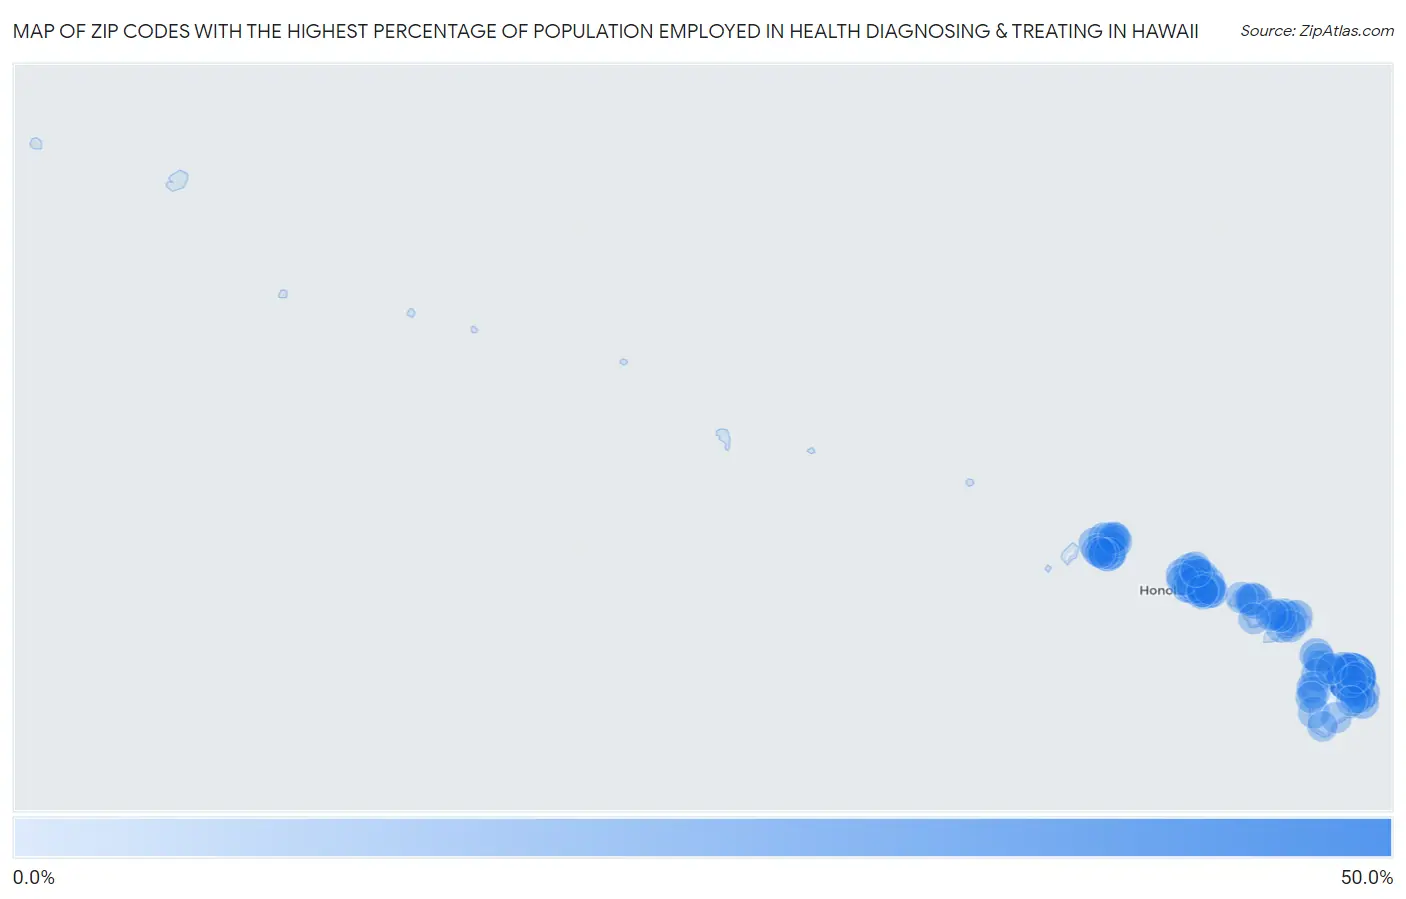
Map of Zip Codes with the Highest Percentage of Population Employed in Health Diagnosing & Treating in Hawaii
0.0%
50.0%
Zip Codes with the Highest Percentage of Population Employed in Health Diagnosing & Treating in Hawaii
| Zip Code | % Employed | vs State | vs National | |
| 1. | 96710 | 46.6% | 5.7%(+40.9)#1 | 6.2%(+40.4)#83 |
| 2. | 96765 | 18.1% | 5.7%(+12.3)#2 | 6.2%(+11.8)#700 |
| 3. | 96783 | 13.8% | 5.7%(+8.06)#3 | 6.2%(+7.55)#1,471 |
| 4. | 96748 | 11.5% | 5.7%(+5.79)#4 | 6.2%(+5.28)#2,511 |
| 5. | 96734 | 10.5% | 5.7%(+4.76)#5 | 6.2%(+4.25)#3,318 |
| 6. | 96821 | 10.5% | 5.7%(+4.74)#6 | 6.2%(+4.23)#3,335 |
| 7. | 96773 | 10.3% | 5.7%(+4.61)#7 | 6.2%(+4.10)#3,476 |
| 8. | 96768 | 9.3% | 5.7%(+3.60)#8 | 6.2%(+3.09)#4,796 |
| 9. | 96743 | 9.0% | 5.7%(+3.23)#9 | 6.2%(+2.72)#5,431 |
| 10. | 96730 | 8.8% | 5.7%(+3.03)#10 | 6.2%(+2.52)#5,798 |
| 11. | 96776 | 8.3% | 5.7%(+2.55)#11 | 6.2%(+2.04)#6,814 |
| 12. | 96815 | 8.1% | 5.7%(+2.39)#12 | 6.2%(+1.88)#7,182 |
| 13. | 96822 | 7.8% | 5.7%(+2.07)#13 | 6.2%(+1.56)#7,976 |
| 14. | 96719 | 7.7% | 5.7%(+1.98)#14 | 6.2%(+1.47)#8,198 |
| 15. | 96712 | 7.6% | 5.7%(+1.85)#15 | 6.2%(+1.34)#8,559 |
| 16. | 96744 | 7.2% | 5.7%(+1.43)#16 | 6.2%(+0.923)#9,818 |
| 17. | 96791 | 7.1% | 5.7%(+1.37)#17 | 6.2%(+0.865)#10,001 |
| 18. | 96816 | 6.9% | 5.7%(+1.17)#18 | 6.2%(+0.660)#10,657 |
| 19. | 96779 | 6.7% | 5.7%(+1.01)#19 | 6.2%(+0.497)#11,184 |
| 20. | 96813 | 6.7% | 5.7%(+0.957)#20 | 6.2%(+0.448)#11,330 |
| 21. | 96720 | 6.6% | 5.7%(+0.908)#21 | 6.2%(+0.399)#11,512 |
| 22. | 96818 | 6.6% | 5.7%(+0.870)#22 | 6.2%(+0.361)#11,634 |
| 23. | 96789 | 6.6% | 5.7%(+0.820)#23 | 6.2%(+0.311)#11,834 |
| 24. | 96825 | 6.4% | 5.7%(+0.674)#24 | 6.2%(+0.165)#12,340 |
| 25. | 96814 | 6.2% | 5.7%(+0.415)#25 | 6.2%(-0.094)#13,345 |
| 26. | 96738 | 6.1% | 5.7%(+0.319)#26 | 6.2%(-0.190)#13,667 |
| 27. | 96706 | 5.9% | 5.7%(+0.146)#27 | 6.2%(-0.363)#14,307 |
| 28. | 96708 | 5.8% | 5.7%(+0.111)#28 | 6.2%(-0.398)#14,431 |
| 29. | 96786 | 5.8% | 5.7%(+0.044)#29 | 6.2%(-0.465)#14,688 |
| 30. | 96707 | 5.8% | 5.7%(+0.027)#30 | 6.2%(-0.482)#14,743 |
| 31. | 96701 | 5.7% | 5.7%(+0.001)#31 | 6.2%(-0.508)#14,849 |
| 32. | 96752 | 5.7% | 5.7%(-0.065)#32 | 6.2%(-0.574)#15,097 |
| 33. | 96782 | 5.7% | 5.7%(-0.084)#33 | 6.2%(-0.593)#15,178 |
| 34. | 96717 | 5.6% | 5.7%(-0.108)#34 | 6.2%(-0.617)#15,280 |
| 35. | 96742 | 5.6% | 5.7%(-0.180)#35 | 6.2%(-0.689)#15,588 |
| 36. | 96753 | 5.4% | 5.7%(-0.287)#36 | 6.2%(-0.796)#15,974 |
| 37. | 96778 | 5.4% | 5.7%(-0.304)#37 | 6.2%(-0.813)#16,042 |
| 38. | 96797 | 5.1% | 5.7%(-0.663)#38 | 6.2%(-1.17)#17,412 |
| 39. | 96793 | 5.0% | 5.7%(-0.770)#39 | 6.2%(-1.28)#17,845 |
| 40. | 96714 | 4.9% | 5.7%(-0.809)#40 | 6.2%(-1.32)#17,983 |
| 41. | 96725 | 4.9% | 5.7%(-0.882)#41 | 6.2%(-1.39)#18,279 |
| 42. | 96817 | 4.8% | 5.7%(-0.981)#42 | 6.2%(-1.49)#18,673 |
| 43. | 96741 | 4.6% | 5.7%(-1.13)#43 | 6.2%(-1.64)#19,225 |
| 44. | 96749 | 4.6% | 5.7%(-1.18)#44 | 6.2%(-1.69)#19,436 |
| 45. | 96722 | 4.5% | 5.7%(-1.26)#45 | 6.2%(-1.77)#19,737 |
| 46. | 96766 | 4.3% | 5.7%(-1.42)#46 | 6.2%(-1.93)#20,278 |
| 47. | 96790 | 4.3% | 5.7%(-1.48)#47 | 6.2%(-1.99)#20,507 |
| 48. | 96746 | 4.1% | 5.7%(-1.62)#48 | 6.2%(-2.13)#21,004 |
| 49. | 96757 | 4.1% | 5.7%(-1.64)#49 | 6.2%(-2.15)#21,066 |
| 50. | 96731 | 4.0% | 5.7%(-1.75)#50 | 6.2%(-2.26)#21,404 |
| 51. | 96755 | 3.8% | 5.7%(-1.90)#51 | 6.2%(-2.41)#21,902 |
| 52. | 96740 | 3.7% | 5.7%(-2.03)#52 | 6.2%(-2.54)#22,273 |
| 53. | 96819 | 3.7% | 5.7%(-2.08)#53 | 6.2%(-2.59)#22,440 |
| 54. | 96703 | 3.6% | 5.7%(-2.10)#54 | 6.2%(-2.61)#22,496 |
| 55. | 96796 | 3.6% | 5.7%(-2.12)#55 | 6.2%(-2.63)#22,558 |
| 56. | 96760 | 3.6% | 5.7%(-2.16)#56 | 6.2%(-2.67)#22,683 |
| 57. | 96771 | 3.5% | 5.7%(-2.23)#57 | 6.2%(-2.74)#22,902 |
| 58. | 96732 | 3.5% | 5.7%(-2.24)#58 | 6.2%(-2.75)#22,924 |
| 59. | 96795 | 3.5% | 5.7%(-2.25)#59 | 6.2%(-2.76)#22,942 |
| 60. | 96704 | 3.4% | 5.7%(-2.36)#60 | 6.2%(-2.87)#23,244 |
| 61. | 96792 | 3.4% | 5.7%(-2.37)#61 | 6.2%(-2.88)#23,276 |
| 62. | 96764 | 3.3% | 5.7%(-2.42)#62 | 6.2%(-2.93)#23,429 |
| 63. | 96761 | 3.3% | 5.7%(-2.46)#63 | 6.2%(-2.97)#23,556 |
| 64. | 96826 | 3.2% | 5.7%(-2.51)#64 | 6.2%(-3.02)#23,716 |
| 65. | 96750 | 3.1% | 5.7%(-2.68)#65 | 6.2%(-3.19)#24,179 |
| 66. | 96756 | 2.9% | 5.7%(-2.83)#66 | 6.2%(-3.34)#24,554 |
| 67. | 96754 | 2.8% | 5.7%(-2.89)#67 | 6.2%(-3.40)#24,705 |
| 68. | 96762 | 2.7% | 5.7%(-3.05)#68 | 6.2%(-3.56)#25,086 |
| 69. | 96781 | 2.0% | 5.7%(-3.69)#69 | 6.2%(-4.20)#26,381 |
| 70. | 96727 | 2.0% | 5.7%(-3.69)#70 | 6.2%(-4.20)#26,386 |
| 71. | 96729 | 2.0% | 5.7%(-3.72)#71 | 6.2%(-4.23)#26,435 |
| 72. | 96705 | 1.9% | 5.7%(-3.83)#72 | 6.2%(-4.33)#26,618 |
| 73. | 96763 | 1.5% | 5.7%(-4.20)#73 | 6.2%(-4.71)#27,168 |
| 74. | 96777 | 1.5% | 5.7%(-4.25)#74 | 6.2%(-4.75)#27,222 |
| 75. | 96747 | 1.1% | 5.7%(-4.66)#75 | 6.2%(-5.17)#27,758 |
| 76. | 96728 | 0.96% | 5.7%(-4.78)#76 | 6.2%(-5.29)#27,901 |
| 77. | 96772 | 0.54% | 5.7%(-5.20)#77 | 6.2%(-5.71)#28,275 |
| 78. | 96785 | 0.41% | 5.7%(-5.32)#78 | 6.2%(-5.83)#28,349 |
1
Common Questions
What are the Top 10 Zip Codes with the Highest Percentage of Population Employed in Health Diagnosing & Treating in Hawaii?
Top 10 Zip Codes with the Highest Percentage of Population Employed in Health Diagnosing & Treating in Hawaii are:
What zip code has the Highest Percentage of Population Employed in Health Diagnosing & Treating in Hawaii?
96710 has the Highest Percentage of Population Employed in Health Diagnosing & Treating in Hawaii with 46.6%.
What is the Percentage of Population Employed in Health Diagnosing & Treating in the State of Hawaii?
Percentage of Population Employed in Health Diagnosing & Treating in Hawaii is 5.7%.
What is the Percentage of Population Employed in Health Diagnosing & Treating in the United States?
Percentage of Population Employed in Health Diagnosing & Treating in the United States is 6.2%.