Zip Codes with the Highest Percentage of Population Employed in Firefighting & Prevention in Fort Worth, TX

RELATED REPORTS & OPTIONS

Firefighting & Prevention
Population
Families and Households
Female Fertility
Female Fertility (Unmarried)
Race (Community Size)
Race (Percentage)
Ancestry (Community Size)
AfghanAfricanAlbanianAlsatianAmericanApacheArabArgentineanArmenianAustralianAustrianBahamianBangladeshiBarbadianBasqueBelgianBhutaneseBlackfeetBolivianBrazilianBritishBritish West IndianBulgarianBurmeseCajunCambodianCanadianCelticCentral AmericanCentral American IndianCherokeeCheyenneChickasawChileanChippewaChoctawColombianComancheCosta RicanCreekCroatianCrowCubanCzechCzechoslovakianDanishDelawareDominicanDutchDutch West IndianEastern EuropeanEcuadorianEgyptianEnglishEstonianEthiopianEuropeanFilipinoFinnishFrenchFrench American IndianFrench CanadianGermanGerman RussianGhanaianGreekGuamanian / ChamorroGuatemalanGuyaneseHaitianHonduranHopiHungarianIcelanderIndian (Asian)IndonesianInupiatIranianIraqiIrishIroquoisIsraeliItalianJamaicanJapaneseJordanianKenyanKiowaKoreanLaotianLatvianLebaneseLiberianLithuanianLuxembourgerMalaysianMalteseMexicanMexican American IndianMongolianMoroccanNative HawaiianNavajoNicaraguanNigerianNorthern EuropeanNorwegianOsageOttawaPakistaniPalestinianPanamanianPennsylvania GermanPeruvianPolishPortuguesePotawatomiPuebloPuerto RicanRomanianRussianSalvadoranSamoanScandinavianScotch-IrishScottishSerbianSiouxSlavicSlovakSloveneSomaliSouth AfricanSouth AmericanSouth American IndianSpaniardSpanishSpanish AmericanSpanish American IndianSri LankanSubsaharan AfricanSudaneseSwedishSwissSyrianThaiTonganTrinidadian and TobagonianTurkishUgandanUkrainianVenezuelanVietnameseWelshWest IndianYaquiYugoslavianZimbabwean
Ancestry (Percentage)
AfghanAfricanAlbanianAlsatianAmericanApacheArabArgentineanArmenianAustralianAustrianBahamianBangladeshiBarbadianBasqueBelgianBhutaneseBlackfeetBolivianBrazilianBritishBritish West IndianBulgarianBurmeseCajunCambodianCanadianCelticCentral AmericanCentral American IndianCherokeeCheyenneChickasawChileanChippewaChoctawColombianComancheCosta RicanCreekCroatianCrowCubanCzechCzechoslovakianDanishDelawareDominicanDutchDutch West IndianEastern EuropeanEcuadorianEgyptianEnglishEstonianEthiopianEuropeanFilipinoFinnishFrenchFrench American IndianFrench CanadianGermanGerman RussianGhanaianGreekGuamanian / ChamorroGuatemalanGuyaneseHaitianHonduranHopiHungarianIcelanderIndian (Asian)IndonesianInupiatIranianIraqiIrishIroquoisIsraeliItalianJamaicanJapaneseJordanianKenyanKiowaKoreanLaotianLatvianLebaneseLiberianLithuanianLuxembourgerMalaysianMalteseMexicanMexican American IndianMongolianMoroccanNative HawaiianNavajoNicaraguanNigerianNorthern EuropeanNorwegianOsageOttawaPakistaniPalestinianPanamanianPennsylvania GermanPeruvianPolishPortuguesePotawatomiPuebloPuerto RicanRomanianRussianSalvadoranSamoanScandinavianScotch-IrishScottishSerbianSiouxSlavicSlovakSloveneSomaliSouth AfricanSouth AmericanSouth American IndianSpaniardSpanishSpanish AmericanSpanish American IndianSri LankanSubsaharan AfricanSudaneseSwedishSwissSyrianThaiTonganTrinidadian and TobagonianTurkishUgandanUkrainianVenezuelanVietnameseWelshWest IndianYaquiYugoslavianZimbabwean
Immigrant Origin (Total)
AfghanistanAfricaAlbaniaArgentinaAsiaAustraliaBahamasBangladeshBarbadosBelarusBelizeBoliviaBosnia and HerzegovinaBrazilBulgariaBurma / MyanmarCambodiaCameroonCanadaCaribbeanCentral AmericaChileChinaColombiaCongoCosta RicaCroatiaCubaCzechoslovakiaDominican RepublicEastern AfricaEastern AsiaEastern EuropeEcuadorEgyptEl SalvadorEnglandEritreaEthiopiaEuropeFranceGermanyGhanaGreeceGuatemalaHaitiHondurasHong KongHungaryIndiaIndonesiaIranIraqIrelandIsraelItalyJamaicaJapanJordanKenyaKoreaLaosLatin AmericaLebanonLiberiaMalaysiaMexicoMicronesiaMiddle AfricaMoroccoNepalNetherlandsNicaraguaNigeriaNorthern AfricaNorthern EuropeOceaniaPakistanPanamaPeruPhilippinesPolandPortugalRomaniaRussiaScotlandSenegalSerbiaSomaliaSouth AfricaSouth AmericaSouth Central AsiaSouth Eastern AsiaSouthern EuropeSpainSri LankaSudanSwedenSwitzerlandSyriaTaiwanThailandTrinidad and TobagoTurkeyUgandaUkraineVenezuelaVietnamWestern AfricaWestern AsiaWestern EuropeZaireZimbabwe
Immigrant Origin (Percentage)
AfghanistanAfricaAlbaniaArgentinaAsiaAustraliaBahamasBangladeshBarbadosBelarusBelizeBoliviaBosnia and HerzegovinaBrazilBulgariaBurma / MyanmarCambodiaCameroonCanadaCaribbeanCentral AmericaChileChinaColombiaCongoCosta RicaCroatiaCubaCzechoslovakiaDominican RepublicEastern AfricaEastern AsiaEastern EuropeEcuadorEgyptEl SalvadorEnglandEritreaEthiopiaEuropeFranceGermanyGhanaGreeceGuatemalaHaitiHondurasHong KongHungaryIndiaIndonesiaIranIraqIrelandIsraelItalyJamaicaJapanJordanKenyaKoreaLaosLatin AmericaLebanonLiberiaMalaysiaMexicoMicronesiaMiddle AfricaMoroccoNepalNetherlandsNicaraguaNigeriaNorthern AfricaNorthern EuropeOceaniaPakistanPanamaPeruPhilippinesPolandPortugalRomaniaRussiaScotlandSenegalSerbiaSomaliaSouth AfricaSouth AmericaSouth Central AsiaSouth Eastern AsiaSouthern EuropeSpainSri LankaSudanSwedenSwitzerlandSyriaTaiwanThailandTrinidad and TobagoTurkeyUgandaUkraineVenezuelaVietnamWestern AfricaWestern AsiaWestern EuropeZaireZimbabwe
Income
Income (Families)
Income (Households)
Poverty
Poverty (Families)
Unemployment
Employment Occupations
Employment Industries
Employer Class
Commute Time
Commute Means
School Enrollment
Education by Degree Field
Occupancy
Finances
Physical Characteristics
Fort Worth
Compare Zip Codes
Comparison Subject

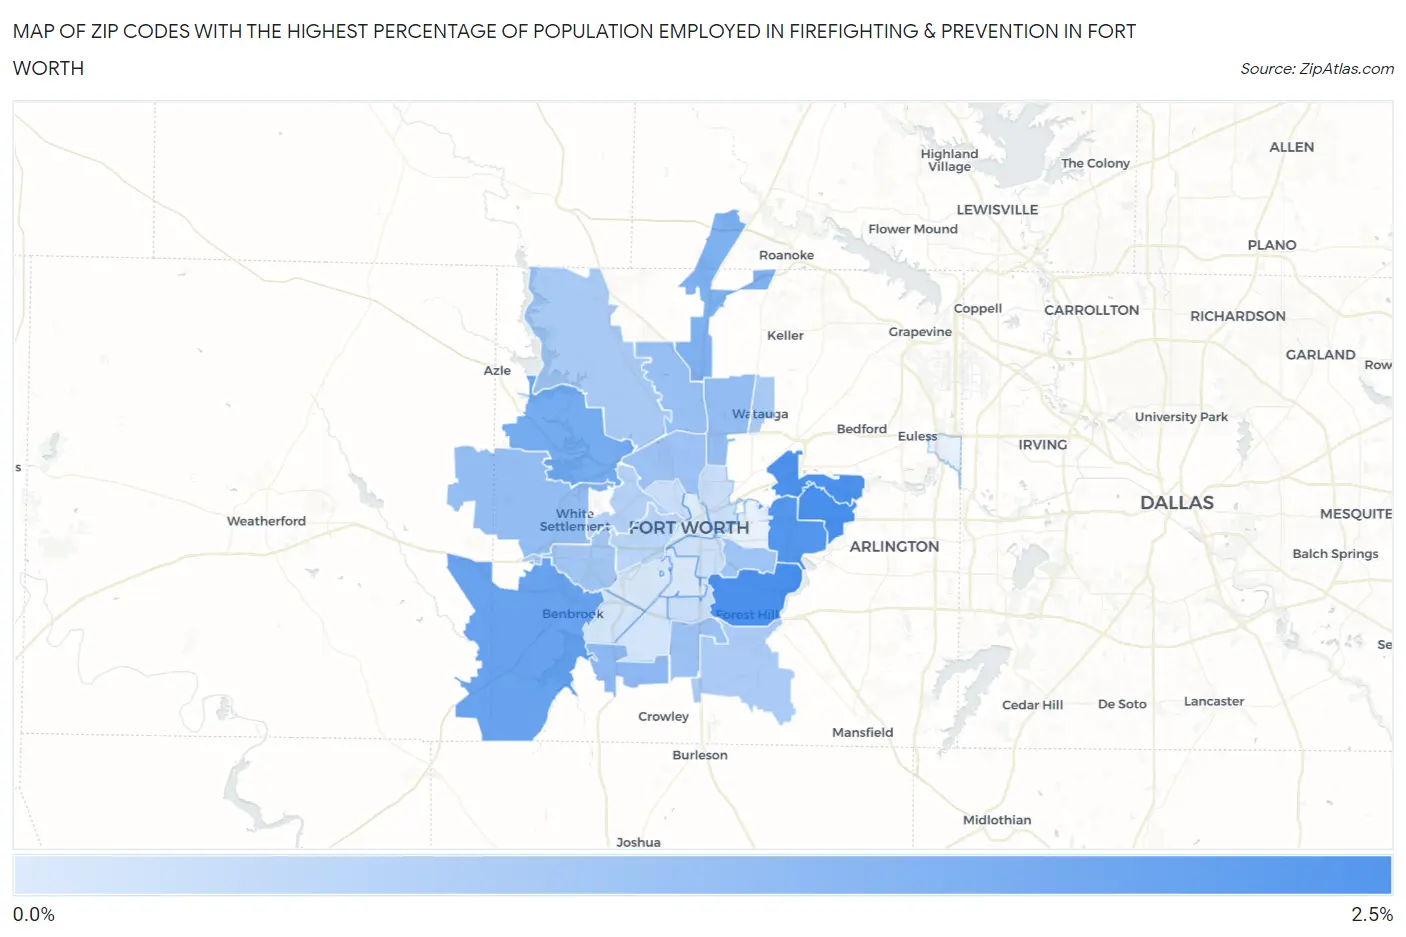
Map of Zip Codes with the Highest Percentage of Population Employed in Firefighting & Prevention in Fort Worth

0.0%
2.5%
Zip Codes with the Highest Percentage of Population Employed in Firefighting & Prevention in Fort Worth Map

Zip Codes with the Highest Percentage of Population Employed in Firefighting & Prevention in Fort Worth, TX

Zip Code % Employed vs State vs National
1.761202.0%1.1%(+0.902)#2791.2%(+0.844)#4,403
2.761192.0%1.1%(+0.874)#2821.2%(+0.816)#4,502
3.761182.0%1.1%(+0.861)#2841.2%(+0.804)#4,540
4.761121.9%1.1%(+0.774)#3091.2%(+0.716)#4,913
5.761261.7%1.1%(+0.531)#3771.2%(+0.474)#6,053
6.761351.5%1.1%(+0.390)#4331.2%(+0.332)#6,857
7.761771.4%1.1%(+0.280)#4791.2%(+0.222)#7,590
8.761231.2%1.1%(+0.110)#5701.2%(+0.052)#8,831
9.761081.2%1.1%(+0.055)#6021.2%(-0.002)#9,284
10.761371.2%1.1%(+0.040)#6101.2%(-0.017)#9,424
11.761311.1%1.1%(-0.006)#6441.2%(-0.063)#9,894
12.761061.1%1.1%(-0.039)#6601.2%(-0.097)#10,199
13.761341.1%1.1%(-0.046)#6621.2%(-0.103)#10,259
14.761051.0%1.1%(-0.097)#6881.2%(-0.154)#10,759
15.761161.00%1.1%(-0.132)#7141.2%(-0.189)#11,123
16.761790.94%1.1%(-0.183)#7491.2%(-0.241)#11,696
17.761480.93%1.1%(-0.194)#7581.2%(-0.252)#11,796
18.761400.91%1.1%(-0.218)#7731.2%(-0.275)#12,047
19.761140.82%1.1%(-0.310)#8321.2%(-0.367)#12,980
20.761070.74%1.1%(-0.389)#8881.2%(-0.447)#13,888
21.761150.58%1.1%(-0.548)#9901.2%(-0.605)#15,627
22.761110.57%1.1%(-0.555)#9961.2%(-0.612)#15,703
23.761640.56%1.1%(-0.565)#1,0041.2%(-0.622)#15,800
24.761040.53%1.1%(-0.598)#1,0311.2%(-0.655)#16,195
25.761320.46%1.1%(-0.666)#1,0811.2%(-0.723)#16,969
26.761330.46%1.1%(-0.672)#1,0841.2%(-0.730)#17,026
27.761100.41%1.1%(-0.718)#1,1111.2%(-0.775)#17,527
28.761090.41%1.1%(-0.721)#1,1141.2%(-0.778)#17,564
29.761020.35%1.1%(-0.781)#1,1451.2%(-0.838)#18,254

Common Questions

What are the Top 10 Zip Codes with the Highest Percentage of Population Employed in Firefighting & Prevention in Fort Worth, TX?
Top 10 Zip Codes with the Highest Percentage of Population Employed in Firefighting & Prevention in Fort Worth, TX are:
#1
2.0%
#2
2.0%
#3
2.0%
#4
1.9%
#5
1.7%
#6
1.5%
#7
1.4%
#8
1.2%
#9
1.2%
#10
1.2%
What zip code has the Highest Percentage of Population Employed in Firefighting & Prevention in Fort Worth, TX?
76120 has the Highest Percentage of Population Employed in Firefighting & Prevention in Fort Worth, TX with 2.0%.
What is the Percentage of Population Employed in Firefighting & Prevention in Fort Worth, TX?
Percentage of Population Employed in Firefighting & Prevention in Fort Worth is 1.1%.
What is the Percentage of Population Employed in Firefighting & Prevention in Texas?
Percentage of Population Employed in Firefighting & Prevention in Texas is 1.1%.
What is the Percentage of Population Employed in Firefighting & Prevention in the United States?
Percentage of Population Employed in Firefighting & Prevention in the United States is 1.2%.