Zip Codes with the Highest Percentage of Population Employed in Health Diagnosing & Treating in Arlington, TX
RELATED REPORTS & OPTIONS
Health Diagnosing & Treating
Arlington
Compare Zip Codes
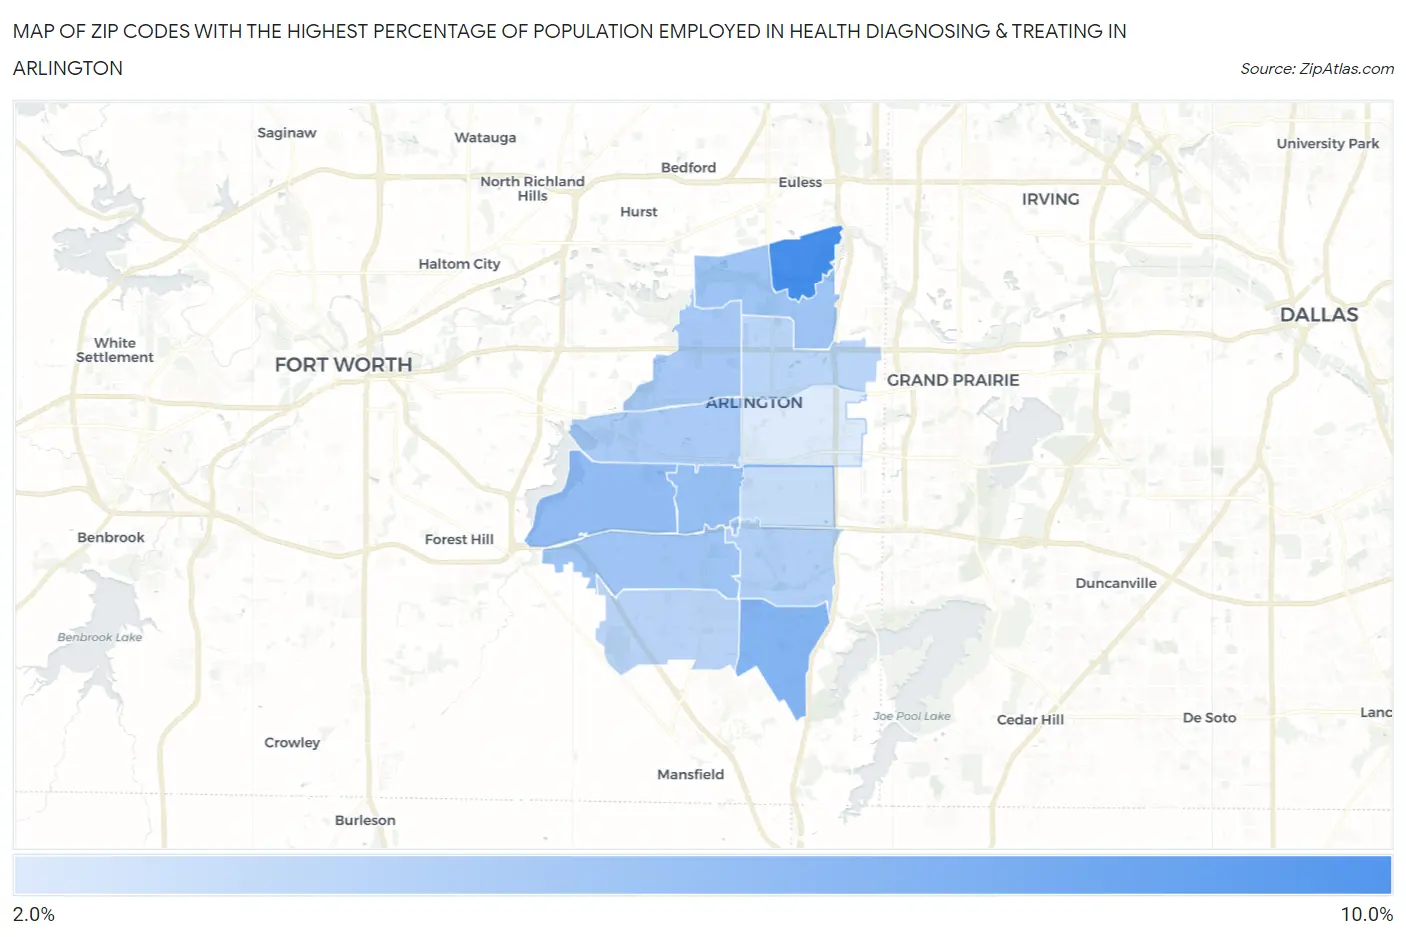
Map of Zip Codes with the Highest Percentage of Population Employed in Health Diagnosing & Treating in Arlington
0.0%
10.0%
Zip Codes with the Highest Percentage of Population Employed in Health Diagnosing & Treating in Arlington, TX
| Zip Code | % Employed | vs State | vs National | |
| 1. | 76005 | 9.6% | 5.5%(+4.05)#194 | 6.2%(+3.33)#4,435 |
| 2. | 76002 | 6.5% | 5.5%(+1.01)#507 | 6.2%(+0.287)#11,910 |
| 3. | 76016 | 5.9% | 5.5%(+0.381)#616 | 6.2%(-0.345)#14,219 |
| 4. | 76015 | 5.7% | 5.5%(+0.156)#664 | 6.2%(-0.571)#15,078 |
| 5. | 76006 | 5.2% | 5.5%(-0.337)#782 | 6.2%(-1.06)#16,996 |
| 6. | 76017 | 5.2% | 5.5%(-0.368)#791 | 6.2%(-1.09)#17,126 |
| 7. | 76012 | 4.8% | 5.5%(-0.677)#859 | 6.2%(-1.40)#18,324 |
| 8. | 76013 | 4.6% | 5.5%(-0.929)#922 | 6.2%(-1.66)#19,300 |
| 9. | 76018 | 4.2% | 5.5%(-1.27)#995 | 6.2%(-2.00)#20,542 |
| 10. | 76001 | 3.9% | 5.5%(-1.59)#1,084 | 6.2%(-2.31)#21,587 |
| 11. | 76011 | 3.9% | 5.5%(-1.65)#1,098 | 6.2%(-2.38)#21,793 |
| 12. | 76014 | 3.3% | 5.5%(-2.23)#1,227 | 6.2%(-2.96)#23,520 |
| 13. | 76010 | 2.1% | 5.5%(-3.37)#1,441 | 6.2%(-4.10)#26,215 |
1
Common Questions
What are the Top 10 Zip Codes with the Highest Percentage of Population Employed in Health Diagnosing & Treating in Arlington, TX?
Top 10 Zip Codes with the Highest Percentage of Population Employed in Health Diagnosing & Treating in Arlington, TX are:
What zip code has the Highest Percentage of Population Employed in Health Diagnosing & Treating in Arlington, TX?
76005 has the Highest Percentage of Population Employed in Health Diagnosing & Treating in Arlington, TX with 9.6%.
What is the Percentage of Population Employed in Health Diagnosing & Treating in Arlington, TX?
Percentage of Population Employed in Health Diagnosing & Treating in Arlington is 4.5%.
What is the Percentage of Population Employed in Health Diagnosing & Treating in Texas?
Percentage of Population Employed in Health Diagnosing & Treating in Texas is 5.5%.
What is the Percentage of Population Employed in Health Diagnosing & Treating in the United States?
Percentage of Population Employed in Health Diagnosing & Treating in the United States is 6.2%.