Zip Codes with the Highest Percentage of Families with Income Below $10,000 in Fort Worth, TX

RELATED REPORTS & OPTIONS

Family Income | $0-10k
Population
Families and Households
Female Fertility
Female Fertility (Unmarried)
Race (Community Size)
Race (Percentage)
Ancestry (Community Size)
AfghanAfricanAlbanianAlsatianAmericanApacheArabArgentineanArmenianAustralianAustrianBahamianBangladeshiBarbadianBasqueBelgianBhutaneseBlackfeetBolivianBrazilianBritishBritish West IndianBulgarianBurmeseCajunCambodianCanadianCelticCentral AmericanCentral American IndianCherokeeCheyenneChickasawChileanChippewaChoctawColombianComancheCosta RicanCreekCroatianCrowCubanCzechCzechoslovakianDanishDelawareDominicanDutchDutch West IndianEastern EuropeanEcuadorianEgyptianEnglishEstonianEthiopianEuropeanFilipinoFinnishFrenchFrench American IndianFrench CanadianGermanGerman RussianGhanaianGreekGuamanian / ChamorroGuatemalanGuyaneseHaitianHonduranHopiHungarianIcelanderIndian (Asian)IndonesianInupiatIranianIraqiIrishIroquoisIsraeliItalianJamaicanJapaneseJordanianKenyanKiowaKoreanLaotianLatvianLebaneseLiberianLithuanianLuxembourgerMalaysianMalteseMexicanMexican American IndianMongolianMoroccanNative HawaiianNavajoNicaraguanNigerianNorthern EuropeanNorwegianOsageOttawaPakistaniPalestinianPanamanianPennsylvania GermanPeruvianPolishPortuguesePotawatomiPuebloPuerto RicanRomanianRussianSalvadoranSamoanScandinavianScotch-IrishScottishSerbianSiouxSlavicSlovakSloveneSomaliSouth AfricanSouth AmericanSouth American IndianSpaniardSpanishSpanish AmericanSpanish American IndianSri LankanSubsaharan AfricanSudaneseSwedishSwissSyrianThaiTonganTrinidadian and TobagonianTurkishUgandanUkrainianVenezuelanVietnameseWelshWest IndianYaquiYugoslavianZimbabwean
Ancestry (Percentage)
AfghanAfricanAlbanianAlsatianAmericanApacheArabArgentineanArmenianAustralianAustrianBahamianBangladeshiBarbadianBasqueBelgianBhutaneseBlackfeetBolivianBrazilianBritishBritish West IndianBulgarianBurmeseCajunCambodianCanadianCelticCentral AmericanCentral American IndianCherokeeCheyenneChickasawChileanChippewaChoctawColombianComancheCosta RicanCreekCroatianCrowCubanCzechCzechoslovakianDanishDelawareDominicanDutchDutch West IndianEastern EuropeanEcuadorianEgyptianEnglishEstonianEthiopianEuropeanFilipinoFinnishFrenchFrench American IndianFrench CanadianGermanGerman RussianGhanaianGreekGuamanian / ChamorroGuatemalanGuyaneseHaitianHonduranHopiHungarianIcelanderIndian (Asian)IndonesianInupiatIranianIraqiIrishIroquoisIsraeliItalianJamaicanJapaneseJordanianKenyanKiowaKoreanLaotianLatvianLebaneseLiberianLithuanianLuxembourgerMalaysianMalteseMexicanMexican American IndianMongolianMoroccanNative HawaiianNavajoNicaraguanNigerianNorthern EuropeanNorwegianOsageOttawaPakistaniPalestinianPanamanianPennsylvania GermanPeruvianPolishPortuguesePotawatomiPuebloPuerto RicanRomanianRussianSalvadoranSamoanScandinavianScotch-IrishScottishSerbianSiouxSlavicSlovakSloveneSomaliSouth AfricanSouth AmericanSouth American IndianSpaniardSpanishSpanish AmericanSpanish American IndianSri LankanSubsaharan AfricanSudaneseSwedishSwissSyrianThaiTonganTrinidadian and TobagonianTurkishUgandanUkrainianVenezuelanVietnameseWelshWest IndianYaquiYugoslavianZimbabwean
Immigrant Origin (Total)
AfghanistanAfricaAlbaniaArgentinaAsiaAustraliaBahamasBangladeshBarbadosBelarusBelizeBoliviaBosnia and HerzegovinaBrazilBulgariaBurma / MyanmarCambodiaCameroonCanadaCaribbeanCentral AmericaChileChinaColombiaCongoCosta RicaCroatiaCubaCzechoslovakiaDominican RepublicEastern AfricaEastern AsiaEastern EuropeEcuadorEgyptEl SalvadorEnglandEritreaEthiopiaEuropeFranceGermanyGhanaGreeceGuatemalaHaitiHondurasHong KongHungaryIndiaIndonesiaIranIraqIrelandIsraelItalyJamaicaJapanJordanKenyaKoreaLaosLatin AmericaLebanonLiberiaMalaysiaMexicoMicronesiaMiddle AfricaMoroccoNepalNetherlandsNicaraguaNigeriaNorthern AfricaNorthern EuropeOceaniaPakistanPanamaPeruPhilippinesPolandPortugalRomaniaRussiaScotlandSenegalSerbiaSomaliaSouth AfricaSouth AmericaSouth Central AsiaSouth Eastern AsiaSouthern EuropeSpainSri LankaSudanSwedenSwitzerlandSyriaTaiwanThailandTrinidad and TobagoTurkeyUgandaUkraineVenezuelaVietnamWestern AfricaWestern AsiaWestern EuropeZaireZimbabwe
Immigrant Origin (Percentage)
AfghanistanAfricaAlbaniaArgentinaAsiaAustraliaBahamasBangladeshBarbadosBelarusBelizeBoliviaBosnia and HerzegovinaBrazilBulgariaBurma / MyanmarCambodiaCameroonCanadaCaribbeanCentral AmericaChileChinaColombiaCongoCosta RicaCroatiaCubaCzechoslovakiaDominican RepublicEastern AfricaEastern AsiaEastern EuropeEcuadorEgyptEl SalvadorEnglandEritreaEthiopiaEuropeFranceGermanyGhanaGreeceGuatemalaHaitiHondurasHong KongHungaryIndiaIndonesiaIranIraqIrelandIsraelItalyJamaicaJapanJordanKenyaKoreaLaosLatin AmericaLebanonLiberiaMalaysiaMexicoMicronesiaMiddle AfricaMoroccoNepalNetherlandsNicaraguaNigeriaNorthern AfricaNorthern EuropeOceaniaPakistanPanamaPeruPhilippinesPolandPortugalRomaniaRussiaScotlandSenegalSerbiaSomaliaSouth AfricaSouth AmericaSouth Central AsiaSouth Eastern AsiaSouthern EuropeSpainSri LankaSudanSwedenSwitzerlandSyriaTaiwanThailandTrinidad and TobagoTurkeyUgandaUkraineVenezuelaVietnamWestern AfricaWestern AsiaWestern EuropeZaireZimbabwe
Income
Income (Families)
Income (Households)
Poverty
Poverty (Families)
Unemployment
Employment Occupations
Employment Industries
Employer Class
Commute Time
Commute Means
School Enrollment
Education by Degree Field
Occupancy
Finances
Physical Characteristics
Fort Worth
Compare Zip Codes
Comparison Subject

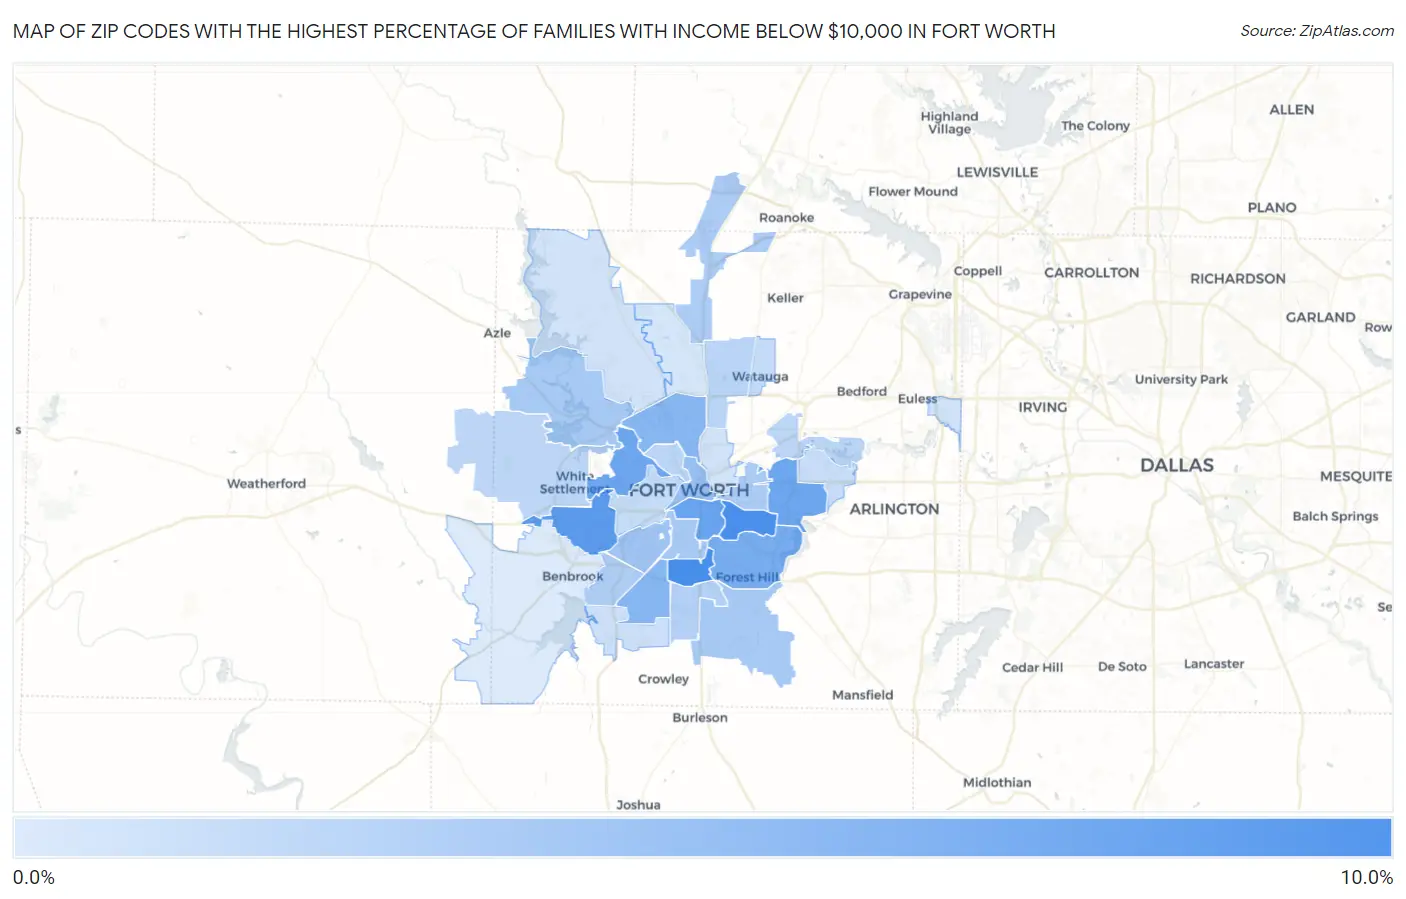
Map of Zip Codes with the Highest Percentage of Families with Income Below $10,000 in Fort Worth

0.0%
10.0%
Zip Codes with the Highest Percentage of Families with Income Below $10,000 in Fort Worth Map

Zip Codes with the Highest Percentage of Families with Income Below $10,000 in Fort Worth, TX

Zip Code Families with Income < $10k vs State vs National
1.761158.1%3.5%(+4.60)#1653.1%(+5.00)#2,906
2.761058.0%3.5%(+4.50)#1733.1%(+4.90)#2,954
3.761167.0%3.5%(+3.50)#2123.1%(+3.90)#3,623
4.761046.4%3.5%(+2.90)#2583.1%(+3.30)#4,223
5.761126.1%3.5%(+2.60)#2913.1%(+3.00)#4,524
6.761146.1%3.5%(+2.60)#2943.1%(+3.00)#4,536
7.761195.6%3.5%(+2.10)#3533.1%(+2.50)#5,145
8.761064.9%3.5%(+1.40)#4483.1%(+1.80)#6,257
9.761334.8%3.5%(+1.30)#4583.1%(+1.70)#6,415
10.761024.1%3.5%(+0.600)#5813.1%(+1.000)#7,958
11.761093.6%3.5%(+0.100)#6503.1%(+0.500)#9,258
12.761103.3%3.5%(-0.200)#7083.1%(+0.200)#10,136
13.761403.3%3.5%(-0.200)#7093.1%(+0.200)#10,139
14.761353.3%3.5%(-0.200)#7133.1%(+0.200)#10,179
15.761773.0%3.5%(-0.500)#7793.1%(-0.100)#11,166
16.761033.0%3.5%(-0.500)#7813.1%(-0.100)#11,180
17.761322.9%3.5%(-0.600)#8053.1%(-0.200)#11,505
18.761342.7%3.5%(-0.800)#8503.1%(-0.400)#12,285
19.761372.4%3.5%(-1.10)#9203.1%(-0.700)#13,422
20.761642.4%3.5%(-1.10)#9303.1%(-0.700)#13,579
21.761082.3%3.5%(-1.20)#9473.1%(-0.800)#13,894
22.761182.2%3.5%(-1.30)#9853.1%(-0.900)#14,446
23.761071.8%3.5%(-1.70)#1,0903.1%(-1.30)#16,285
24.761481.8%3.5%(-1.70)#1,0923.1%(-1.30)#16,316
25.761201.7%3.5%(-1.80)#1,1243.1%(-1.40)#16,820
26.761231.5%3.5%(-2.00)#1,1773.1%(-1.60)#17,691
27.761791.3%3.5%(-2.20)#1,2243.1%(-1.80)#18,656
28.761111.3%3.5%(-2.20)#1,2353.1%(-1.80)#18,800
29.761551.2%3.5%(-2.30)#1,2783.1%(-1.90)#19,459
30.761311.0%3.5%(-2.50)#1,3193.1%(-2.10)#20,196
31.761260.70%3.5%(-2.80)#1,3833.1%(-2.40)#21,706

Common Questions

What are the Top 10 Zip Codes with the Highest Percentage of Families with Income Below $10,000 in Fort Worth, TX?
Top 10 Zip Codes with the Highest Percentage of Families with Income Below $10,000 in Fort Worth, TX are:
#1
8.1%
#2
8.0%
#3
7.0%
#4
6.4%
#5
6.1%
#6
6.1%
#7
5.6%
#8
4.9%
#9
4.8%
#10
4.1%
What zip code has the Highest Percentage of Families with Income Below $10,000 in Fort Worth, TX?
76115 has the Highest Percentage of Families with Income Below $10,000 in Fort Worth, TX with 8.1%.
What is the Percentage of Families with Income Below $10,000 in Fort Worth, TX?
Percentage of Families with Income Below $10,000 in Fort Worth is 3.2%.
What is the Percentage of Families with Income Below $10,000 in Texas?
Percentage of Families with Income Below $10,000 in Texas is 3.5%.
What is the Percentage of Families with Income Below $10,000 in the United States?
Percentage of Families with Income Below $10,000 in the United States is 3.1%.