Zip Codes with the Highest Percentage of Population Employed in Health Diagnosing & Treating in Amarillo, TX
RELATED REPORTS & OPTIONS
Health Diagnosing & Treating
Amarillo
Compare Zip Codes
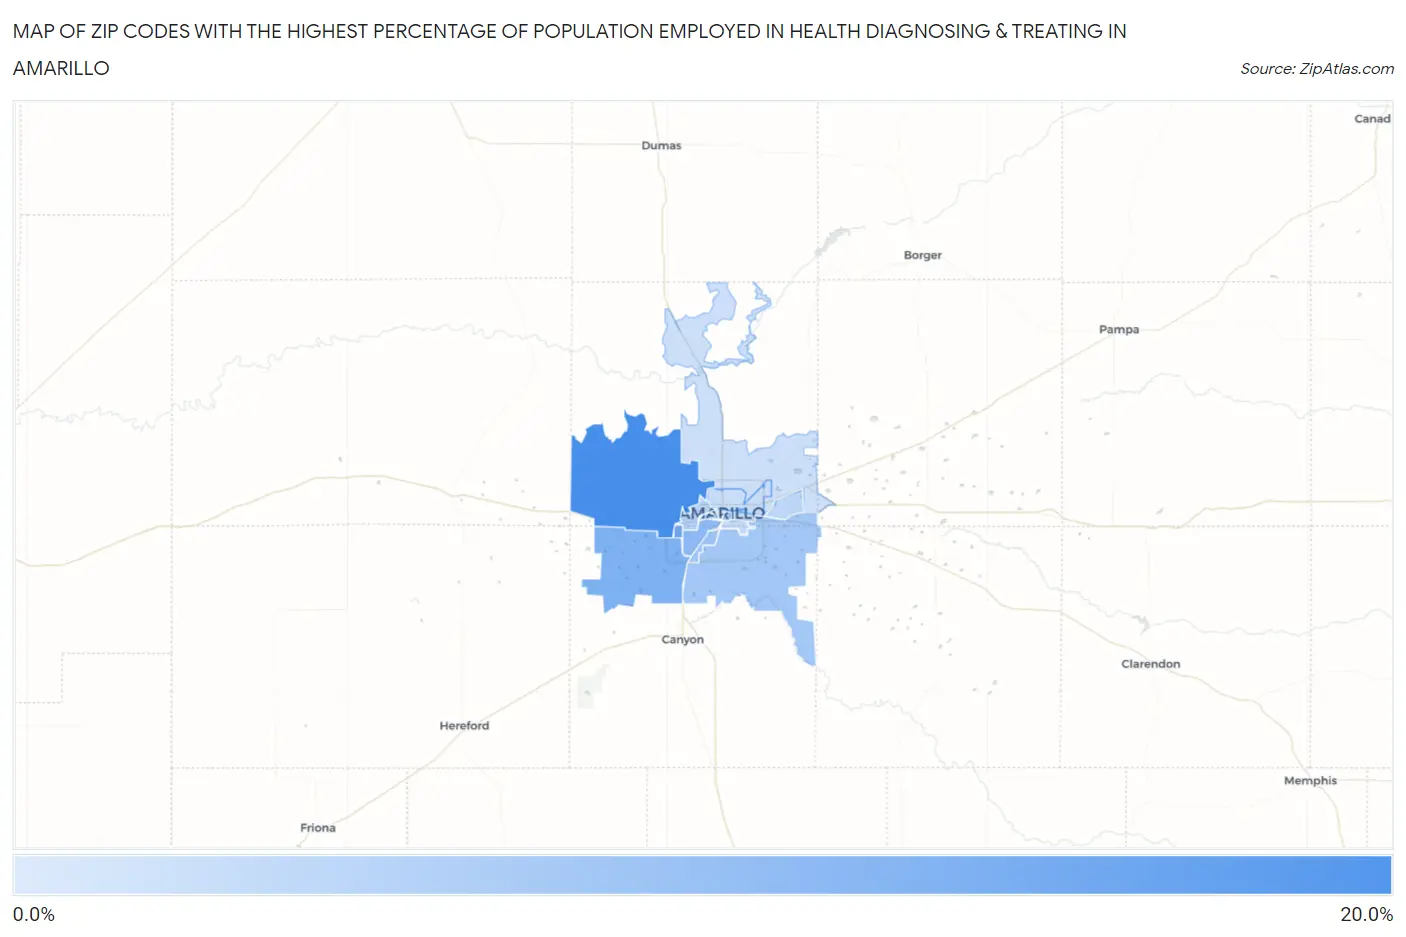
Map of Zip Codes with the Highest Percentage of Population Employed in Health Diagnosing & Treating in Amarillo
0.0%
20.0%
Zip Codes with the Highest Percentage of Population Employed in Health Diagnosing & Treating in Amarillo, TX
| Zip Code | % Employed | vs State | vs National | |
| 1. | 79124 | 16.6% | 5.5%(+11.1)#44 | 6.2%(+10.4)#869 |
| 2. | 79121 | 12.3% | 5.5%(+6.74)#96 | 6.2%(+6.02)#2,078 |
| 3. | 79119 | 10.7% | 5.5%(+5.16)#134 | 6.2%(+4.43)#3,154 |
| 4. | 79109 | 9.0% | 5.5%(+3.51)#219 | 6.2%(+2.78)#5,338 |
| 5. | 79110 | 7.7% | 5.5%(+2.17)#357 | 6.2%(+1.45)#8,279 |
| 6. | 79118 | 6.8% | 5.5%(+1.33)#466 | 6.2%(+0.600)#10,861 |
| 7. | 79102 | 5.5% | 5.5%(-0.050)#719 | 6.2%(-0.776)#15,897 |
| 8. | 79106 | 5.1% | 5.5%(-0.454)#809 | 6.2%(-1.18)#17,437 |
| 9. | 79111 | 4.2% | 5.5%(-1.36)#1,026 | 6.2%(-2.09)#20,878 |
| 10. | 79103 | 3.6% | 5.5%(-1.87)#1,145 | 6.2%(-2.60)#22,461 |
| 11. | 79104 | 3.2% | 5.5%(-2.32)#1,249 | 6.2%(-3.05)#23,794 |
| 12. | 79107 | 3.0% | 5.5%(-2.49)#1,291 | 6.2%(-3.22)#24,243 |
| 13. | 79108 | 2.6% | 5.5%(-2.95)#1,373 | 6.2%(-3.68)#25,356 |
| 14. | 79101 | 1.1% | 5.5%(-4.41)#1,584 | 6.2%(-5.14)#27,712 |
1
Common Questions
What are the Top 10 Zip Codes with the Highest Percentage of Population Employed in Health Diagnosing & Treating in Amarillo, TX?
Top 10 Zip Codes with the Highest Percentage of Population Employed in Health Diagnosing & Treating in Amarillo, TX are:
What zip code has the Highest Percentage of Population Employed in Health Diagnosing & Treating in Amarillo, TX?
79124 has the Highest Percentage of Population Employed in Health Diagnosing & Treating in Amarillo, TX with 16.6%.
What is the Percentage of Population Employed in Health Diagnosing & Treating in Amarillo, TX?
Percentage of Population Employed in Health Diagnosing & Treating in Amarillo is 7.1%.
What is the Percentage of Population Employed in Health Diagnosing & Treating in Texas?
Percentage of Population Employed in Health Diagnosing & Treating in Texas is 5.5%.
What is the Percentage of Population Employed in Health Diagnosing & Treating in the United States?
Percentage of Population Employed in Health Diagnosing & Treating in the United States is 6.2%.