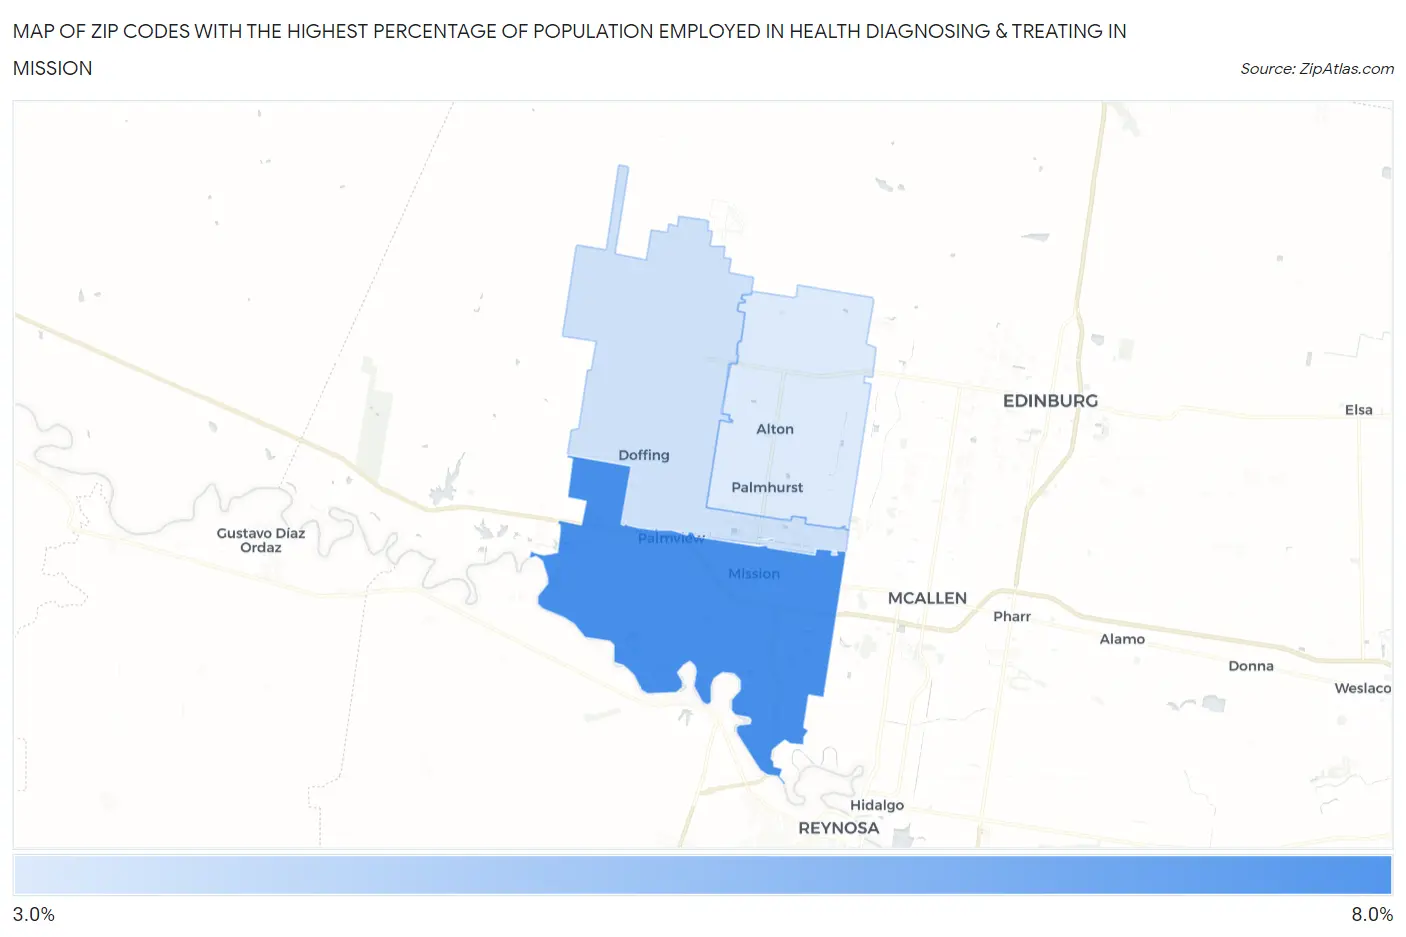
Zip Codes with the Highest Percentage of Population Employed in Health Diagnosing & Treating in Mission, TX
RELATED REPORTS & OPTIONS
Health Diagnosing & Treating
Mission
Compare Zip Codes
Map of Zip Codes with the Highest Percentage of Population Employed in Health Diagnosing & Treating in Mission
0.0%
8.0%
Zip Codes with the Highest Percentage of Population Employed in Health Diagnosing & Treating in Mission, TX
| Zip Code | % Employed | vs State | vs National | |
| 1. | 78572 | 6.2% | 5.5%(+0.717)#555 | 6.2%(-0.009)#13,017 |
| 2. | 78574 | 3.9% | 5.5%(-1.63)#1,093 | 6.2%(-2.36)#21,724 |
| 3. | 78573 | 3.7% | 5.5%(-1.87)#1,144 | 6.2%(-2.59)#22,456 |
1
Common Questions
What are the Top Zip Codes with the Highest Percentage of Population Employed in Health Diagnosing & Treating in Mission, TX?
Top Zip Codes with the Highest Percentage of Population Employed in Health Diagnosing & Treating in Mission, TX are:
What zip code has the Highest Percentage of Population Employed in Health Diagnosing & Treating in Mission, TX?
78572 has the Highest Percentage of Population Employed in Health Diagnosing & Treating in Mission, TX with 6.2%.
What is the Percentage of Population Employed in Health Diagnosing & Treating in Mission, TX?
Percentage of Population Employed in Health Diagnosing & Treating in Mission is 6.7%.
What is the Percentage of Population Employed in Health Diagnosing & Treating in Texas?
Percentage of Population Employed in Health Diagnosing & Treating in Texas is 5.5%.
What is the Percentage of Population Employed in Health Diagnosing & Treating in the United States?
Percentage of Population Employed in Health Diagnosing & Treating in the United States is 6.2%.