Zip Codes with the Highest Percentage of Population Employed in Health Diagnosing & Treating in Waxahachie, TX
RELATED REPORTS & OPTIONS
Health Diagnosing & Treating
Waxahachie
Compare Zip Codes
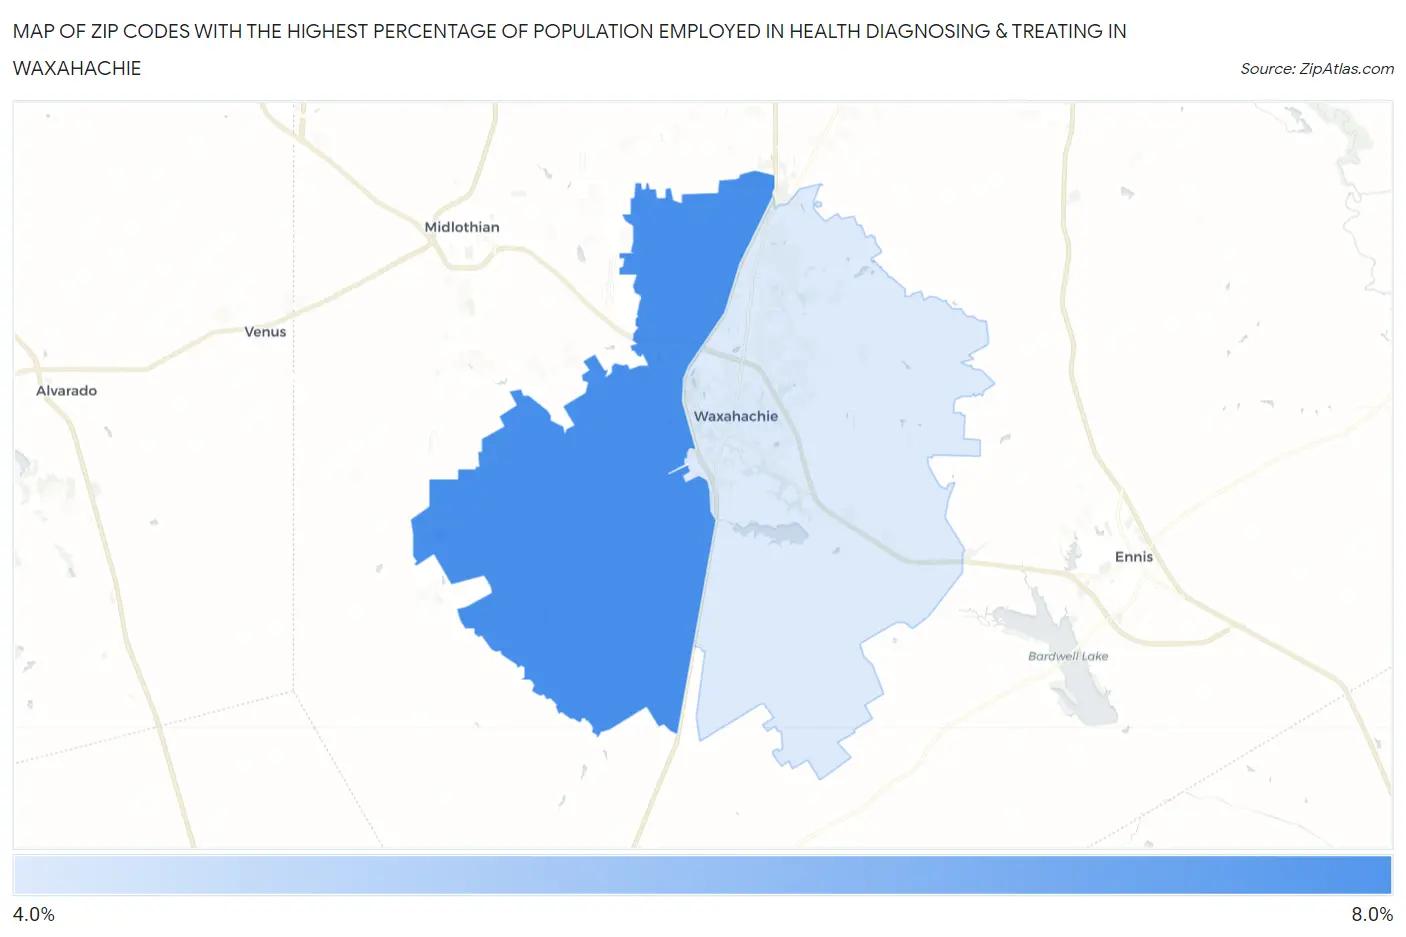
Map of Zip Codes with the Highest Percentage of Population Employed in Health Diagnosing & Treating in Waxahachie
0.0%
8.0%
Zip Codes with the Highest Percentage of Population Employed in Health Diagnosing & Treating in Waxahachie, TX
| Zip Code | % Employed | vs State | vs National | |
| 1. | 75167 | 6.4% | 5.5%(+0.878)#524 | 6.2%(+0.152)#12,392 |
| 2. | 75165 | 4.9% | 5.5%(-0.632)#852 | 6.2%(-1.36)#18,150 |
1
Common Questions
What are the Top Zip Codes with the Highest Percentage of Population Employed in Health Diagnosing & Treating in Waxahachie, TX?
Top Zip Codes with the Highest Percentage of Population Employed in Health Diagnosing & Treating in Waxahachie, TX are:
What zip code has the Highest Percentage of Population Employed in Health Diagnosing & Treating in Waxahachie, TX?
75167 has the Highest Percentage of Population Employed in Health Diagnosing & Treating in Waxahachie, TX with 6.4%.
What is the Percentage of Population Employed in Health Diagnosing & Treating in Waxahachie, TX?
Percentage of Population Employed in Health Diagnosing & Treating in Waxahachie is 5.1%.
What is the Percentage of Population Employed in Health Diagnosing & Treating in Texas?
Percentage of Population Employed in Health Diagnosing & Treating in Texas is 5.5%.
What is the Percentage of Population Employed in Health Diagnosing & Treating in the United States?
Percentage of Population Employed in Health Diagnosing & Treating in the United States is 6.2%.