Zip Codes with the Highest Percentage of Population Employed in Food Preparation & Serving in Fort Worth, TX
RELATED REPORTS & OPTIONS
Food Preparation & Serving
Fort Worth
Compare Zip Codes
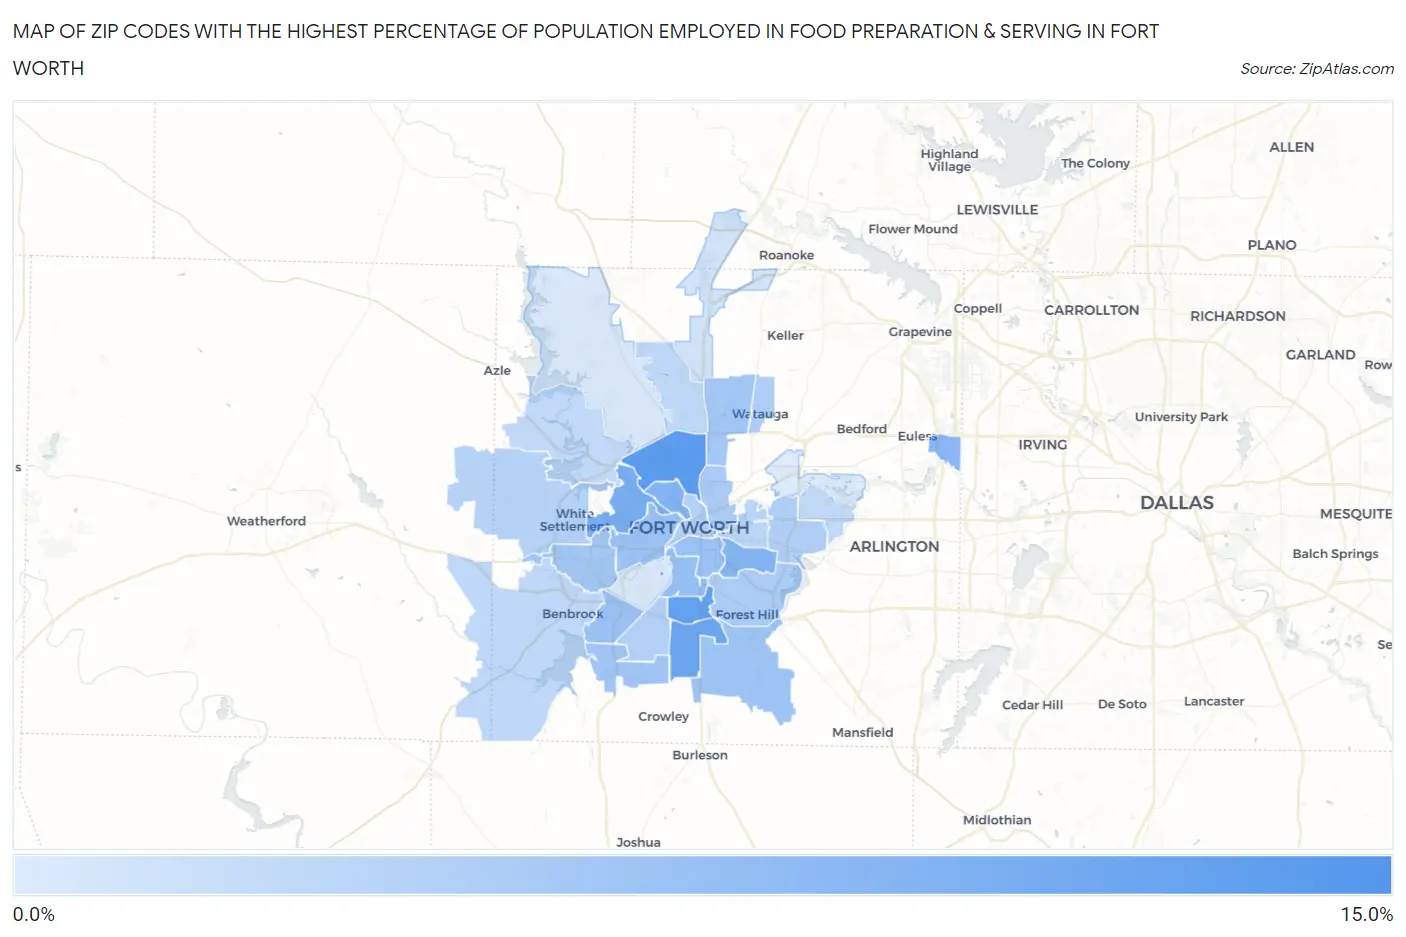
Map of Zip Codes with the Highest Percentage of Population Employed in Food Preparation & Serving in Fort Worth
0.0%
15.0%
Zip Codes with the Highest Percentage of Population Employed in Food Preparation & Serving in Fort Worth, TX
| Zip Code | % Employed | vs State | vs National | |
| 1. | 76129 | 10.9% | 5.4%(+5.58)#112 | 5.3%(+5.65)#2,087 |
| 2. | 76106 | 9.8% | 5.4%(+4.46)#152 | 5.3%(+4.52)#2,791 |
| 3. | 76115 | 9.3% | 5.4%(+3.91)#180 | 5.3%(+3.98)#3,267 |
| 4. | 76134 | 8.8% | 5.4%(+3.43)#217 | 5.3%(+3.49)#3,749 |
| 5. | 76114 | 8.1% | 5.4%(+2.75)#281 | 5.3%(+2.81)#4,573 |
| 6. | 76164 | 7.5% | 5.4%(+2.16)#341 | 5.3%(+2.23)#5,527 |
| 7. | 76105 | 7.4% | 5.4%(+2.03)#366 | 5.3%(+2.10)#5,780 |
| 8. | 76155 | 7.0% | 5.4%(+1.70)#406 | 5.3%(+1.76)#6,442 |
| 9. | 76110 | 6.4% | 5.4%(+1.05)#502 | 5.3%(+1.11)#8,147 |
| 10. | 76104 | 6.2% | 5.4%(+0.833)#528 | 5.3%(+0.898)#8,783 |
| 11. | 76132 | 6.2% | 5.4%(+0.819)#529 | 5.3%(+0.884)#8,820 |
| 12. | 76107 | 6.1% | 5.4%(+0.743)#546 | 5.3%(+0.808)#9,051 |
| 13. | 76140 | 5.8% | 5.4%(+0.488)#595 | 5.3%(+0.553)#9,902 |
| 14. | 76123 | 5.7% | 5.4%(+0.342)#624 | 5.3%(+0.407)#10,373 |
| 15. | 76137 | 5.6% | 5.4%(+0.264)#644 | 5.3%(+0.329)#10,657 |
| 16. | 76116 | 5.6% | 5.4%(+0.215)#654 | 5.3%(+0.280)#10,827 |
| 17. | 76111 | 5.2% | 5.4%(-0.144)#750 | 5.3%(-0.079)#12,108 |
| 18. | 76119 | 5.1% | 5.4%(-0.283)#791 | 5.3%(-0.218)#12,656 |
| 19. | 76148 | 4.9% | 5.4%(-0.423)#826 | 5.3%(-0.358)#13,233 |
| 20. | 76112 | 4.9% | 5.4%(-0.496)#842 | 5.3%(-0.431)#13,536 |
| 21. | 76133 | 4.8% | 5.4%(-0.587)#861 | 5.3%(-0.521)#13,890 |
| 22. | 76102 | 4.7% | 5.4%(-0.678)#887 | 5.3%(-0.613)#14,274 |
| 23. | 76108 | 4.5% | 5.4%(-0.824)#922 | 5.3%(-0.759)#14,909 |
| 24. | 76103 | 4.3% | 5.4%(-1.06)#968 | 5.3%(-0.995)#15,921 |
| 25. | 76131 | 4.1% | 5.4%(-1.23)#1,011 | 5.3%(-1.17)#16,638 |
| 26. | 76126 | 4.1% | 5.4%(-1.28)#1,029 | 5.3%(-1.22)#16,854 |
| 27. | 76135 | 4.0% | 5.4%(-1.39)#1,048 | 5.3%(-1.32)#17,258 |
| 28. | 76120 | 3.9% | 5.4%(-1.43)#1,062 | 5.3%(-1.37)#17,463 |
| 29. | 76177 | 3.0% | 5.4%(-2.32)#1,262 | 5.3%(-2.25)#21,119 |
| 30. | 76179 | 2.6% | 5.4%(-2.74)#1,342 | 5.3%(-2.67)#22,724 |
| 31. | 76109 | 2.6% | 5.4%(-2.77)#1,348 | 5.3%(-2.71)#22,866 |
| 32. | 76118 | 2.4% | 5.4%(-2.93)#1,371 | 5.3%(-2.86)#23,400 |
1
Common Questions
What are the Top 10 Zip Codes with the Highest Percentage of Population Employed in Food Preparation & Serving in Fort Worth, TX?
Top 10 Zip Codes with the Highest Percentage of Population Employed in Food Preparation & Serving in Fort Worth, TX are:
What zip code has the Highest Percentage of Population Employed in Food Preparation & Serving in Fort Worth, TX?
76129 has the Highest Percentage of Population Employed in Food Preparation & Serving in Fort Worth, TX with 10.9%.
What is the Percentage of Population Employed in Food Preparation & Serving in Fort Worth, TX?
Percentage of Population Employed in Food Preparation & Serving in Fort Worth is 5.2%.
What is the Percentage of Population Employed in Food Preparation & Serving in Texas?
Percentage of Population Employed in Food Preparation & Serving in Texas is 5.4%.
What is the Percentage of Population Employed in Food Preparation & Serving in the United States?
Percentage of Population Employed in Food Preparation & Serving in the United States is 5.3%.