Zip Codes with the Highest Percentage of Population Employed in Health Diagnosing & Treating in Georgetown, TX
RELATED REPORTS & OPTIONS
Health Diagnosing & Treating
Georgetown
Compare Zip Codes
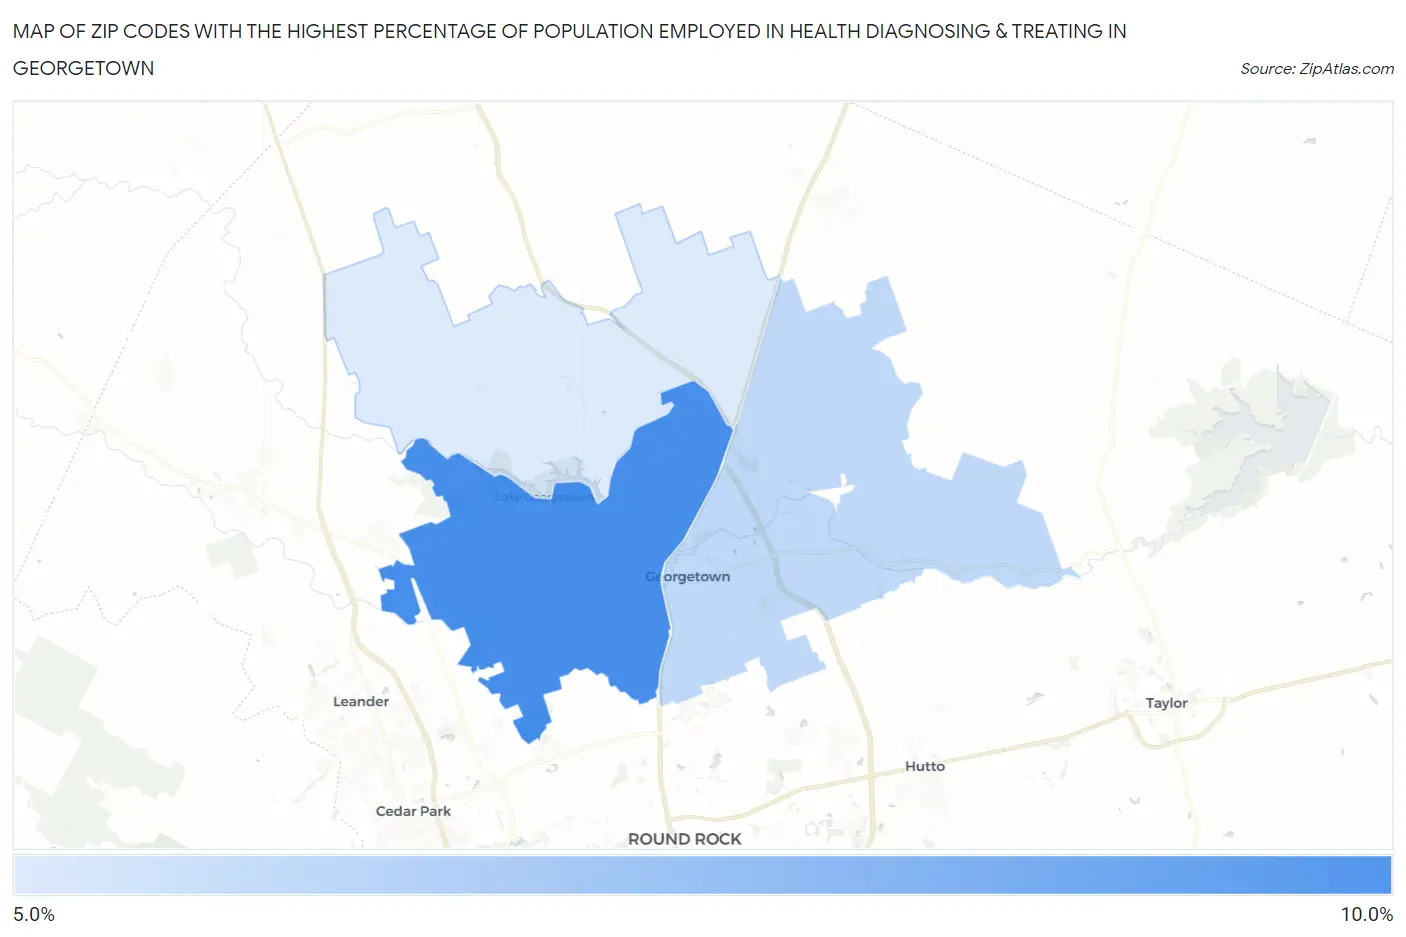
Map of Zip Codes with the Highest Percentage of Population Employed in Health Diagnosing & Treating in Georgetown
0.0%
10.0%
Zip Codes with the Highest Percentage of Population Employed in Health Diagnosing & Treating in Georgetown, TX
| Zip Code | % Employed | vs State | vs National | |
| 1. | 78628 | 9.7% | 5.5%(+4.16)#182 | 6.2%(+3.43)#4,280 |
| 2. | 78626 | 6.5% | 5.5%(+0.980)#508 | 6.2%(+0.254)#12,038 |
| 3. | 78633 | 5.7% | 5.5%(+0.210)#651 | 6.2%(-0.516)#14,878 |
1
Common Questions
What are the Top Zip Codes with the Highest Percentage of Population Employed in Health Diagnosing & Treating in Georgetown, TX?
Top Zip Codes with the Highest Percentage of Population Employed in Health Diagnosing & Treating in Georgetown, TX are:
What zip code has the Highest Percentage of Population Employed in Health Diagnosing & Treating in Georgetown, TX?
78628 has the Highest Percentage of Population Employed in Health Diagnosing & Treating in Georgetown, TX with 9.7%.
What is the Percentage of Population Employed in Health Diagnosing & Treating in Georgetown, TX?
Percentage of Population Employed in Health Diagnosing & Treating in Georgetown is 6.5%.
What is the Percentage of Population Employed in Health Diagnosing & Treating in Texas?
Percentage of Population Employed in Health Diagnosing & Treating in Texas is 5.5%.
What is the Percentage of Population Employed in Health Diagnosing & Treating in the United States?
Percentage of Population Employed in Health Diagnosing & Treating in the United States is 6.2%.