Zip Codes with the Highest Percentage of Population Employed in Computer, Engineering & Science in Fort Worth, TX
RELATED REPORTS & OPTIONS
Computer, Engineering & Science
Fort Worth
Compare Zip Codes
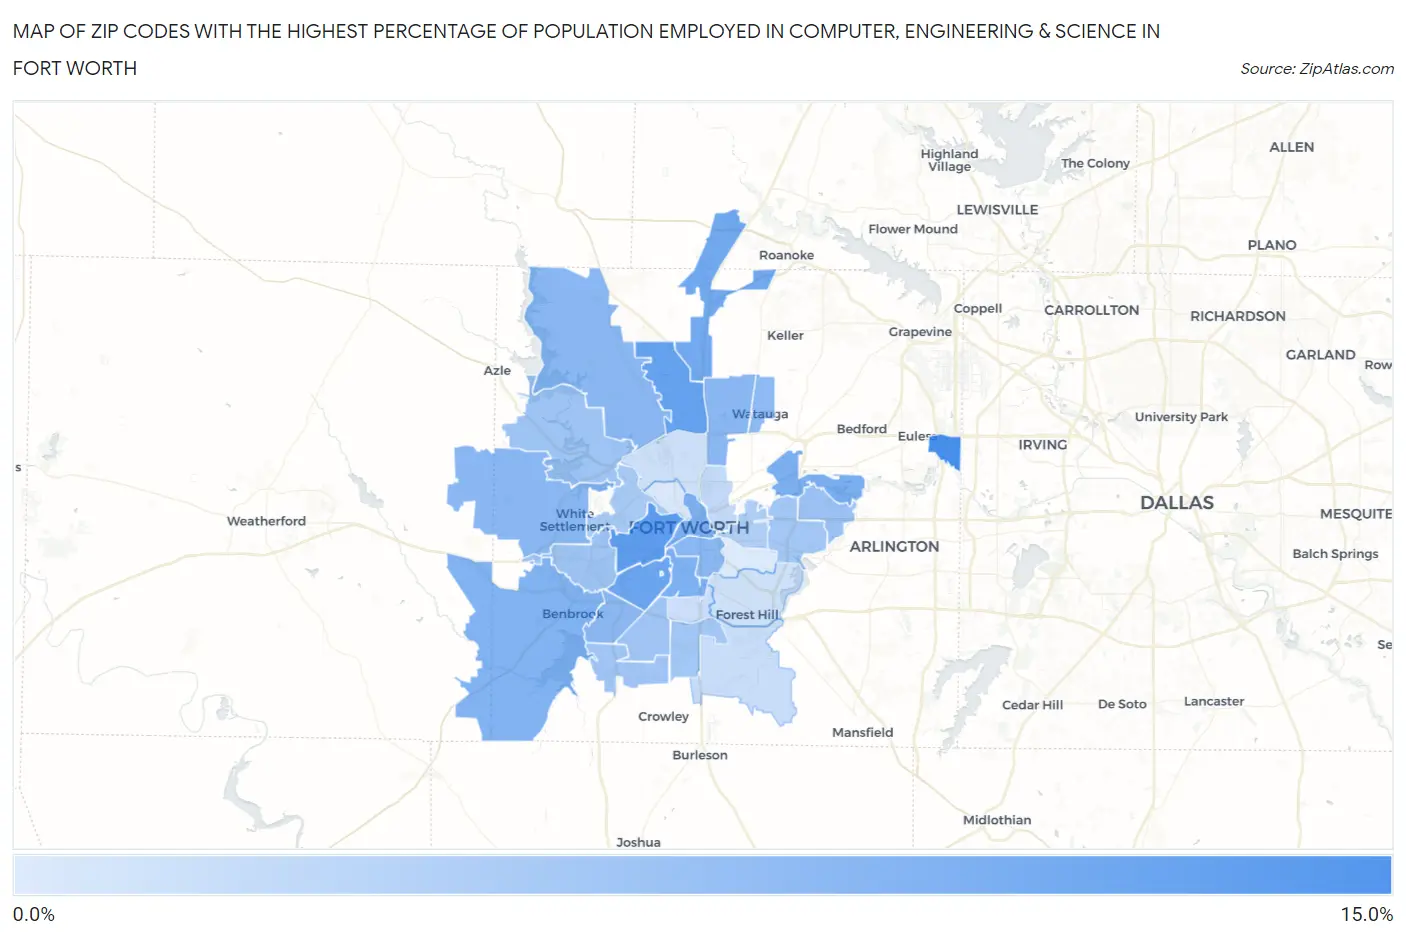
Map of Zip Codes with the Highest Percentage of Population Employed in Computer, Engineering & Science in Fort Worth
0.0%
15.0%
Zip Codes with the Highest Percentage of Population Employed in Computer, Engineering & Science in Fort Worth, TX
| Zip Code | % Employed | vs State | vs National | |
| 1. | 76155 | 10.7% | 6.5%(+4.22)#159 | 6.8%(+3.96)#2,717 |
| 2. | 76107 | 9.1% | 6.5%(+2.64)#218 | 6.8%(+2.37)#3,927 |
| 3. | 76131 | 8.6% | 6.5%(+2.07)#242 | 6.8%(+1.81)#4,524 |
| 4. | 76109 | 8.2% | 6.5%(+1.68)#271 | 6.8%(+1.41)#5,029 |
| 5. | 76177 | 7.7% | 6.5%(+1.17)#304 | 6.8%(+0.903)#5,728 |
| 6. | 76118 | 7.1% | 6.5%(+0.636)#347 | 6.8%(+0.372)#6,574 |
| 7. | 76102 | 7.1% | 6.5%(+0.607)#348 | 6.8%(+0.342)#6,623 |
| 8. | 76110 | 6.9% | 6.5%(+0.366)#369 | 6.8%(+0.102)#7,032 |
| 9. | 76126 | 6.8% | 6.5%(+0.251)#381 | 6.8%(-0.013)#7,242 |
| 10. | 76108 | 6.2% | 6.5%(-0.283)#439 | 6.8%(-0.547)#8,304 |
| 11. | 76104 | 6.1% | 6.5%(-0.355)#442 | 6.8%(-0.619)#8,475 |
| 12. | 76137 | 6.1% | 6.5%(-0.365)#443 | 6.8%(-0.629)#8,497 |
| 13. | 76179 | 6.1% | 6.5%(-0.397)#444 | 6.8%(-0.662)#8,589 |
| 14. | 76132 | 6.0% | 6.5%(-0.473)#456 | 6.8%(-0.737)#8,768 |
| 15. | 76148 | 5.8% | 6.5%(-0.724)#482 | 6.8%(-0.988)#9,354 |
| 16. | 76120 | 4.9% | 6.5%(-1.58)#594 | 6.8%(-1.84)#11,600 |
| 17. | 76135 | 4.8% | 6.5%(-1.66)#605 | 6.8%(-1.92)#11,825 |
| 18. | 76116 | 4.8% | 6.5%(-1.67)#607 | 6.8%(-1.94)#11,872 |
| 19. | 76123 | 4.7% | 6.5%(-1.82)#624 | 6.8%(-2.09)#12,273 |
| 20. | 76133 | 4.6% | 6.5%(-1.91)#630 | 6.8%(-2.18)#12,538 |
| 21. | 76112 | 4.5% | 6.5%(-1.96)#638 | 6.8%(-2.22)#12,697 |
| 22. | 76134 | 4.4% | 6.5%(-2.09)#666 | 6.8%(-2.36)#13,134 |
| 23. | 76114 | 4.1% | 6.5%(-2.38)#713 | 6.8%(-2.65)#14,106 |
| 24. | 76129 | 3.7% | 6.5%(-2.77)#779 | 6.8%(-3.03)#15,357 |
| 25. | 76103 | 3.6% | 6.5%(-2.94)#815 | 6.8%(-3.21)#16,043 |
| 26. | 76111 | 2.5% | 6.5%(-4.03)#1,058 | 6.8%(-4.29)#20,130 |
| 27. | 76140 | 2.0% | 6.5%(-4.46)#1,160 | 6.8%(-4.73)#21,734 |
| 28. | 76115 | 1.9% | 6.5%(-4.58)#1,189 | 6.8%(-4.85)#22,172 |
| 29. | 76106 | 1.8% | 6.5%(-4.67)#1,218 | 6.8%(-4.94)#22,486 |
| 30. | 76119 | 1.6% | 6.5%(-4.92)#1,280 | 6.8%(-5.18)#23,336 |
| 31. | 76164 | 0.92% | 6.5%(-5.58)#1,432 | 6.8%(-5.84)#25,248 |
| 32. | 76105 | 0.74% | 6.5%(-5.76)#1,466 | 6.8%(-6.02)#25,712 |
1
Common Questions
What are the Top 10 Zip Codes with the Highest Percentage of Population Employed in Computer, Engineering & Science in Fort Worth, TX?
Top 10 Zip Codes with the Highest Percentage of Population Employed in Computer, Engineering & Science in Fort Worth, TX are:
What zip code has the Highest Percentage of Population Employed in Computer, Engineering & Science in Fort Worth, TX?
76155 has the Highest Percentage of Population Employed in Computer, Engineering & Science in Fort Worth, TX with 10.7%.
What is the Percentage of Population Employed in Computer, Engineering & Science in Fort Worth, TX?
Percentage of Population Employed in Computer, Engineering & Science in Fort Worth is 5.9%.
What is the Percentage of Population Employed in Computer, Engineering & Science in Texas?
Percentage of Population Employed in Computer, Engineering & Science in Texas is 6.5%.
What is the Percentage of Population Employed in Computer, Engineering & Science in the United States?
Percentage of Population Employed in Computer, Engineering & Science in the United States is 6.8%.