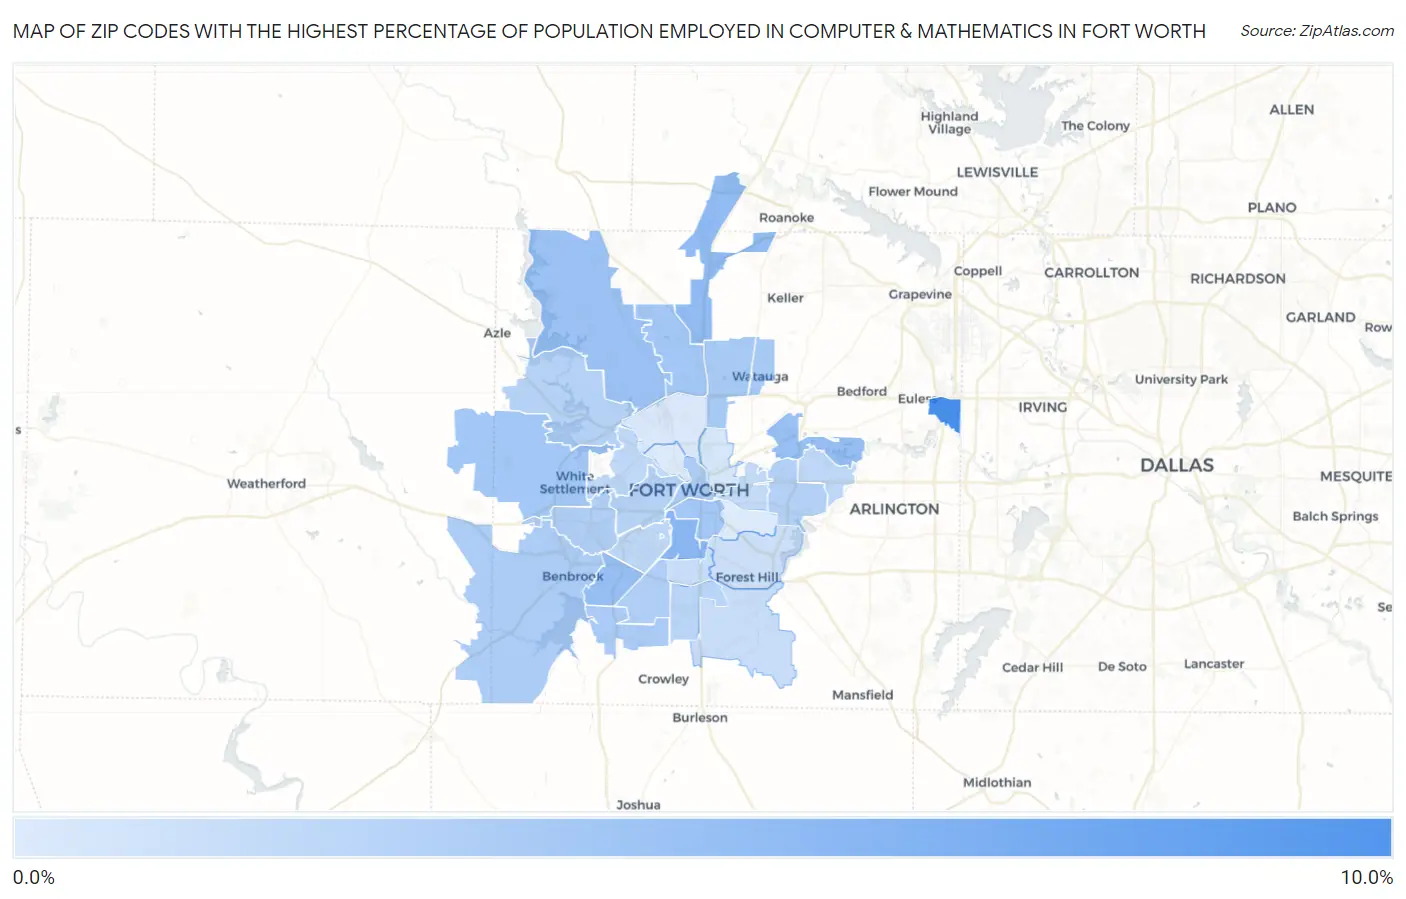
Zip Codes with the Highest Percentage of Population Employed in Computer & Mathematics in Fort Worth, TX
RELATED REPORTS & OPTIONS
Computer & Mathematics
Fort Worth
Compare Zip Codes
Map of Zip Codes with the Highest Percentage of Population Employed in Computer & Mathematics in Fort Worth
0.0%
10.0%
Zip Codes with the Highest Percentage of Population Employed in Computer & Mathematics in Fort Worth, TX
| Zip Code | % Employed | vs State | vs National | |
| 1. | 76155 | 8.8% | 3.4%(+5.32)#64 | 3.5%(+5.23)#966 |
| 2. | 76110 | 4.9% | 3.4%(+1.43)#208 | 3.5%(+1.34)#3,545 |
| 3. | 76177 | 4.4% | 3.4%(+1.01)#240 | 3.5%(+0.924)#4,177 |
| 4. | 76118 | 4.1% | 3.4%(+0.619)#284 | 3.5%(+0.530)#4,910 |
| 5. | 76132 | 4.0% | 3.4%(+0.564)#292 | 3.5%(+0.475)#5,052 |
| 6. | 76179 | 3.8% | 3.4%(+0.373)#306 | 3.5%(+0.284)#5,460 |
| 7. | 76104 | 3.4% | 3.4%(-0.046)#358 | 3.5%(-0.135)#6,508 |
| 8. | 76131 | 3.4% | 3.4%(-0.057)#361 | 3.5%(-0.146)#6,545 |
| 9. | 76108 | 3.4% | 3.4%(-0.078)#362 | 3.5%(-0.167)#6,598 |
| 10. | 76137 | 3.1% | 3.4%(-0.372)#413 | 3.5%(-0.461)#7,516 |
| 11. | 76148 | 3.0% | 3.4%(-0.392)#415 | 3.5%(-0.481)#7,582 |
| 12. | 76123 | 3.0% | 3.4%(-0.483)#433 | 3.5%(-0.572)#7,930 |
| 13. | 76102 | 2.9% | 3.4%(-0.567)#443 | 3.5%(-0.656)#8,218 |
| 14. | 76126 | 2.8% | 3.4%(-0.621)#456 | 3.5%(-0.710)#8,395 |
| 15. | 76133 | 2.6% | 3.4%(-0.794)#485 | 3.5%(-0.882)#9,054 |
| 16. | 76116 | 2.6% | 3.4%(-0.868)#498 | 3.5%(-0.957)#9,342 |
| 17. | 76112 | 2.5% | 3.4%(-0.939)#513 | 3.5%(-1.03)#9,659 |
| 18. | 76107 | 2.4% | 3.4%(-1.07)#547 | 3.5%(-1.16)#10,157 |
| 19. | 76135 | 2.3% | 3.4%(-1.16)#573 | 3.5%(-1.25)#10,570 |
| 20. | 76134 | 2.1% | 3.4%(-1.39)#618 | 3.5%(-1.47)#11,566 |
| 21. | 76129 | 1.9% | 3.4%(-1.57)#663 | 3.5%(-1.66)#12,453 |
| 22. | 76114 | 1.8% | 3.4%(-1.61)#672 | 3.5%(-1.70)#12,632 |
| 23. | 76109 | 1.8% | 3.4%(-1.61)#673 | 3.5%(-1.70)#12,654 |
| 24. | 76120 | 1.8% | 3.4%(-1.66)#684 | 3.5%(-1.75)#12,875 |
| 25. | 76103 | 1.6% | 3.4%(-1.88)#759 | 3.5%(-1.97)#14,066 |
| 26. | 76140 | 1.2% | 3.4%(-2.20)#865 | 3.5%(-2.29)#15,942 |
| 27. | 76115 | 1.2% | 3.4%(-2.20)#866 | 3.5%(-2.29)#15,943 |
| 28. | 76119 | 0.97% | 3.4%(-2.46)#980 | 3.5%(-2.55)#17,536 |
| 29. | 76111 | 0.56% | 3.4%(-2.87)#1,148 | 3.5%(-2.96)#20,081 |
| 30. | 76106 | 0.30% | 3.4%(-3.13)#1,259 | 3.5%(-3.22)#21,609 |
| 31. | 76105 | 0.19% | 3.4%(-3.24)#1,301 | 3.5%(-3.33)#22,087 |
| 32. | 76164 | 0.14% | 3.4%(-3.29)#1,315 | 3.5%(-3.38)#22,269 |
1
Common Questions
What are the Top 10 Zip Codes with the Highest Percentage of Population Employed in Computer & Mathematics in Fort Worth, TX?
Top 10 Zip Codes with the Highest Percentage of Population Employed in Computer & Mathematics in Fort Worth, TX are:
What zip code has the Highest Percentage of Population Employed in Computer & Mathematics in Fort Worth, TX?
76155 has the Highest Percentage of Population Employed in Computer & Mathematics in Fort Worth, TX with 8.8%.
What is the Percentage of Population Employed in Computer & Mathematics in Fort Worth, TX?
Percentage of Population Employed in Computer & Mathematics in Fort Worth is 3.1%.
What is the Percentage of Population Employed in Computer & Mathematics in Texas?
Percentage of Population Employed in Computer & Mathematics in Texas is 3.4%.
What is the Percentage of Population Employed in Computer & Mathematics in the United States?
Percentage of Population Employed in Computer & Mathematics in the United States is 3.5%.