Zip Codes with the Highest Percentage of Population Employed in Health Diagnosing & Treating in Richmond, TX
RELATED REPORTS & OPTIONS
Health Diagnosing & Treating
Richmond
Compare Zip Codes
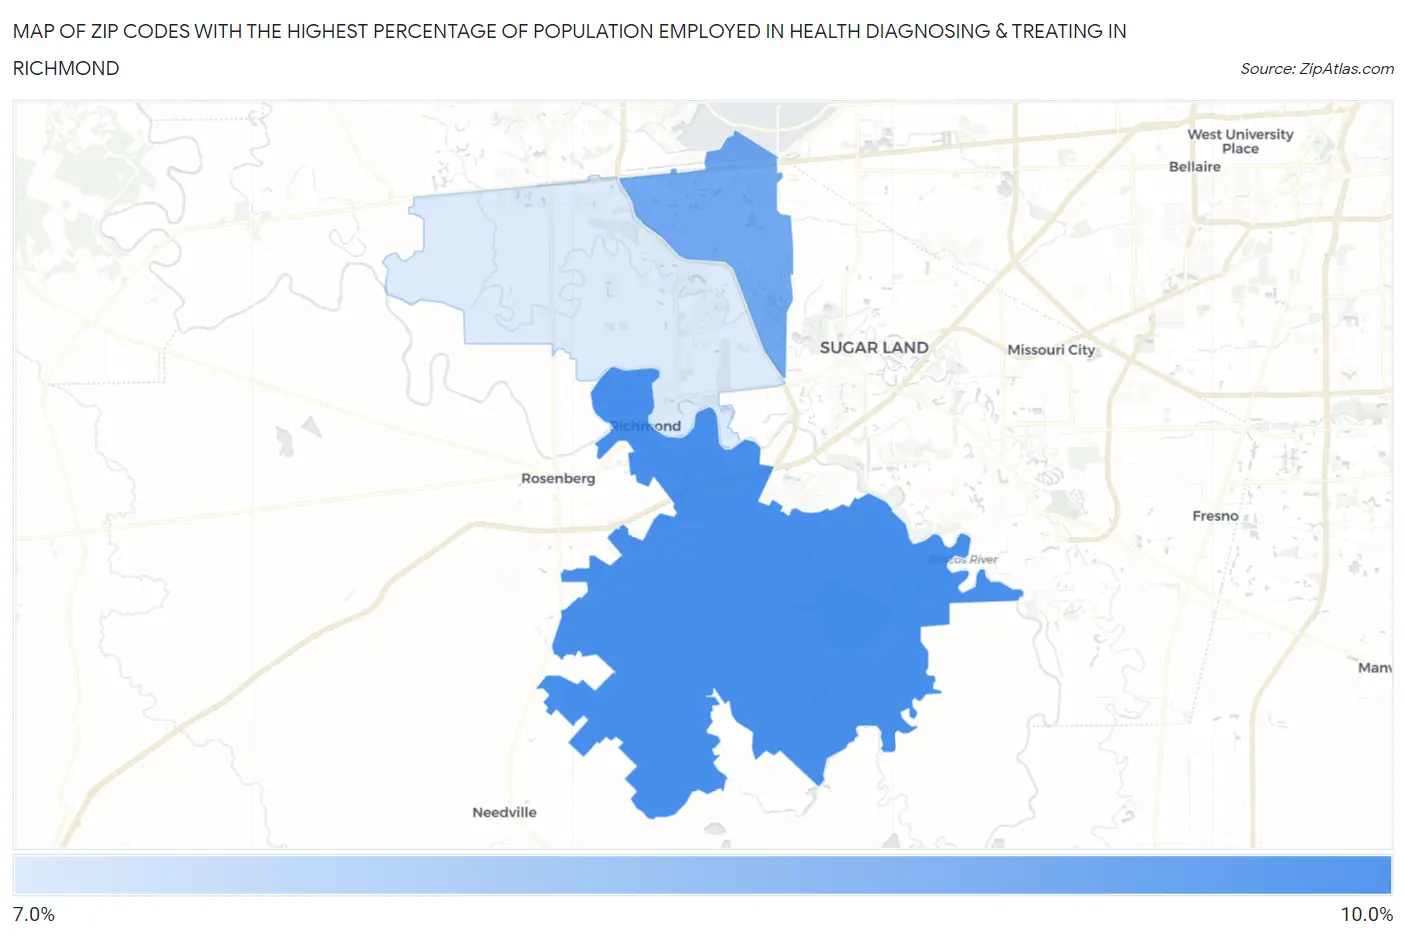
Map of Zip Codes with the Highest Percentage of Population Employed in Health Diagnosing & Treating in Richmond
0.0%
10.0%
Zip Codes with the Highest Percentage of Population Employed in Health Diagnosing & Treating in Richmond, TX
| Zip Code | % Employed | vs State | vs National | |
| 1. | 77469 | 9.0% | 5.5%(+3.51)#218 | 6.2%(+2.78)#5,330 |
| 2. | 77407 | 8.5% | 5.5%(+2.98)#258 | 6.2%(+2.25)#6,340 |
| 3. | 77406 | 7.1% | 5.5%(+1.59)#429 | 6.2%(+0.867)#9,994 |
1
Common Questions
What are the Top Zip Codes with the Highest Percentage of Population Employed in Health Diagnosing & Treating in Richmond, TX?
Top Zip Codes with the Highest Percentage of Population Employed in Health Diagnosing & Treating in Richmond, TX are:
What zip code has the Highest Percentage of Population Employed in Health Diagnosing & Treating in Richmond, TX?
77469 has the Highest Percentage of Population Employed in Health Diagnosing & Treating in Richmond, TX with 9.0%.
What is the Percentage of Population Employed in Health Diagnosing & Treating in Richmond, TX?
Percentage of Population Employed in Health Diagnosing & Treating in Richmond is 5.5%.
What is the Percentage of Population Employed in Health Diagnosing & Treating in Texas?
Percentage of Population Employed in Health Diagnosing & Treating in Texas is 5.5%.
What is the Percentage of Population Employed in Health Diagnosing & Treating in the United States?
Percentage of Population Employed in Health Diagnosing & Treating in the United States is 6.2%.