Zip Codes with the Highest Percentage of Population Employed in Health Diagnosing & Treating in Mcallen, TX
RELATED REPORTS & OPTIONS
Health Diagnosing & Treating
Mcallen
Compare Zip Codes
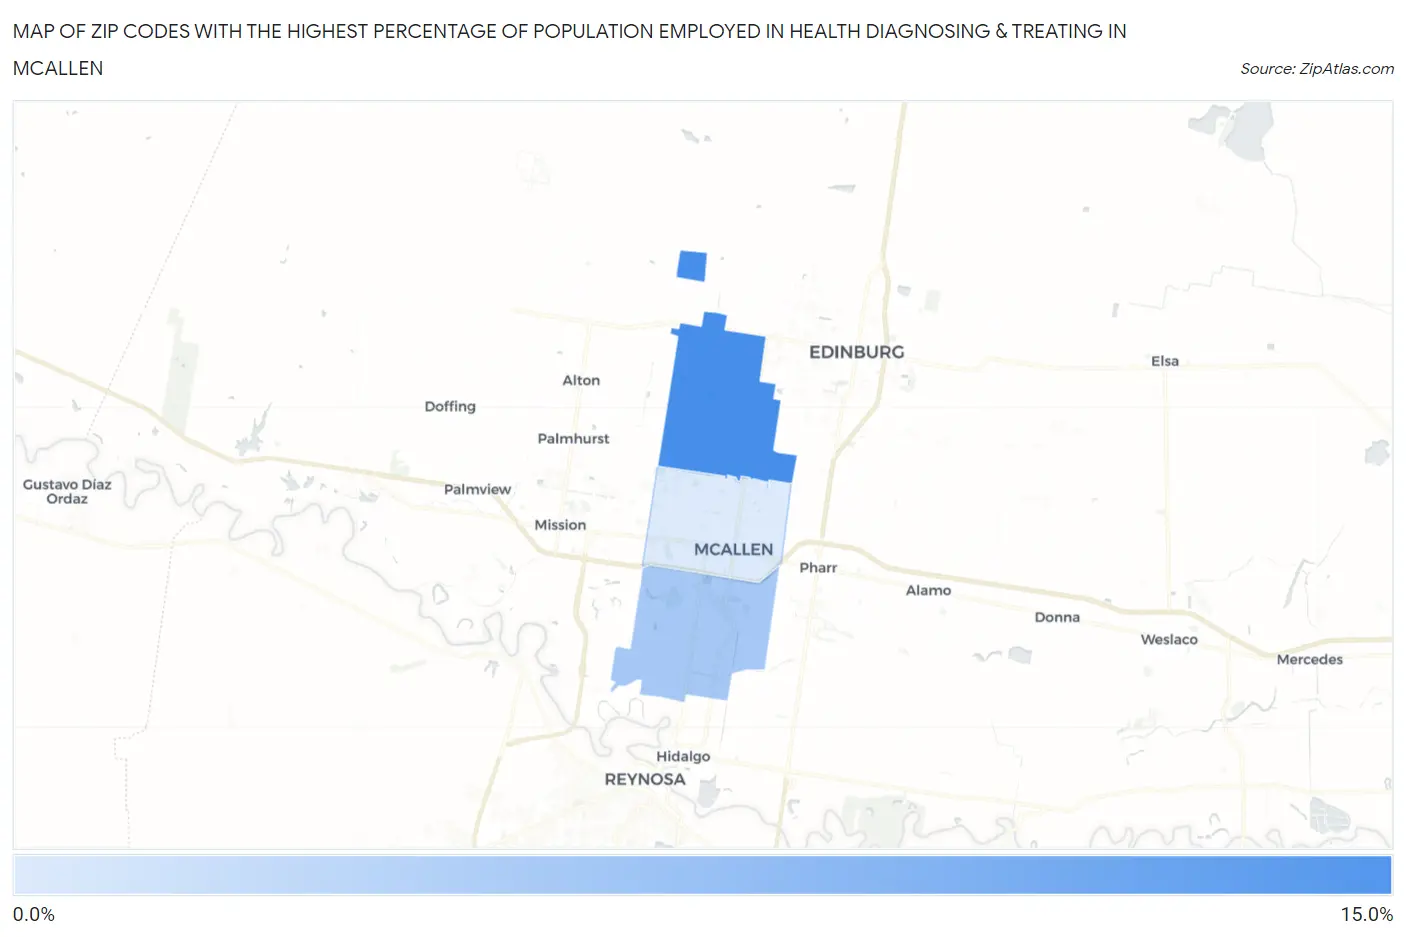
Map of Zip Codes with the Highest Percentage of Population Employed in Health Diagnosing & Treating in Mcallen
0.0%
15.0%
Zip Codes with the Highest Percentage of Population Employed in Health Diagnosing & Treating in Mcallen, TX
| Zip Code | % Employed | vs State | vs National | |
| 1. | 78504 | 10.4% | 5.5%(+4.91)#143 | 6.2%(+4.19)#3,379 |
| 2. | 78503 | 6.8% | 5.5%(+1.23)#473 | 6.2%(+0.509)#11,142 |
| 3. | 78501 | 4.7% | 5.5%(-0.806)#894 | 6.2%(-1.53)#18,811 |
1
Common Questions
What are the Top Zip Codes with the Highest Percentage of Population Employed in Health Diagnosing & Treating in Mcallen, TX?
Top Zip Codes with the Highest Percentage of Population Employed in Health Diagnosing & Treating in Mcallen, TX are:
What zip code has the Highest Percentage of Population Employed in Health Diagnosing & Treating in Mcallen, TX?
78504 has the Highest Percentage of Population Employed in Health Diagnosing & Treating in Mcallen, TX with 10.4%.
What is the Percentage of Population Employed in Health Diagnosing & Treating in Mcallen, TX?
Percentage of Population Employed in Health Diagnosing & Treating in Mcallen is 7.4%.
What is the Percentage of Population Employed in Health Diagnosing & Treating in Texas?
Percentage of Population Employed in Health Diagnosing & Treating in Texas is 5.5%.
What is the Percentage of Population Employed in Health Diagnosing & Treating in the United States?
Percentage of Population Employed in Health Diagnosing & Treating in the United States is 6.2%.