Zip Codes with the Highest Percentage of Self-Employed / Not Incorporated in Fort Worth, TX

RELATED REPORTS & OPTIONS

Self-Employed / Not Incorporated
Population
Families and Households
Female Fertility
Female Fertility (Unmarried)
Race (Community Size)
Race (Percentage)
Ancestry (Community Size)
AfghanAfricanAlbanianAlsatianAmericanApacheArabArgentineanArmenianAustralianAustrianBahamianBangladeshiBarbadianBasqueBelgianBhutaneseBlackfeetBolivianBrazilianBritishBritish West IndianBulgarianBurmeseCajunCambodianCanadianCelticCentral AmericanCentral American IndianCherokeeCheyenneChickasawChileanChippewaChoctawColombianComancheCosta RicanCreekCroatianCrowCubanCzechCzechoslovakianDanishDelawareDominicanDutchDutch West IndianEastern EuropeanEcuadorianEgyptianEnglishEstonianEthiopianEuropeanFilipinoFinnishFrenchFrench American IndianFrench CanadianGermanGerman RussianGhanaianGreekGuamanian / ChamorroGuatemalanGuyaneseHaitianHonduranHopiHungarianIcelanderIndian (Asian)IndonesianInupiatIranianIraqiIrishIroquoisIsraeliItalianJamaicanJapaneseJordanianKenyanKiowaKoreanLaotianLatvianLebaneseLiberianLithuanianLuxembourgerMalaysianMalteseMexicanMexican American IndianMongolianMoroccanNative HawaiianNavajoNicaraguanNigerianNorthern EuropeanNorwegianOsageOttawaPakistaniPalestinianPanamanianPennsylvania GermanPeruvianPolishPortuguesePotawatomiPuebloPuerto RicanRomanianRussianSalvadoranSamoanScandinavianScotch-IrishScottishSerbianSiouxSlavicSlovakSloveneSomaliSouth AfricanSouth AmericanSouth American IndianSpaniardSpanishSpanish AmericanSpanish American IndianSri LankanSubsaharan AfricanSudaneseSwedishSwissSyrianThaiTonganTrinidadian and TobagonianTurkishUgandanUkrainianVenezuelanVietnameseWelshWest IndianYaquiYugoslavianZimbabwean
Ancestry (Percentage)
AfghanAfricanAlbanianAlsatianAmericanApacheArabArgentineanArmenianAustralianAustrianBahamianBangladeshiBarbadianBasqueBelgianBhutaneseBlackfeetBolivianBrazilianBritishBritish West IndianBulgarianBurmeseCajunCambodianCanadianCelticCentral AmericanCentral American IndianCherokeeCheyenneChickasawChileanChippewaChoctawColombianComancheCosta RicanCreekCroatianCrowCubanCzechCzechoslovakianDanishDelawareDominicanDutchDutch West IndianEastern EuropeanEcuadorianEgyptianEnglishEstonianEthiopianEuropeanFilipinoFinnishFrenchFrench American IndianFrench CanadianGermanGerman RussianGhanaianGreekGuamanian / ChamorroGuatemalanGuyaneseHaitianHonduranHopiHungarianIcelanderIndian (Asian)IndonesianInupiatIranianIraqiIrishIroquoisIsraeliItalianJamaicanJapaneseJordanianKenyanKiowaKoreanLaotianLatvianLebaneseLiberianLithuanianLuxembourgerMalaysianMalteseMexicanMexican American IndianMongolianMoroccanNative HawaiianNavajoNicaraguanNigerianNorthern EuropeanNorwegianOsageOttawaPakistaniPalestinianPanamanianPennsylvania GermanPeruvianPolishPortuguesePotawatomiPuebloPuerto RicanRomanianRussianSalvadoranSamoanScandinavianScotch-IrishScottishSerbianSiouxSlavicSlovakSloveneSomaliSouth AfricanSouth AmericanSouth American IndianSpaniardSpanishSpanish AmericanSpanish American IndianSri LankanSubsaharan AfricanSudaneseSwedishSwissSyrianThaiTonganTrinidadian and TobagonianTurkishUgandanUkrainianVenezuelanVietnameseWelshWest IndianYaquiYugoslavianZimbabwean
Immigrant Origin (Total)
AfghanistanAfricaAlbaniaArgentinaAsiaAustraliaBahamasBangladeshBarbadosBelarusBelizeBoliviaBosnia and HerzegovinaBrazilBulgariaBurma / MyanmarCambodiaCameroonCanadaCaribbeanCentral AmericaChileChinaColombiaCongoCosta RicaCroatiaCubaCzechoslovakiaDominican RepublicEastern AfricaEastern AsiaEastern EuropeEcuadorEgyptEl SalvadorEnglandEritreaEthiopiaEuropeFranceGermanyGhanaGreeceGuatemalaHaitiHondurasHong KongHungaryIndiaIndonesiaIranIraqIrelandIsraelItalyJamaicaJapanJordanKenyaKoreaLaosLatin AmericaLebanonLiberiaMalaysiaMexicoMicronesiaMiddle AfricaMoroccoNepalNetherlandsNicaraguaNigeriaNorthern AfricaNorthern EuropeOceaniaPakistanPanamaPeruPhilippinesPolandPortugalRomaniaRussiaScotlandSenegalSerbiaSomaliaSouth AfricaSouth AmericaSouth Central AsiaSouth Eastern AsiaSouthern EuropeSpainSri LankaSudanSwedenSwitzerlandSyriaTaiwanThailandTrinidad and TobagoTurkeyUgandaUkraineVenezuelaVietnamWestern AfricaWestern AsiaWestern EuropeZaireZimbabwe
Immigrant Origin (Percentage)
AfghanistanAfricaAlbaniaArgentinaAsiaAustraliaBahamasBangladeshBarbadosBelarusBelizeBoliviaBosnia and HerzegovinaBrazilBulgariaBurma / MyanmarCambodiaCameroonCanadaCaribbeanCentral AmericaChileChinaColombiaCongoCosta RicaCroatiaCubaCzechoslovakiaDominican RepublicEastern AfricaEastern AsiaEastern EuropeEcuadorEgyptEl SalvadorEnglandEritreaEthiopiaEuropeFranceGermanyGhanaGreeceGuatemalaHaitiHondurasHong KongHungaryIndiaIndonesiaIranIraqIrelandIsraelItalyJamaicaJapanJordanKenyaKoreaLaosLatin AmericaLebanonLiberiaMalaysiaMexicoMicronesiaMiddle AfricaMoroccoNepalNetherlandsNicaraguaNigeriaNorthern AfricaNorthern EuropeOceaniaPakistanPanamaPeruPhilippinesPolandPortugalRomaniaRussiaScotlandSenegalSerbiaSomaliaSouth AfricaSouth AmericaSouth Central AsiaSouth Eastern AsiaSouthern EuropeSpainSri LankaSudanSwedenSwitzerlandSyriaTaiwanThailandTrinidad and TobagoTurkeyUgandaUkraineVenezuelaVietnamWestern AfricaWestern AsiaWestern EuropeZaireZimbabwe
Income
Income (Families)
Income (Households)
Poverty
Poverty (Families)
Unemployment
Employment Occupations
Employment Industries
Employer Class
Commute Time
Commute Means
School Enrollment
Education by Degree Field
Occupancy
Finances
Physical Characteristics
Fort Worth
Compare Zip Codes
Comparison Subject

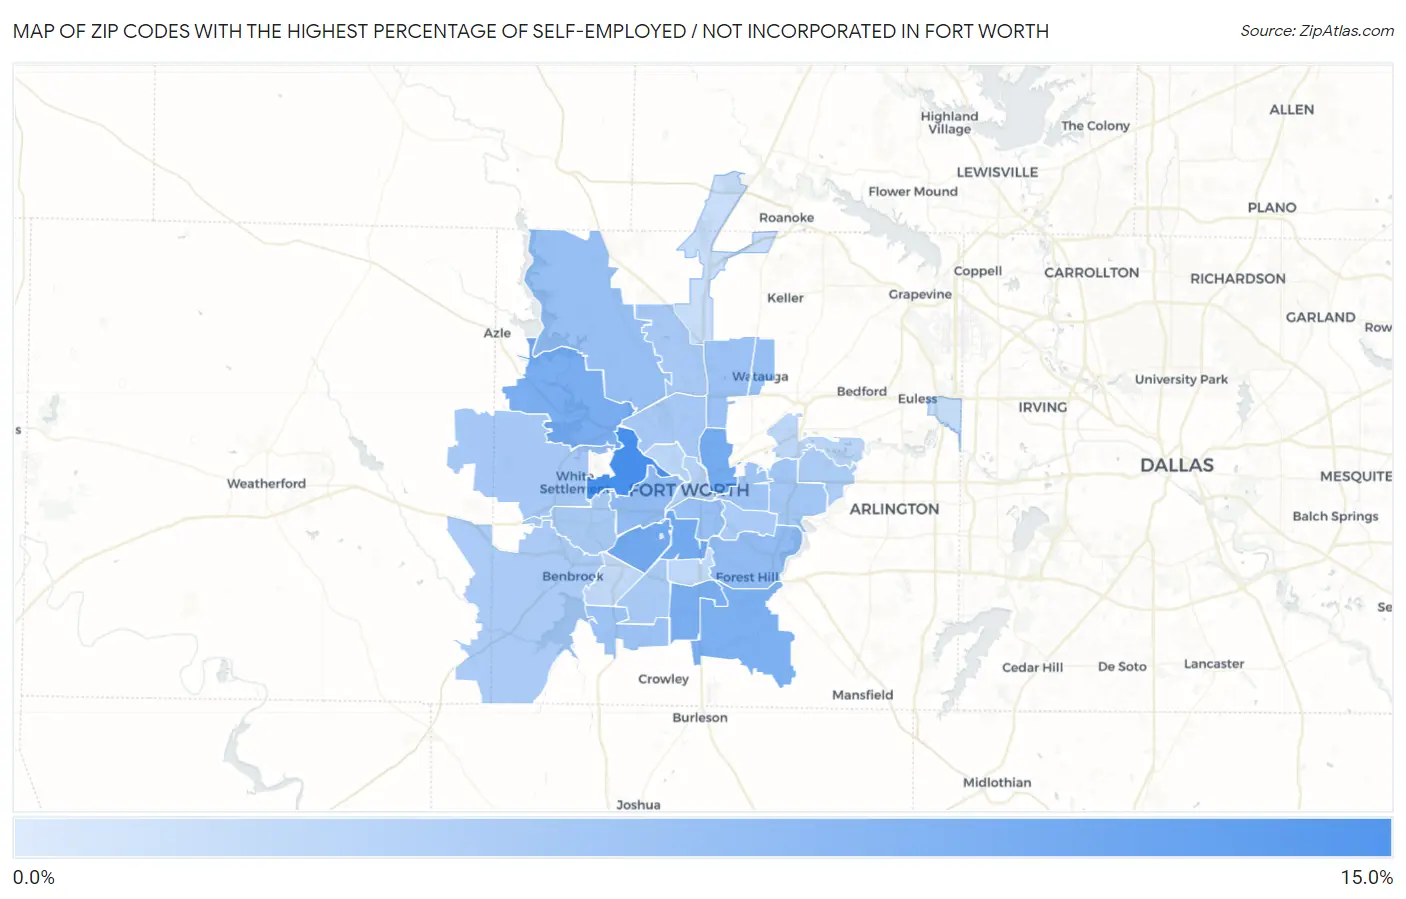
Map of Zip Codes with the Highest Percentage of Self-Employed / Not Incorporated in Fort Worth

0.0%
15.0%
Zip Codes with the Highest Percentage of Self-Employed / Not Incorporated in Fort Worth Map

Zip Codes with the Highest Percentage of Self-Employed / Not Incorporated in Fort Worth, TX

Zip Code % Self-Employed / Not Incorporated vs State vs National
1.7611413.6%6.7%(+6.83)#2395.8%(+7.75)#4,146
2.7610910.1%6.7%(+3.34)#4595.8%(+4.26)#7,260
3.7611010.0%6.7%(+3.23)#4705.8%(+4.14)#7,409
4.761119.8%6.7%(+3.05)#4925.8%(+3.96)#7,659
5.761359.5%6.7%(+2.77)#5135.8%(+3.69)#8,015
6.761349.5%6.7%(+2.75)#5165.8%(+3.67)#8,038
7.761409.4%6.7%(+2.63)#5365.8%(+3.55)#8,218
8.761197.8%6.7%(+1.03)#7755.8%(+1.94)#11,160
9.761077.7%6.7%(+0.965)#7875.8%(+1.88)#11,300
10.761797.1%6.7%(+0.408)#8925.8%(+1.32)#12,668
11.761047.1%6.7%(+0.384)#8965.8%(+1.30)#12,716
12.761487.1%6.7%(+0.329)#9095.8%(+1.25)#12,867
13.761237.1%6.7%(+0.327)#9115.8%(+1.24)#12,874
14.761377.0%6.7%(+0.294)#9175.8%(+1.21)#12,986
15.761036.5%6.7%(-0.235)#1,0285.8%(+0.682)#14,478
16.761126.2%6.7%(-0.513)#1,0935.8%(+0.404)#15,356
17.761066.1%6.7%(-0.620)#1,1205.8%(+0.297)#15,687
18.761086.1%6.7%(-0.663)#1,1355.8%(+0.254)#15,833
19.761316.0%6.7%(-0.705)#1,1495.8%(+0.212)#15,977
20.761165.9%6.7%(-0.858)#1,1875.8%(+0.059)#16,464
21.761335.9%6.7%(-0.879)#1,1955.8%(+0.038)#16,531
22.761055.8%6.7%(-0.958)#1,2135.8%(-0.041)#16,783
23.761265.7%6.7%(-1.08)#1,2505.8%(-0.164)#17,226
24.761205.5%6.7%(-1.26)#1,2895.8%(-0.340)#17,857
25.761024.9%6.7%(-1.81)#1,4065.8%(-0.894)#19,982
26.761644.5%6.7%(-2.21)#1,4675.8%(-1.29)#21,473
27.761184.4%6.7%(-2.35)#1,4835.8%(-1.44)#22,039
28.761154.2%6.7%(-2.50)#1,5055.8%(-1.58)#22,561
29.761324.0%6.7%(-2.75)#1,5335.8%(-1.84)#23,463
30.761553.7%6.7%(-3.05)#1,5725.8%(-2.13)#24,449
31.761773.4%6.7%(-3.29)#1,5975.8%(-2.38)#25,193
32.761291.9%6.7%(-4.79)#1,6875.8%(-3.87)#28,311

Common Questions

What are the Top 10 Zip Codes with the Highest Percentage of Self-Employed / Not Incorporated in Fort Worth, TX?
Top 10 Zip Codes with the Highest Percentage of Self-Employed / Not Incorporated in Fort Worth, TX are:
#1
13.6%
#2
10.1%
#3
10.0%
#4
9.8%
#5
9.5%
#6
9.5%
#7
9.4%
#8
7.8%
#9
7.7%
#10
7.1%
What zip code has the Highest Percentage of Self-Employed / Not Incorporated in Fort Worth, TX?
76114 has the Highest Percentage of Self-Employed / Not Incorporated in Fort Worth, TX with 13.6%.
What is the Percentage of Self-Employed / Not Incorporated in Fort Worth, TX?
Percentage of Self-Employed / Not Incorporated in Fort Worth is 6.4%.
What is the Percentage of Self-Employed / Not Incorporated in Texas?
Percentage of Self-Employed / Not Incorporated in Texas is 6.7%.
What is the Percentage of Self-Employed / Not Incorporated in the United States?
Percentage of Self-Employed / Not Incorporated in the United States is 5.8%.