Zip Codes with the Highest Percentage of Population Employed in Health Diagnosing & Treating in Magnolia, TX
RELATED REPORTS & OPTIONS
Health Diagnosing & Treating
Magnolia
Compare Zip Codes
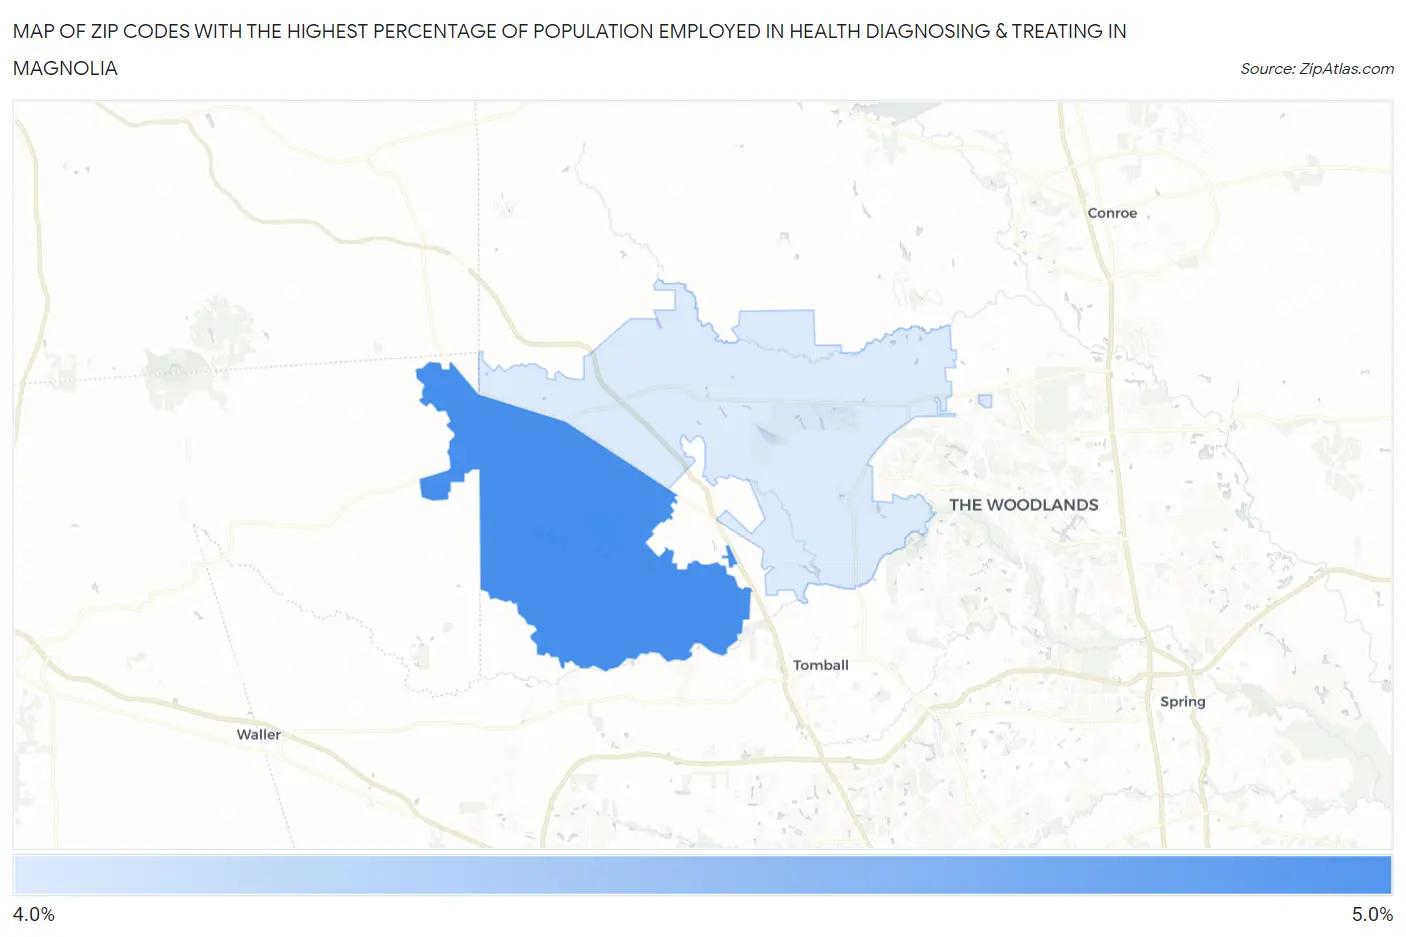
Map of Zip Codes with the Highest Percentage of Population Employed in Health Diagnosing & Treating in Magnolia
0.0%
5.0%
Zip Codes with the Highest Percentage of Population Employed in Health Diagnosing & Treating in Magnolia, TX
| Zip Code | % Employed | vs State | vs National | |
| 1. | 77355 | 4.7% | 5.5%(-0.866)#908 | 6.2%(-1.59)#19,043 |
| 2. | 77354 | 4.6% | 5.5%(-0.919)#918 | 6.2%(-1.65)#19,254 |
1
Common Questions
What are the Top Zip Codes with the Highest Percentage of Population Employed in Health Diagnosing & Treating in Magnolia, TX?
Top Zip Codes with the Highest Percentage of Population Employed in Health Diagnosing & Treating in Magnolia, TX are:
What zip code has the Highest Percentage of Population Employed in Health Diagnosing & Treating in Magnolia, TX?
77355 has the Highest Percentage of Population Employed in Health Diagnosing & Treating in Magnolia, TX with 4.7%.
What is the Percentage of Population Employed in Health Diagnosing & Treating in Magnolia, TX?
Percentage of Population Employed in Health Diagnosing & Treating in Magnolia is 1.4%.
What is the Percentage of Population Employed in Health Diagnosing & Treating in Texas?
Percentage of Population Employed in Health Diagnosing & Treating in Texas is 5.5%.
What is the Percentage of Population Employed in Health Diagnosing & Treating in the United States?
Percentage of Population Employed in Health Diagnosing & Treating in the United States is 6.2%.