Zip Codes with the Highest Percentage of Population with a Degree in Computers and Mathematics in Fort Worth, TX

RELATED REPORTS & OPTIONS

Computers and Mathematics
Population
Families and Households
Female Fertility
Female Fertility (Unmarried)
Race (Community Size)
Race (Percentage)
Ancestry (Community Size)
AfghanAfricanAlbanianAlsatianAmericanApacheArabArgentineanArmenianAustralianAustrianBahamianBangladeshiBarbadianBasqueBelgianBhutaneseBlackfeetBolivianBrazilianBritishBritish West IndianBulgarianBurmeseCajunCambodianCanadianCelticCentral AmericanCentral American IndianCherokeeCheyenneChickasawChileanChippewaChoctawColombianComancheCosta RicanCreekCroatianCrowCubanCzechCzechoslovakianDanishDelawareDominicanDutchDutch West IndianEastern EuropeanEcuadorianEgyptianEnglishEstonianEthiopianEuropeanFilipinoFinnishFrenchFrench American IndianFrench CanadianGermanGerman RussianGhanaianGreekGuamanian / ChamorroGuatemalanGuyaneseHaitianHonduranHopiHungarianIcelanderIndian (Asian)IndonesianInupiatIranianIraqiIrishIroquoisIsraeliItalianJamaicanJapaneseJordanianKenyanKiowaKoreanLaotianLatvianLebaneseLiberianLithuanianLuxembourgerMalaysianMalteseMexicanMexican American IndianMongolianMoroccanNative HawaiianNavajoNicaraguanNigerianNorthern EuropeanNorwegianOsageOttawaPakistaniPalestinianPanamanianPennsylvania GermanPeruvianPolishPortuguesePotawatomiPuebloPuerto RicanRomanianRussianSalvadoranSamoanScandinavianScotch-IrishScottishSerbianSiouxSlavicSlovakSloveneSomaliSouth AfricanSouth AmericanSouth American IndianSpaniardSpanishSpanish AmericanSpanish American IndianSri LankanSubsaharan AfricanSudaneseSwedishSwissSyrianThaiTonganTrinidadian and TobagonianTurkishUgandanUkrainianVenezuelanVietnameseWelshWest IndianYaquiYugoslavianZimbabwean
Ancestry (Percentage)
AfghanAfricanAlbanianAlsatianAmericanApacheArabArgentineanArmenianAustralianAustrianBahamianBangladeshiBarbadianBasqueBelgianBhutaneseBlackfeetBolivianBrazilianBritishBritish West IndianBulgarianBurmeseCajunCambodianCanadianCelticCentral AmericanCentral American IndianCherokeeCheyenneChickasawChileanChippewaChoctawColombianComancheCosta RicanCreekCroatianCrowCubanCzechCzechoslovakianDanishDelawareDominicanDutchDutch West IndianEastern EuropeanEcuadorianEgyptianEnglishEstonianEthiopianEuropeanFilipinoFinnishFrenchFrench American IndianFrench CanadianGermanGerman RussianGhanaianGreekGuamanian / ChamorroGuatemalanGuyaneseHaitianHonduranHopiHungarianIcelanderIndian (Asian)IndonesianInupiatIranianIraqiIrishIroquoisIsraeliItalianJamaicanJapaneseJordanianKenyanKiowaKoreanLaotianLatvianLebaneseLiberianLithuanianLuxembourgerMalaysianMalteseMexicanMexican American IndianMongolianMoroccanNative HawaiianNavajoNicaraguanNigerianNorthern EuropeanNorwegianOsageOttawaPakistaniPalestinianPanamanianPennsylvania GermanPeruvianPolishPortuguesePotawatomiPuebloPuerto RicanRomanianRussianSalvadoranSamoanScandinavianScotch-IrishScottishSerbianSiouxSlavicSlovakSloveneSomaliSouth AfricanSouth AmericanSouth American IndianSpaniardSpanishSpanish AmericanSpanish American IndianSri LankanSubsaharan AfricanSudaneseSwedishSwissSyrianThaiTonganTrinidadian and TobagonianTurkishUgandanUkrainianVenezuelanVietnameseWelshWest IndianYaquiYugoslavianZimbabwean
Immigrant Origin (Total)
AfghanistanAfricaAlbaniaArgentinaAsiaAustraliaBahamasBangladeshBarbadosBelarusBelizeBoliviaBosnia and HerzegovinaBrazilBulgariaBurma / MyanmarCambodiaCameroonCanadaCaribbeanCentral AmericaChileChinaColombiaCongoCosta RicaCroatiaCubaCzechoslovakiaDominican RepublicEastern AfricaEastern AsiaEastern EuropeEcuadorEgyptEl SalvadorEnglandEritreaEthiopiaEuropeFranceGermanyGhanaGreeceGuatemalaHaitiHondurasHong KongHungaryIndiaIndonesiaIranIraqIrelandIsraelItalyJamaicaJapanJordanKenyaKoreaLaosLatin AmericaLebanonLiberiaMalaysiaMexicoMicronesiaMiddle AfricaMoroccoNepalNetherlandsNicaraguaNigeriaNorthern AfricaNorthern EuropeOceaniaPakistanPanamaPeruPhilippinesPolandPortugalRomaniaRussiaScotlandSenegalSerbiaSomaliaSouth AfricaSouth AmericaSouth Central AsiaSouth Eastern AsiaSouthern EuropeSpainSri LankaSudanSwedenSwitzerlandSyriaTaiwanThailandTrinidad and TobagoTurkeyUgandaUkraineVenezuelaVietnamWestern AfricaWestern AsiaWestern EuropeZaireZimbabwe
Immigrant Origin (Percentage)
AfghanistanAfricaAlbaniaArgentinaAsiaAustraliaBahamasBangladeshBarbadosBelarusBelizeBoliviaBosnia and HerzegovinaBrazilBulgariaBurma / MyanmarCambodiaCameroonCanadaCaribbeanCentral AmericaChileChinaColombiaCongoCosta RicaCroatiaCubaCzechoslovakiaDominican RepublicEastern AfricaEastern AsiaEastern EuropeEcuadorEgyptEl SalvadorEnglandEritreaEthiopiaEuropeFranceGermanyGhanaGreeceGuatemalaHaitiHondurasHong KongHungaryIndiaIndonesiaIranIraqIrelandIsraelItalyJamaicaJapanJordanKenyaKoreaLaosLatin AmericaLebanonLiberiaMalaysiaMexicoMicronesiaMiddle AfricaMoroccoNepalNetherlandsNicaraguaNigeriaNorthern AfricaNorthern EuropeOceaniaPakistanPanamaPeruPhilippinesPolandPortugalRomaniaRussiaScotlandSenegalSerbiaSomaliaSouth AfricaSouth AmericaSouth Central AsiaSouth Eastern AsiaSouthern EuropeSpainSri LankaSudanSwedenSwitzerlandSyriaTaiwanThailandTrinidad and TobagoTurkeyUgandaUkraineVenezuelaVietnamWestern AfricaWestern AsiaWestern EuropeZaireZimbabwe
Income
Income (Families)
Income (Households)
Poverty
Poverty (Families)
Unemployment
Employment Occupations
Employment Industries
Employer Class
Commute Time
Commute Means
School Enrollment
Education by Degree Field
Occupancy
Finances
Physical Characteristics
Fort Worth
Compare Zip Codes
Comparison Subject

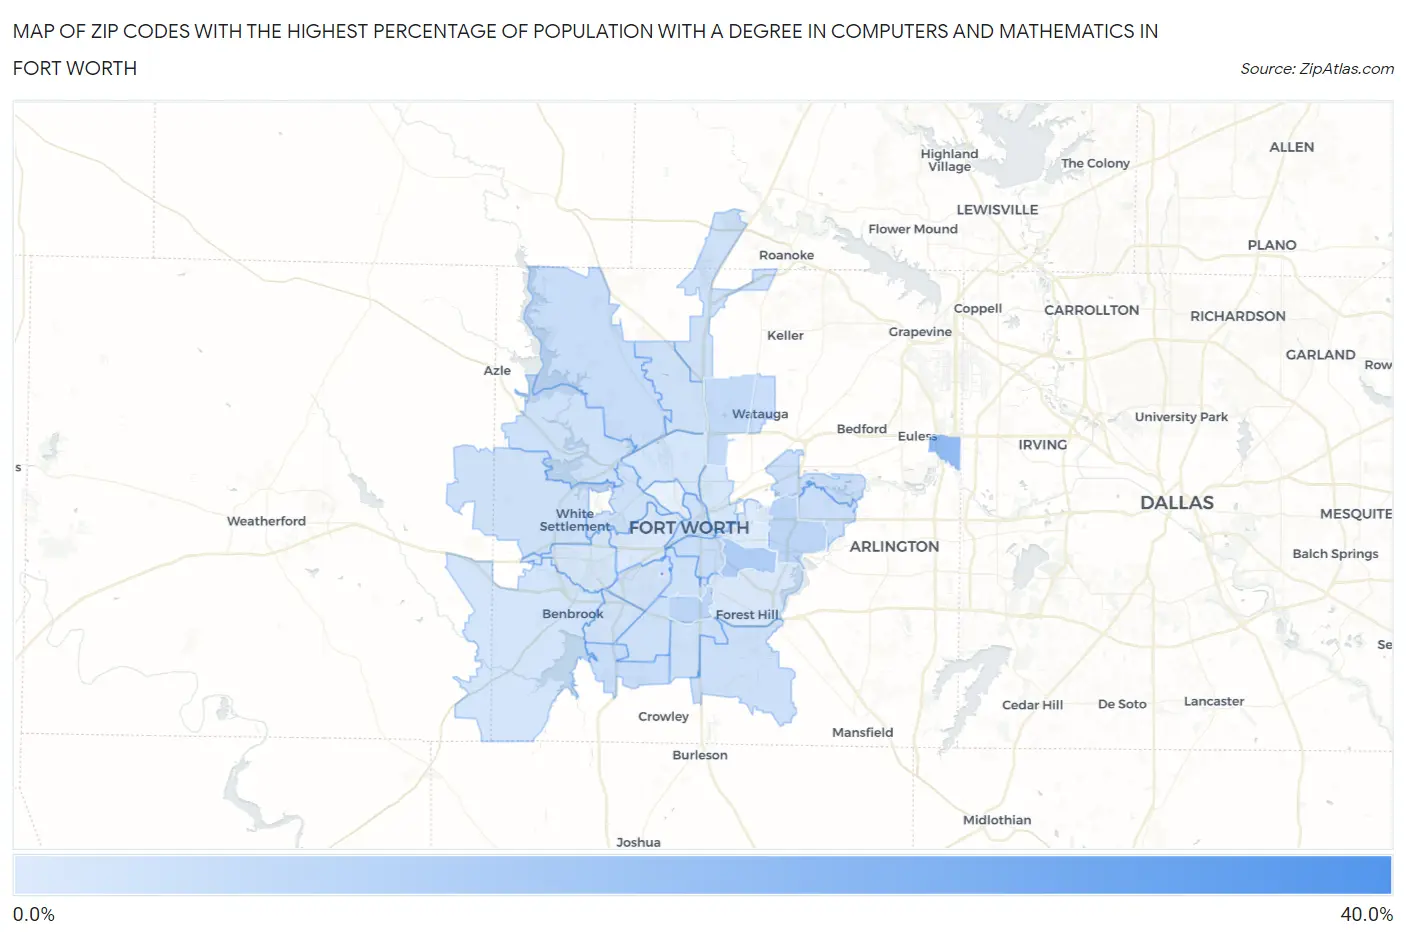
Map of Zip Codes with the Highest Percentage of Population with a Degree in Computers and Mathematics in Fort Worth

0.0%
40.0%
Zip Codes with the Highest Percentage of Population with a Degree in Computers and Mathematics in Fort Worth Map

Zip Codes with the Highest Percentage of Population with a Degree in Computers and Mathematics in Fort Worth, TX

Zip Code % Graduates vs State vs National
1.7612936.8%5.2%(+31.7)#84.9%(+31.9)#152
2.7615517.7%5.2%(+12.5)#324.9%(+12.8)#577
3.7610510.9%5.2%(+5.76)#944.9%(+6.05)#1,469
4.761158.0%5.2%(+2.77)#1924.9%(+3.06)#2,944
5.761127.7%5.2%(+2.48)#2144.9%(+2.76)#3,190
6.761376.4%5.2%(+1.21)#3244.9%(+1.50)#4,624
7.761795.4%5.2%(+0.187)#4554.9%(+0.471)#6,595
8.761045.3%5.2%(+0.110)#4674.9%(+0.394)#6,785
9.761235.2%5.2%(+0.071)#4754.9%(+0.355)#6,889
10.761205.0%5.2%(-0.163)#5054.9%(+0.121)#7,416
11.761184.7%5.2%(-0.468)#5574.9%(-0.184)#8,237
12.761484.7%5.2%(-0.520)#5674.9%(-0.236)#8,398
13.761024.4%5.2%(-0.743)#6114.9%(-0.459)#9,078
14.761404.0%5.2%(-1.13)#6884.9%(-0.845)#10,306
15.761314.0%5.2%(-1.21)#6984.9%(-0.924)#10,556
16.761343.9%5.2%(-1.25)#7044.9%(-0.969)#10,706
17.761143.9%5.2%(-1.32)#7194.9%(-1.03)#10,948
18.761083.8%5.2%(-1.41)#7354.9%(-1.13)#11,308
19.761103.8%5.2%(-1.41)#7364.9%(-1.13)#11,311
20.761773.7%5.2%(-1.47)#7444.9%(-1.19)#11,509
21.761353.6%5.2%(-1.59)#7714.9%(-1.30)#11,920
22.761333.6%5.2%(-1.61)#7774.9%(-1.33)#12,048
23.761323.5%5.2%(-1.69)#7964.9%(-1.41)#12,357
24.761093.2%5.2%(-2.03)#8554.9%(-1.74)#13,548
25.761062.7%5.2%(-2.48)#9444.9%(-2.19)#15,139
26.761262.6%5.2%(-2.57)#9654.9%(-2.29)#15,512
27.761112.5%5.2%(-2.63)#9804.9%(-2.35)#15,739
28.761162.3%5.2%(-2.90)#1,0354.9%(-2.62)#16,678
29.761192.0%5.2%(-3.17)#1,0924.9%(-2.88)#17,590
30.761071.3%5.2%(-3.89)#1,2124.9%(-3.60)#19,755
31.761030.92%5.2%(-4.26)#1,2574.9%(-3.97)#20,694

Common Questions

What are the Top 10 Zip Codes with the Highest Percentage of Population with a Degree in Computers and Mathematics in Fort Worth, TX?
Top 10 Zip Codes with the Highest Percentage of Population with a Degree in Computers and Mathematics in Fort Worth, TX are:
#1
36.8%
#2
17.7%
#3
10.9%
#4
8.0%
#5
7.7%
#6
6.4%
#7
5.4%
#8
5.3%
#9
5.2%
#10
5.0%
What zip code has the Highest Percentage of Population with a Degree in Computers and Mathematics in Fort Worth, TX?
76129 has the Highest Percentage of Population with a Degree in Computers and Mathematics in Fort Worth, TX with 36.8%.
What is the Percentage of Population with a Degree in Computers and Mathematics in Fort Worth, TX?
Percentage of Population with a Degree in Computers and Mathematics in Fort Worth is 4.6%.
What is the Percentage of Population with a Degree in Computers and Mathematics in Texas?
Percentage of Population with a Degree in Computers and Mathematics in Texas is 5.2%.
What is the Percentage of Population with a Degree in Computers and Mathematics in the United States?
Percentage of Population with a Degree in Computers and Mathematics in the United States is 4.9%.