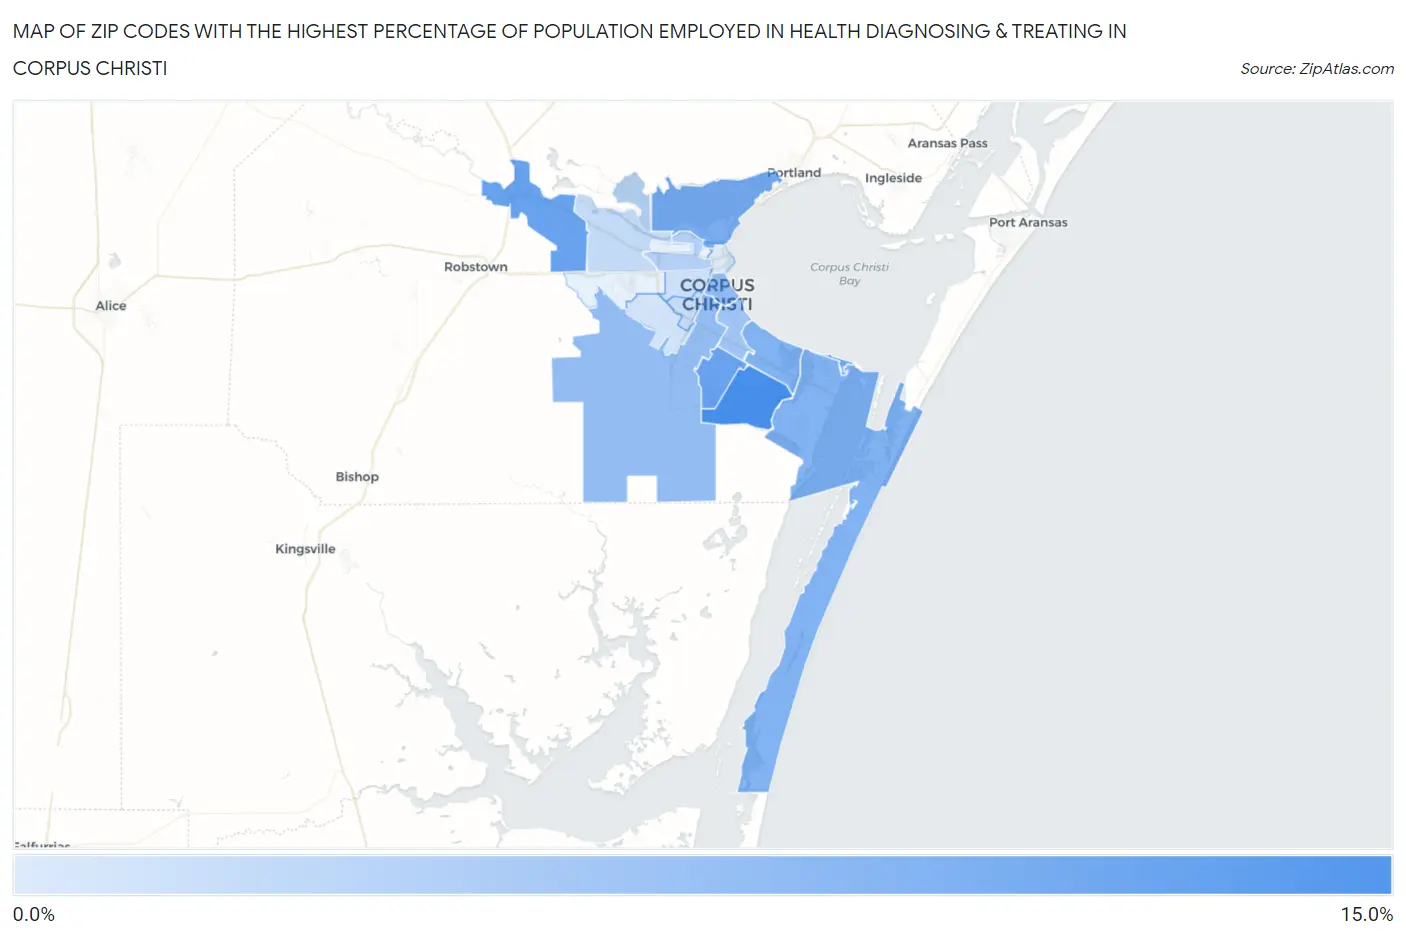
Zip Codes with the Highest Percentage of Population Employed in Health Diagnosing & Treating in Corpus Christi, TX
RELATED REPORTS & OPTIONS
Health Diagnosing & Treating
Corpus Christi
Compare Zip Codes
Map of Zip Codes with the Highest Percentage of Population Employed in Health Diagnosing & Treating in Corpus Christi
0.0%
15.0%
Zip Codes with the Highest Percentage of Population Employed in Health Diagnosing & Treating in Corpus Christi, TX
| Zip Code | % Employed | vs State | vs National | |
| 1. | 78414 | 10.0% | 5.5%(+4.51)#161 | 6.2%(+3.79)#3,856 |
| 2. | 78410 | 8.0% | 5.5%(+2.50)#317 | 6.2%(+1.77)#7,459 |
| 3. | 78413 | 7.9% | 5.5%(+2.42)#329 | 6.2%(+1.69)#7,664 |
| 4. | 78419 | 7.6% | 5.5%(+2.04)#373 | 6.2%(+1.32)#8,610 |
| 5. | 78402 | 6.7% | 5.5%(+1.21)#479 | 6.2%(+0.486)#11,230 |
| 6. | 78412 | 6.4% | 5.5%(+0.848)#530 | 6.2%(+0.122)#12,516 |
| 7. | 78418 | 6.3% | 5.5%(+0.829)#535 | 6.2%(+0.103)#12,580 |
| 8. | 78404 | 5.4% | 5.5%(-0.145)#741 | 6.2%(-0.871)#16,274 |
| 9. | 78415 | 5.3% | 5.5%(-0.244)#766 | 6.2%(-0.970)#16,654 |
| 10. | 78411 | 4.3% | 5.5%(-1.18)#977 | 6.2%(-1.91)#20,213 |
| 11. | 78408 | 3.2% | 5.5%(-2.28)#1,238 | 6.2%(-3.01)#23,669 |
| 12. | 78409 | 2.2% | 5.5%(-3.29)#1,427 | 6.2%(-4.01)#26,037 |
| 13. | 78416 | 2.1% | 5.5%(-3.45)#1,450 | 6.2%(-4.18)#26,347 |
| 14. | 78405 | 1.6% | 5.5%(-3.89)#1,537 | 6.2%(-4.61)#27,036 |
| 15. | 78417 | 1.4% | 5.5%(-4.08)#1,556 | 6.2%(-4.81)#27,296 |
| 16. | 78401 | 0.75% | 5.5%(-4.77)#1,620 | 6.2%(-5.49)#28,101 |
1
Common Questions
What are the Top 10 Zip Codes with the Highest Percentage of Population Employed in Health Diagnosing & Treating in Corpus Christi, TX?
Top 10 Zip Codes with the Highest Percentage of Population Employed in Health Diagnosing & Treating in Corpus Christi, TX are:
What zip code has the Highest Percentage of Population Employed in Health Diagnosing & Treating in Corpus Christi, TX?
78414 has the Highest Percentage of Population Employed in Health Diagnosing & Treating in Corpus Christi, TX with 10.0%.
What is the Percentage of Population Employed in Health Diagnosing & Treating in Corpus Christi, TX?
Percentage of Population Employed in Health Diagnosing & Treating in Corpus Christi is 6.3%.
What is the Percentage of Population Employed in Health Diagnosing & Treating in Texas?
Percentage of Population Employed in Health Diagnosing & Treating in Texas is 5.5%.
What is the Percentage of Population Employed in Health Diagnosing & Treating in the United States?
Percentage of Population Employed in Health Diagnosing & Treating in the United States is 6.2%.