Zip Codes with the Highest Percentage of Population Employed in Health Diagnosing & Treating in Longview, TX
RELATED REPORTS & OPTIONS
Health Diagnosing & Treating
Longview
Compare Zip Codes
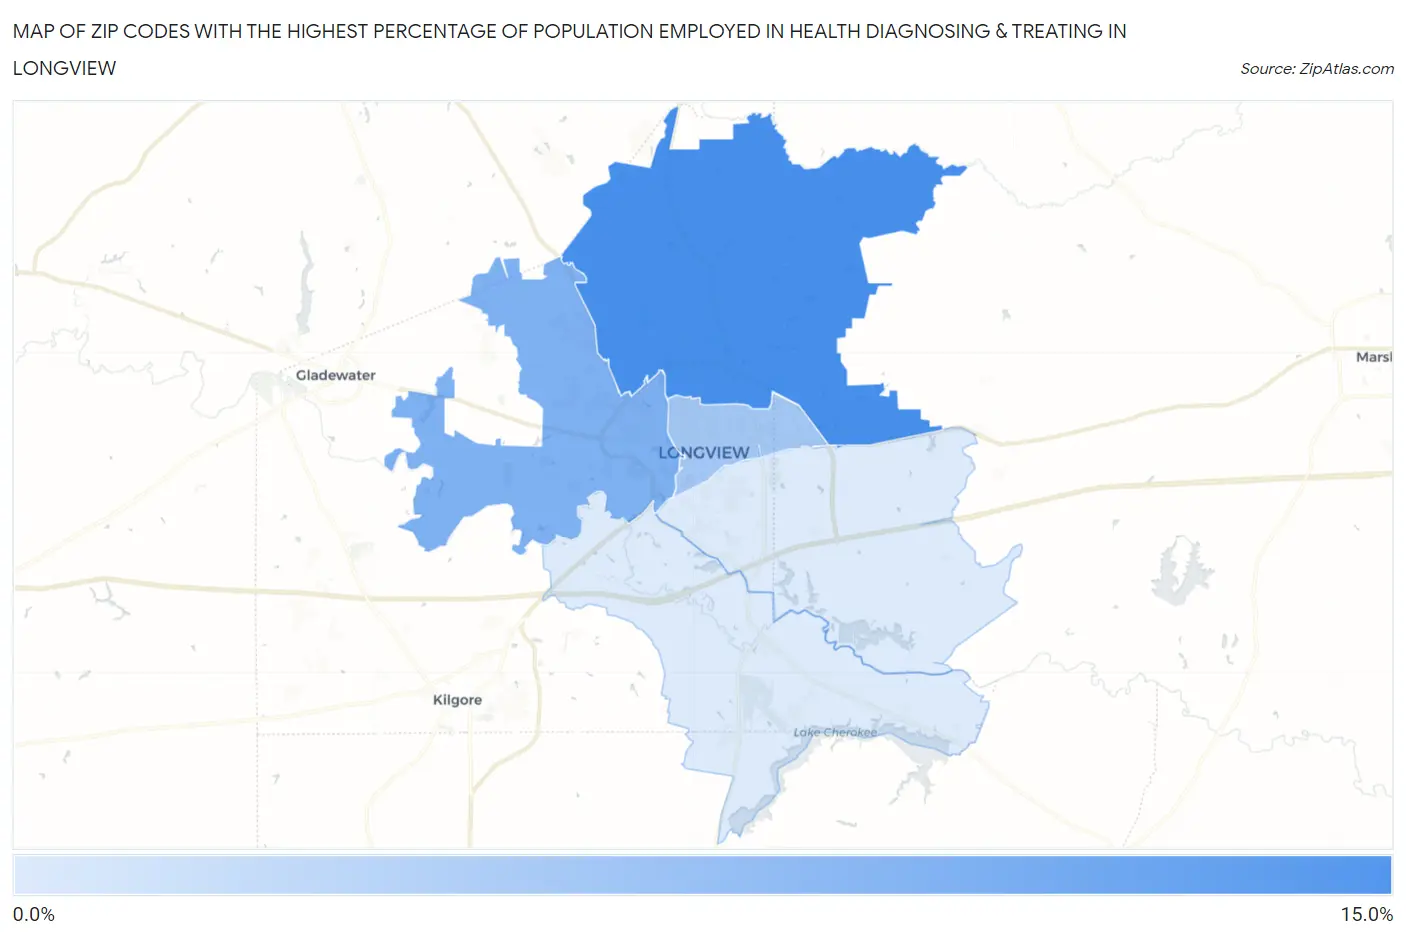
Map of Zip Codes with the Highest Percentage of Population Employed in Health Diagnosing & Treating in Longview
0.0%
15.0%
Zip Codes with the Highest Percentage of Population Employed in Health Diagnosing & Treating in Longview, TX
| Zip Code | % Employed | vs State | vs National | |
| 1. | 75605 | 10.5% | 5.5%(+5.01)#139 | 6.2%(+4.28)#3,290 |
| 2. | 75604 | 7.5% | 5.5%(+1.95)#384 | 6.2%(+1.22)#8,920 |
| 3. | 75601 | 5.5% | 5.5%(+0.003)#707 | 6.2%(-0.723)#15,706 |
| 4. | 75602 | 2.5% | 5.5%(-3.01)#1,385 | 6.2%(-3.73)#25,485 |
| 5. | 75603 | 2.5% | 5.5%(-3.06)#1,395 | 6.2%(-3.79)#25,613 |
1
Common Questions
What are the Top 3 Zip Codes with the Highest Percentage of Population Employed in Health Diagnosing & Treating in Longview, TX?
Top 3 Zip Codes with the Highest Percentage of Population Employed in Health Diagnosing & Treating in Longview, TX are:
What zip code has the Highest Percentage of Population Employed in Health Diagnosing & Treating in Longview, TX?
75605 has the Highest Percentage of Population Employed in Health Diagnosing & Treating in Longview, TX with 10.5%.
What is the Percentage of Population Employed in Health Diagnosing & Treating in Longview, TX?
Percentage of Population Employed in Health Diagnosing & Treating in Longview is 7.1%.
What is the Percentage of Population Employed in Health Diagnosing & Treating in Texas?
Percentage of Population Employed in Health Diagnosing & Treating in Texas is 5.5%.
What is the Percentage of Population Employed in Health Diagnosing & Treating in the United States?
Percentage of Population Employed in Health Diagnosing & Treating in the United States is 6.2%.