Zip Codes with the Highest Percentage of Population with a Degree in Business in Fort Worth, TX

RELATED REPORTS & OPTIONS

Business
Population
Families and Households
Female Fertility
Female Fertility (Unmarried)
Race (Community Size)
Race (Percentage)
Ancestry (Community Size)
AfghanAfricanAlbanianAlsatianAmericanApacheArabArgentineanArmenianAustralianAustrianBahamianBangladeshiBarbadianBasqueBelgianBhutaneseBlackfeetBolivianBrazilianBritishBritish West IndianBulgarianBurmeseCajunCambodianCanadianCelticCentral AmericanCentral American IndianCherokeeCheyenneChickasawChileanChippewaChoctawColombianComancheCosta RicanCreekCroatianCrowCubanCzechCzechoslovakianDanishDelawareDominicanDutchDutch West IndianEastern EuropeanEcuadorianEgyptianEnglishEstonianEthiopianEuropeanFilipinoFinnishFrenchFrench American IndianFrench CanadianGermanGerman RussianGhanaianGreekGuamanian / ChamorroGuatemalanGuyaneseHaitianHonduranHopiHungarianIcelanderIndian (Asian)IndonesianInupiatIranianIraqiIrishIroquoisIsraeliItalianJamaicanJapaneseJordanianKenyanKiowaKoreanLaotianLatvianLebaneseLiberianLithuanianLuxembourgerMalaysianMalteseMexicanMexican American IndianMongolianMoroccanNative HawaiianNavajoNicaraguanNigerianNorthern EuropeanNorwegianOsageOttawaPakistaniPalestinianPanamanianPennsylvania GermanPeruvianPolishPortuguesePotawatomiPuebloPuerto RicanRomanianRussianSalvadoranSamoanScandinavianScotch-IrishScottishSerbianSiouxSlavicSlovakSloveneSomaliSouth AfricanSouth AmericanSouth American IndianSpaniardSpanishSpanish AmericanSpanish American IndianSri LankanSubsaharan AfricanSudaneseSwedishSwissSyrianThaiTonganTrinidadian and TobagonianTurkishUgandanUkrainianVenezuelanVietnameseWelshWest IndianYaquiYugoslavianZimbabwean
Ancestry (Percentage)
AfghanAfricanAlbanianAlsatianAmericanApacheArabArgentineanArmenianAustralianAustrianBahamianBangladeshiBarbadianBasqueBelgianBhutaneseBlackfeetBolivianBrazilianBritishBritish West IndianBulgarianBurmeseCajunCambodianCanadianCelticCentral AmericanCentral American IndianCherokeeCheyenneChickasawChileanChippewaChoctawColombianComancheCosta RicanCreekCroatianCrowCubanCzechCzechoslovakianDanishDelawareDominicanDutchDutch West IndianEastern EuropeanEcuadorianEgyptianEnglishEstonianEthiopianEuropeanFilipinoFinnishFrenchFrench American IndianFrench CanadianGermanGerman RussianGhanaianGreekGuamanian / ChamorroGuatemalanGuyaneseHaitianHonduranHopiHungarianIcelanderIndian (Asian)IndonesianInupiatIranianIraqiIrishIroquoisIsraeliItalianJamaicanJapaneseJordanianKenyanKiowaKoreanLaotianLatvianLebaneseLiberianLithuanianLuxembourgerMalaysianMalteseMexicanMexican American IndianMongolianMoroccanNative HawaiianNavajoNicaraguanNigerianNorthern EuropeanNorwegianOsageOttawaPakistaniPalestinianPanamanianPennsylvania GermanPeruvianPolishPortuguesePotawatomiPuebloPuerto RicanRomanianRussianSalvadoranSamoanScandinavianScotch-IrishScottishSerbianSiouxSlavicSlovakSloveneSomaliSouth AfricanSouth AmericanSouth American IndianSpaniardSpanishSpanish AmericanSpanish American IndianSri LankanSubsaharan AfricanSudaneseSwedishSwissSyrianThaiTonganTrinidadian and TobagonianTurkishUgandanUkrainianVenezuelanVietnameseWelshWest IndianYaquiYugoslavianZimbabwean
Immigrant Origin (Total)
AfghanistanAfricaAlbaniaArgentinaAsiaAustraliaBahamasBangladeshBarbadosBelarusBelizeBoliviaBosnia and HerzegovinaBrazilBulgariaBurma / MyanmarCambodiaCameroonCanadaCaribbeanCentral AmericaChileChinaColombiaCongoCosta RicaCroatiaCubaCzechoslovakiaDominican RepublicEastern AfricaEastern AsiaEastern EuropeEcuadorEgyptEl SalvadorEnglandEritreaEthiopiaEuropeFranceGermanyGhanaGreeceGuatemalaHaitiHondurasHong KongHungaryIndiaIndonesiaIranIraqIrelandIsraelItalyJamaicaJapanJordanKenyaKoreaLaosLatin AmericaLebanonLiberiaMalaysiaMexicoMicronesiaMiddle AfricaMoroccoNepalNetherlandsNicaraguaNigeriaNorthern AfricaNorthern EuropeOceaniaPakistanPanamaPeruPhilippinesPolandPortugalRomaniaRussiaScotlandSenegalSerbiaSomaliaSouth AfricaSouth AmericaSouth Central AsiaSouth Eastern AsiaSouthern EuropeSpainSri LankaSudanSwedenSwitzerlandSyriaTaiwanThailandTrinidad and TobagoTurkeyUgandaUkraineVenezuelaVietnamWestern AfricaWestern AsiaWestern EuropeZaireZimbabwe
Immigrant Origin (Percentage)
AfghanistanAfricaAlbaniaArgentinaAsiaAustraliaBahamasBangladeshBarbadosBelarusBelizeBoliviaBosnia and HerzegovinaBrazilBulgariaBurma / MyanmarCambodiaCameroonCanadaCaribbeanCentral AmericaChileChinaColombiaCongoCosta RicaCroatiaCubaCzechoslovakiaDominican RepublicEastern AfricaEastern AsiaEastern EuropeEcuadorEgyptEl SalvadorEnglandEritreaEthiopiaEuropeFranceGermanyGhanaGreeceGuatemalaHaitiHondurasHong KongHungaryIndiaIndonesiaIranIraqIrelandIsraelItalyJamaicaJapanJordanKenyaKoreaLaosLatin AmericaLebanonLiberiaMalaysiaMexicoMicronesiaMiddle AfricaMoroccoNepalNetherlandsNicaraguaNigeriaNorthern AfricaNorthern EuropeOceaniaPakistanPanamaPeruPhilippinesPolandPortugalRomaniaRussiaScotlandSenegalSerbiaSomaliaSouth AfricaSouth AmericaSouth Central AsiaSouth Eastern AsiaSouthern EuropeSpainSri LankaSudanSwedenSwitzerlandSyriaTaiwanThailandTrinidad and TobagoTurkeyUgandaUkraineVenezuelaVietnamWestern AfricaWestern AsiaWestern EuropeZaireZimbabwe
Income
Income (Families)
Income (Households)
Poverty
Poverty (Families)
Unemployment
Employment Occupations
Employment Industries
Employer Class
Commute Time
Commute Means
School Enrollment
Education by Degree Field
Occupancy
Finances
Physical Characteristics
Fort Worth
Compare Zip Codes
Comparison Subject

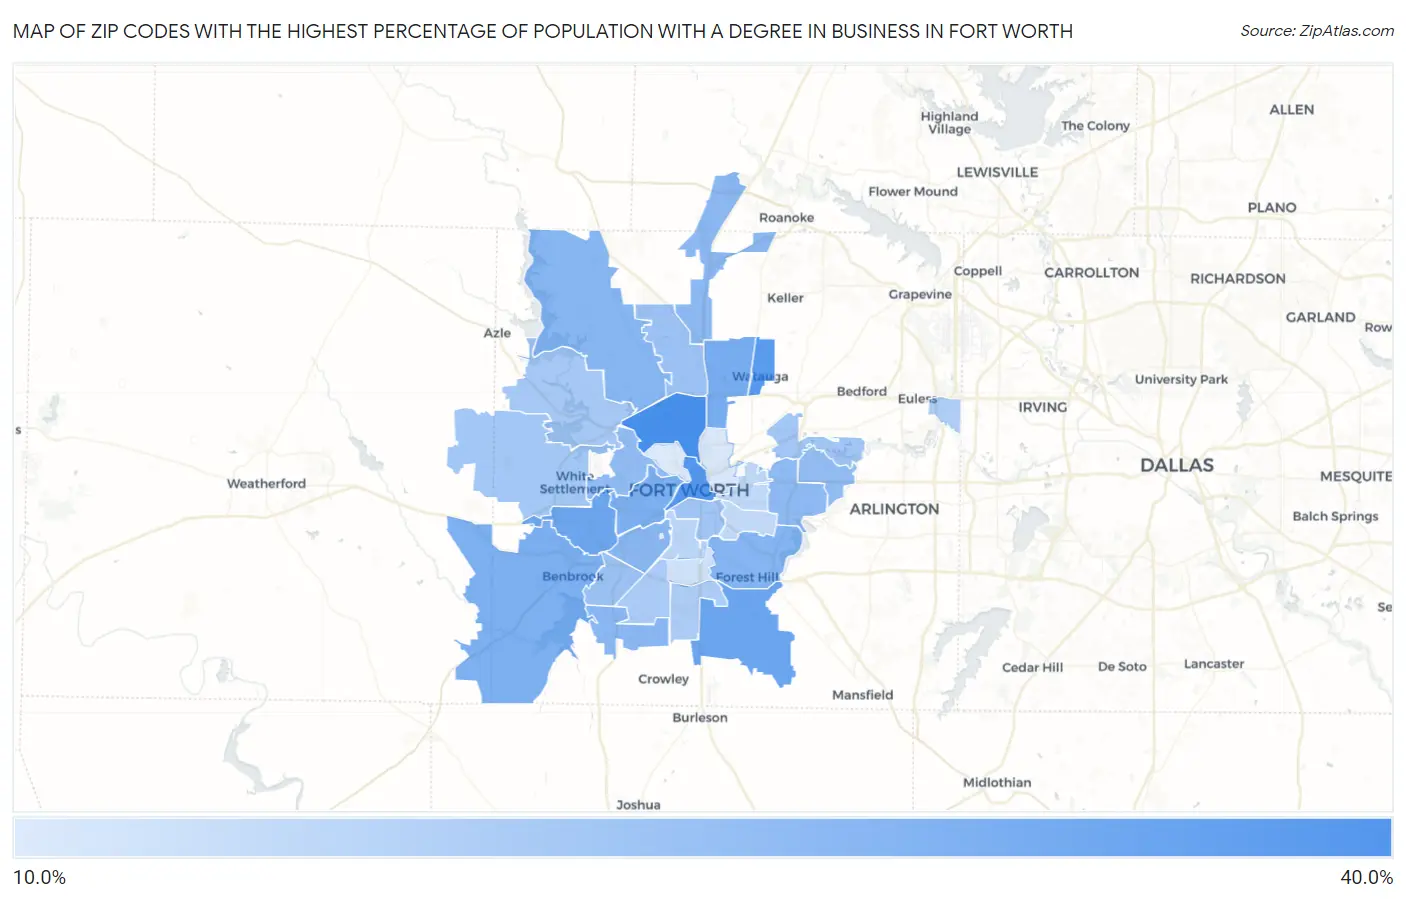
Map of Zip Codes with the Highest Percentage of Population with a Degree in Business in Fort Worth

0.0%
40.0%
Zip Codes with the Highest Percentage of Population with a Degree in Business in Fort Worth Map

Zip Codes with the Highest Percentage of Population with a Degree in Business in Fort Worth, TX

Zip Code % Graduates vs State vs National
1.7610634.0%22.5%(+11.4)#11719.5%(+14.5)#1,884
2.7610232.0%22.5%(+9.44)#14619.5%(+12.5)#2,275
3.7614831.5%22.5%(+8.97)#15819.5%(+12.0)#2,391
4.7614028.6%22.5%(+6.06)#25719.5%(+9.10)#3,364
5.7611628.2%22.5%(+5.70)#27219.5%(+8.74)#3,547
6.7613727.0%22.5%(+4.50)#32819.5%(+7.54)#4,175
7.7612626.3%22.5%(+3.80)#37119.5%(+6.84)#4,647
8.7610726.2%22.5%(+3.68)#38019.5%(+6.73)#4,734
9.7611924.9%22.5%(+2.34)#47319.5%(+5.38)#5,795
10.7617924.6%22.5%(+2.05)#49519.5%(+5.10)#6,035
11.7612324.4%22.5%(+1.81)#51419.5%(+4.85)#6,256
12.7610924.3%22.5%(+1.79)#51619.5%(+4.83)#6,278
13.7617724.2%22.5%(+1.69)#52419.5%(+4.73)#6,372
14.7611223.7%22.5%(+1.20)#56019.5%(+4.24)#6,868
15.7611423.4%22.5%(+0.865)#59119.5%(+3.91)#7,214
16.7612023.0%22.5%(+0.476)#62119.5%(+3.52)#7,647
17.7613222.0%22.5%(-0.540)#69719.5%(+2.50)#8,810
18.7613121.8%22.5%(-0.762)#71919.5%(+2.28)#9,110
19.7610421.4%22.5%(-1.16)#74419.5%(+1.89)#9,638
20.7610821.1%22.5%(-1.47)#76819.5%(+1.58)#10,045
21.7611820.9%22.5%(-1.65)#78419.5%(+1.39)#10,302
22.7613520.5%22.5%(-2.02)#82519.5%(+1.03)#10,847
23.7613320.1%22.5%(-2.44)#85219.5%(+0.601)#11,430
24.7613419.8%22.5%(-2.76)#88519.5%(+0.285)#11,944
25.7615519.5%22.5%(-3.05)#91419.5%(-0.003)#12,380
26.7611017.8%22.5%(-4.78)#1,04519.5%(-1.74)#14,941
27.7610317.3%22.5%(-5.25)#1,09419.5%(-2.20)#15,668
28.7610516.9%22.5%(-5.68)#1,12119.5%(-2.64)#16,348
29.7611515.3%22.5%(-7.21)#1,24319.5%(-4.17)#18,508
30.7611113.9%22.5%(-8.62)#1,32719.5%(-5.58)#20,345
31.7616413.4%22.5%(-9.09)#1,34519.5%(-6.05)#20,921

Common Questions

What are the Top 10 Zip Codes with the Highest Percentage of Population with a Degree in Business in Fort Worth, TX?
Top 10 Zip Codes with the Highest Percentage of Population with a Degree in Business in Fort Worth, TX are:
#1
34.0%
#2
32.0%
#3
31.5%
#4
28.6%
#5
28.2%
#6
27.0%
#7
26.3%
#8
26.2%
#9
24.9%
#10
24.6%
What zip code has the Highest Percentage of Population with a Degree in Business in Fort Worth, TX?
76106 has the Highest Percentage of Population with a Degree in Business in Fort Worth, TX with 34.0%.
What is the Percentage of Population with a Degree in Business in Fort Worth, TX?
Percentage of Population with a Degree in Business in Fort Worth is 24.1%.
What is the Percentage of Population with a Degree in Business in Texas?
Percentage of Population with a Degree in Business in Texas is 22.5%.
What is the Percentage of Population with a Degree in Business in the United States?
Percentage of Population with a Degree in Business in the United States is 19.5%.