Zip Codes with the Highest Percentage of Population Employed in Health Diagnosing & Treating in Spring, TX
RELATED REPORTS & OPTIONS
Health Diagnosing & Treating
Spring
Compare Zip Codes
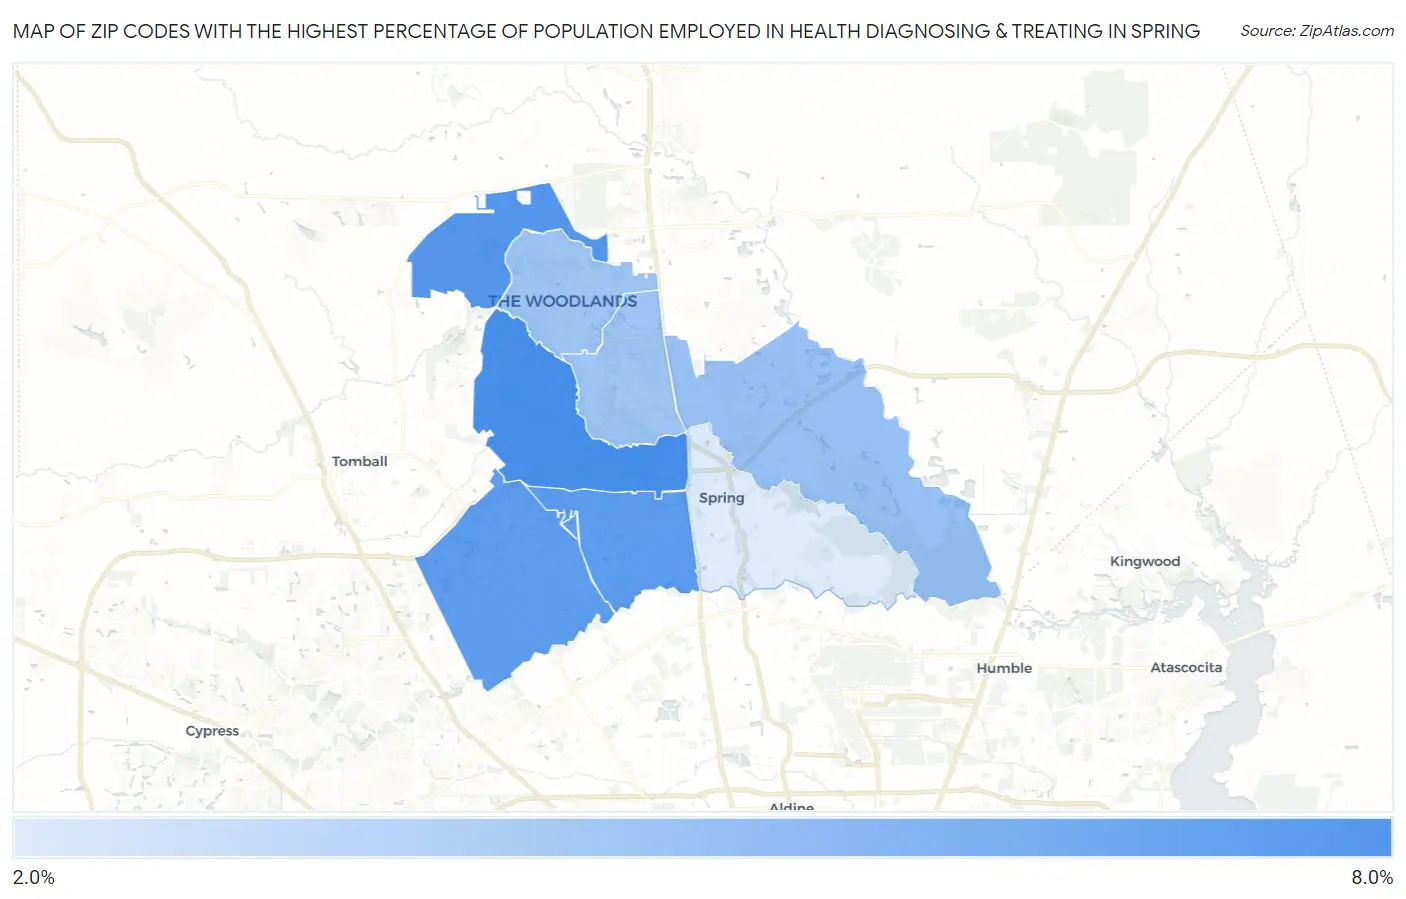
Map of Zip Codes with the Highest Percentage of Population Employed in Health Diagnosing & Treating in Spring
0.0%
8.0%
Zip Codes with the Highest Percentage of Population Employed in Health Diagnosing & Treating in Spring, TX
| Zip Code | % Employed | vs State | vs National | |
| 1. | 77389 | 7.8% | 5.5%(+2.32)#339 | 6.2%(+1.60)#7,902 |
| 2. | 77382 | 7.4% | 5.5%(+1.88)#390 | 6.2%(+1.16)#9,108 |
| 3. | 77388 | 7.2% | 5.5%(+1.73)#418 | 6.2%(+1.00)#9,582 |
| 4. | 77379 | 7.0% | 5.5%(+1.53)#440 | 6.2%(+0.804)#10,201 |
| 5. | 77386 | 5.1% | 5.5%(-0.383)#798 | 6.2%(-1.11)#17,176 |
| 6. | 77380 | 5.0% | 5.5%(-0.543)#832 | 6.2%(-1.27)#17,815 |
| 7. | 77381 | 5.0% | 5.5%(-0.546)#833 | 6.2%(-1.27)#17,828 |
| 8. | 77373 | 2.9% | 5.5%(-2.58)#1,305 | 6.2%(-3.31)#24,484 |
1
Common Questions
What are the Top 5 Zip Codes with the Highest Percentage of Population Employed in Health Diagnosing & Treating in Spring, TX?
Top 5 Zip Codes with the Highest Percentage of Population Employed in Health Diagnosing & Treating in Spring, TX are:
What zip code has the Highest Percentage of Population Employed in Health Diagnosing & Treating in Spring, TX?
77389 has the Highest Percentage of Population Employed in Health Diagnosing & Treating in Spring, TX with 7.8%.
What is the Percentage of Population Employed in Health Diagnosing & Treating in Spring, TX?
Percentage of Population Employed in Health Diagnosing & Treating in Spring is 3.0%.
What is the Percentage of Population Employed in Health Diagnosing & Treating in Texas?
Percentage of Population Employed in Health Diagnosing & Treating in Texas is 5.5%.
What is the Percentage of Population Employed in Health Diagnosing & Treating in the United States?
Percentage of Population Employed in Health Diagnosing & Treating in the United States is 6.2%.