Zip Codes with the Highest Percentage of Not-for-profit Organizations in Fort Worth, TX

RELATED REPORTS & OPTIONS

Not-for-profit Organizations
Population
Families and Households
Female Fertility
Female Fertility (Unmarried)
Race (Community Size)
Race (Percentage)
Ancestry (Community Size)
AfghanAfricanAlbanianAlsatianAmericanApacheArabArgentineanArmenianAustralianAustrianBahamianBangladeshiBarbadianBasqueBelgianBhutaneseBlackfeetBolivianBrazilianBritishBritish West IndianBulgarianBurmeseCajunCambodianCanadianCelticCentral AmericanCentral American IndianCherokeeCheyenneChickasawChileanChippewaChoctawColombianComancheCosta RicanCreekCroatianCrowCubanCzechCzechoslovakianDanishDelawareDominicanDutchDutch West IndianEastern EuropeanEcuadorianEgyptianEnglishEstonianEthiopianEuropeanFilipinoFinnishFrenchFrench American IndianFrench CanadianGermanGerman RussianGhanaianGreekGuamanian / ChamorroGuatemalanGuyaneseHaitianHonduranHopiHungarianIcelanderIndian (Asian)IndonesianInupiatIranianIraqiIrishIroquoisIsraeliItalianJamaicanJapaneseJordanianKenyanKiowaKoreanLaotianLatvianLebaneseLiberianLithuanianLuxembourgerMalaysianMalteseMexicanMexican American IndianMongolianMoroccanNative HawaiianNavajoNicaraguanNigerianNorthern EuropeanNorwegianOsageOttawaPakistaniPalestinianPanamanianPennsylvania GermanPeruvianPolishPortuguesePotawatomiPuebloPuerto RicanRomanianRussianSalvadoranSamoanScandinavianScotch-IrishScottishSerbianSiouxSlavicSlovakSloveneSomaliSouth AfricanSouth AmericanSouth American IndianSpaniardSpanishSpanish AmericanSpanish American IndianSri LankanSubsaharan AfricanSudaneseSwedishSwissSyrianThaiTonganTrinidadian and TobagonianTurkishUgandanUkrainianVenezuelanVietnameseWelshWest IndianYaquiYugoslavianZimbabwean
Ancestry (Percentage)
AfghanAfricanAlbanianAlsatianAmericanApacheArabArgentineanArmenianAustralianAustrianBahamianBangladeshiBarbadianBasqueBelgianBhutaneseBlackfeetBolivianBrazilianBritishBritish West IndianBulgarianBurmeseCajunCambodianCanadianCelticCentral AmericanCentral American IndianCherokeeCheyenneChickasawChileanChippewaChoctawColombianComancheCosta RicanCreekCroatianCrowCubanCzechCzechoslovakianDanishDelawareDominicanDutchDutch West IndianEastern EuropeanEcuadorianEgyptianEnglishEstonianEthiopianEuropeanFilipinoFinnishFrenchFrench American IndianFrench CanadianGermanGerman RussianGhanaianGreekGuamanian / ChamorroGuatemalanGuyaneseHaitianHonduranHopiHungarianIcelanderIndian (Asian)IndonesianInupiatIranianIraqiIrishIroquoisIsraeliItalianJamaicanJapaneseJordanianKenyanKiowaKoreanLaotianLatvianLebaneseLiberianLithuanianLuxembourgerMalaysianMalteseMexicanMexican American IndianMongolianMoroccanNative HawaiianNavajoNicaraguanNigerianNorthern EuropeanNorwegianOsageOttawaPakistaniPalestinianPanamanianPennsylvania GermanPeruvianPolishPortuguesePotawatomiPuebloPuerto RicanRomanianRussianSalvadoranSamoanScandinavianScotch-IrishScottishSerbianSiouxSlavicSlovakSloveneSomaliSouth AfricanSouth AmericanSouth American IndianSpaniardSpanishSpanish AmericanSpanish American IndianSri LankanSubsaharan AfricanSudaneseSwedishSwissSyrianThaiTonganTrinidadian and TobagonianTurkishUgandanUkrainianVenezuelanVietnameseWelshWest IndianYaquiYugoslavianZimbabwean
Immigrant Origin (Total)
AfghanistanAfricaAlbaniaArgentinaAsiaAustraliaBahamasBangladeshBarbadosBelarusBelizeBoliviaBosnia and HerzegovinaBrazilBulgariaBurma / MyanmarCambodiaCameroonCanadaCaribbeanCentral AmericaChileChinaColombiaCongoCosta RicaCroatiaCubaCzechoslovakiaDominican RepublicEastern AfricaEastern AsiaEastern EuropeEcuadorEgyptEl SalvadorEnglandEritreaEthiopiaEuropeFranceGermanyGhanaGreeceGuatemalaHaitiHondurasHong KongHungaryIndiaIndonesiaIranIraqIrelandIsraelItalyJamaicaJapanJordanKenyaKoreaLaosLatin AmericaLebanonLiberiaMalaysiaMexicoMicronesiaMiddle AfricaMoroccoNepalNetherlandsNicaraguaNigeriaNorthern AfricaNorthern EuropeOceaniaPakistanPanamaPeruPhilippinesPolandPortugalRomaniaRussiaScotlandSenegalSerbiaSomaliaSouth AfricaSouth AmericaSouth Central AsiaSouth Eastern AsiaSouthern EuropeSpainSri LankaSudanSwedenSwitzerlandSyriaTaiwanThailandTrinidad and TobagoTurkeyUgandaUkraineVenezuelaVietnamWestern AfricaWestern AsiaWestern EuropeZaireZimbabwe
Immigrant Origin (Percentage)
AfghanistanAfricaAlbaniaArgentinaAsiaAustraliaBahamasBangladeshBarbadosBelarusBelizeBoliviaBosnia and HerzegovinaBrazilBulgariaBurma / MyanmarCambodiaCameroonCanadaCaribbeanCentral AmericaChileChinaColombiaCongoCosta RicaCroatiaCubaCzechoslovakiaDominican RepublicEastern AfricaEastern AsiaEastern EuropeEcuadorEgyptEl SalvadorEnglandEritreaEthiopiaEuropeFranceGermanyGhanaGreeceGuatemalaHaitiHondurasHong KongHungaryIndiaIndonesiaIranIraqIrelandIsraelItalyJamaicaJapanJordanKenyaKoreaLaosLatin AmericaLebanonLiberiaMalaysiaMexicoMicronesiaMiddle AfricaMoroccoNepalNetherlandsNicaraguaNigeriaNorthern AfricaNorthern EuropeOceaniaPakistanPanamaPeruPhilippinesPolandPortugalRomaniaRussiaScotlandSenegalSerbiaSomaliaSouth AfricaSouth AmericaSouth Central AsiaSouth Eastern AsiaSouthern EuropeSpainSri LankaSudanSwedenSwitzerlandSyriaTaiwanThailandTrinidad and TobagoTurkeyUgandaUkraineVenezuelaVietnamWestern AfricaWestern AsiaWestern EuropeZaireZimbabwe
Income
Income (Families)
Income (Households)
Poverty
Poverty (Families)
Unemployment
Employment Occupations
Employment Industries
Employer Class
Commute Time
Commute Means
School Enrollment
Education by Degree Field
Occupancy
Finances
Physical Characteristics
Fort Worth
Compare Zip Codes
Comparison Subject

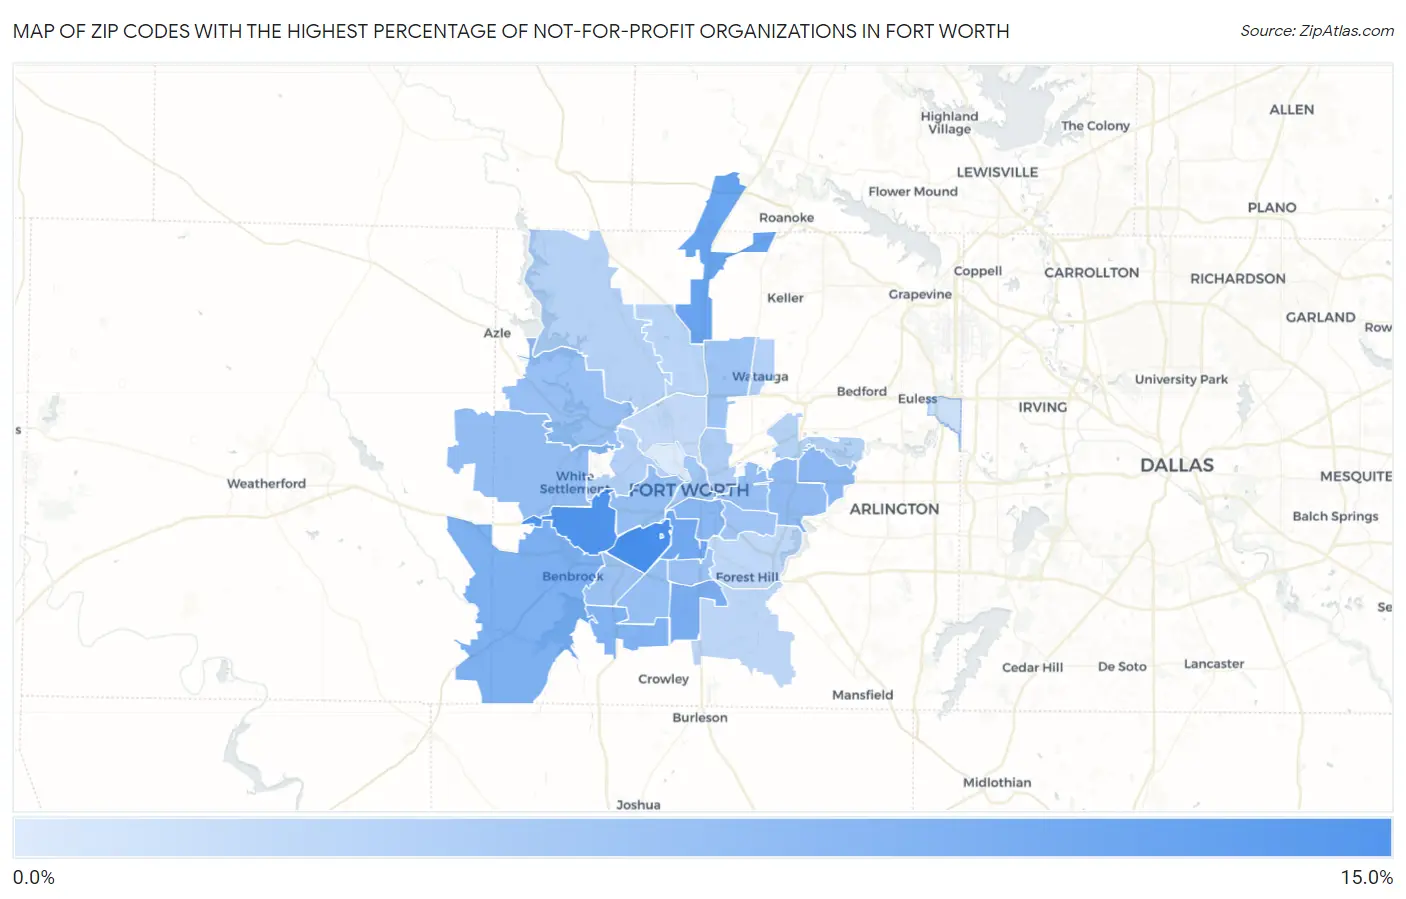
Map of Zip Codes with the Highest Percentage of Not-for-profit Organizations in Fort Worth

0.0%
15.0%
Zip Codes with the Highest Percentage of Not-for-profit Organizations in Fort Worth Map

Zip Codes with the Highest Percentage of Not-for-profit Organizations in Fort Worth, TX

Zip Code % Employed in Not-for-profit vs State vs National
1.7610912.2%5.8%(+6.40)#1198.4%(+3.71)#5,428
2.7611611.4%5.8%(+5.69)#1388.4%(+3.00)#6,387
3.761779.8%5.8%(+4.06)#1888.4%(+1.37)#9,278
4.761109.3%5.8%(+3.51)#2188.4%(+0.822)#10,429
5.761348.7%5.8%(+2.91)#2558.4%(+0.230)#11,864
6.761268.4%5.8%(+2.66)#2818.4%(-0.028)#12,511
7.761238.1%5.8%(+2.35)#3148.4%(-0.337)#13,342
8.761047.6%5.8%(+1.80)#3808.4%(-0.881)#14,886
9.761207.3%5.8%(+1.57)#4108.4%(-1.11)#15,591
10.761127.1%5.8%(+1.30)#4538.4%(-1.39)#16,406
11.761086.9%5.8%(+1.17)#4778.4%(-1.52)#16,791
12.761336.8%5.8%(+1.05)#4928.4%(-1.64)#17,132
13.761076.8%5.8%(+1.02)#5008.4%(-1.67)#17,220
14.761296.7%5.8%(+0.907)#5268.4%(-1.78)#17,566
15.761036.6%5.8%(+0.867)#5338.4%(-1.82)#17,671
16.761356.6%5.8%(+0.841)#5398.4%(-1.84)#17,748
17.761326.4%5.8%(+0.649)#5778.4%(-2.04)#18,299
18.761156.3%5.8%(+0.542)#6038.4%(-2.14)#18,627
19.761376.2%5.8%(+0.392)#6268.4%(-2.29)#19,030
20.761055.9%5.8%(+0.168)#6618.4%(-2.52)#19,675
21.761025.8%5.8%(+0.083)#6798.4%(-2.60)#19,929
22.761115.0%5.8%(-0.718)#8688.4%(-3.40)#22,234
23.761484.8%5.8%(-0.939)#9148.4%(-3.62)#22,773
24.761144.7%5.8%(-1.05)#9428.4%(-3.74)#23,050
25.761184.7%5.8%(-1.07)#9528.4%(-3.76)#23,116
26.761794.6%5.8%(-1.15)#9728.4%(-3.83)#23,280
27.761314.4%5.8%(-1.39)#1,0428.4%(-4.07)#23,866
28.761404.2%5.8%(-1.56)#1,0928.4%(-4.25)#24,255
29.761194.0%5.8%(-1.74)#1,1398.4%(-4.43)#24,647
30.761063.8%5.8%(-1.93)#1,1788.4%(-4.61)#25,040
31.761553.1%5.8%(-2.67)#1,3428.4%(-5.35)#26,467
32.761642.1%5.8%(-3.68)#1,5038.4%(-6.36)#27,892

Common Questions

What are the Top 10 Zip Codes with the Highest Percentage of Not-for-profit Organizations in Fort Worth, TX?
Top 10 Zip Codes with the Highest Percentage of Not-for-profit Organizations in Fort Worth, TX are:
#1
12.2%
#2
11.4%
#3
9.8%
#4
9.3%
#5
8.7%
#6
8.4%
#7
8.1%
#8
7.6%
#9
7.3%
#10
7.1%
What zip code has the Highest Percentage of Not-for-profit Organizations in Fort Worth, TX?
76109 has the Highest Percentage of Not-for-profit Organizations in Fort Worth, TX with 12.2%.
What is the Percentage of Not-for-profit Organizations in Fort Worth, TX?
Percentage of Not-for-profit Organizations in Fort Worth is 6.7%.
What is the Percentage of Not-for-profit Organizations in Texas?
Percentage of Not-for-profit Organizations in Texas is 5.8%.
What is the Percentage of Not-for-profit Organizations in the United States?
Percentage of Not-for-profit Organizations in the United States is 8.4%.