Zip Codes with the Highest Percentage of Population Employed in Health Diagnosing & Treating in College Station, TX
RELATED REPORTS & OPTIONS
Health Diagnosing & Treating
College Station
Compare Zip Codes
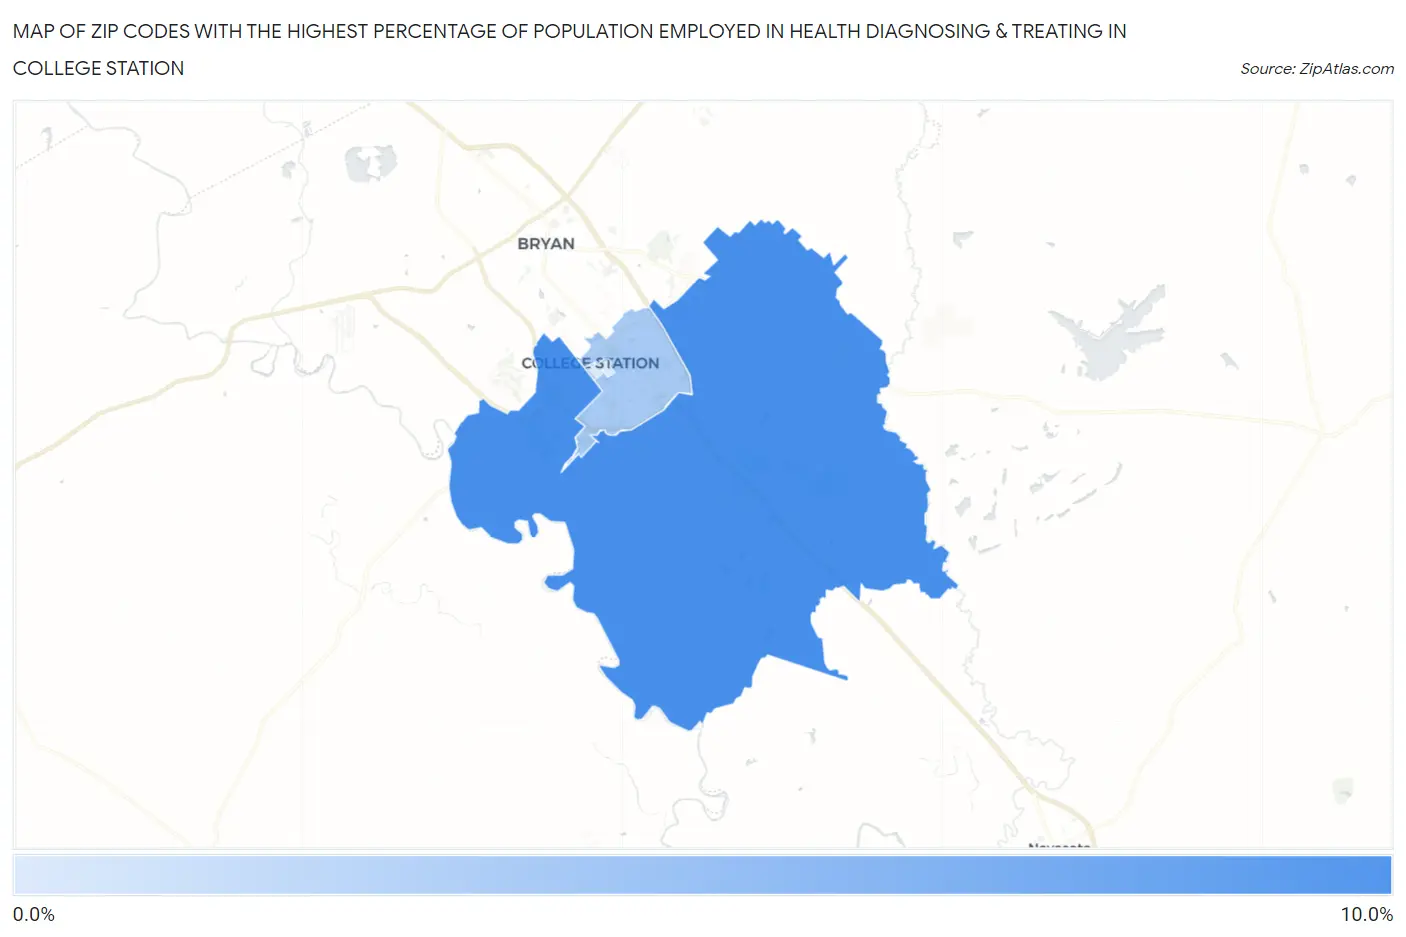
Map of Zip Codes with the Highest Percentage of Population Employed in Health Diagnosing & Treating in College Station
0.0%
10.0%
Zip Codes with the Highest Percentage of Population Employed in Health Diagnosing & Treating in College Station, TX
| Zip Code | % Employed | vs State | vs National | |
| 1. | 77845 | 8.4% | 5.5%(+2.87)#266 | 6.2%(+2.14)#6,550 |
| 2. | 77840 | 3.5% | 5.5%(-1.99)#1,172 | 6.2%(-2.72)#22,828 |
| 3. | 77843 | 0.96% | 5.5%(-4.56)#1,601 | 6.2%(-5.29)#27,899 |
1
Common Questions
What are the Top Zip Codes with the Highest Percentage of Population Employed in Health Diagnosing & Treating in College Station, TX?
Top Zip Codes with the Highest Percentage of Population Employed in Health Diagnosing & Treating in College Station, TX are:
What zip code has the Highest Percentage of Population Employed in Health Diagnosing & Treating in College Station, TX?
77845 has the Highest Percentage of Population Employed in Health Diagnosing & Treating in College Station, TX with 8.4%.
What is the Percentage of Population Employed in Health Diagnosing & Treating in College Station, TX?
Percentage of Population Employed in Health Diagnosing & Treating in College Station is 5.6%.
What is the Percentage of Population Employed in Health Diagnosing & Treating in Texas?
Percentage of Population Employed in Health Diagnosing & Treating in Texas is 5.5%.
What is the Percentage of Population Employed in Health Diagnosing & Treating in the United States?
Percentage of Population Employed in Health Diagnosing & Treating in the United States is 6.2%.