Zip Codes with the Highest Percentage of Population Employed in Health Diagnosing & Treating in Boerne, TX
RELATED REPORTS & OPTIONS
Health Diagnosing & Treating
Boerne
Compare Zip Codes
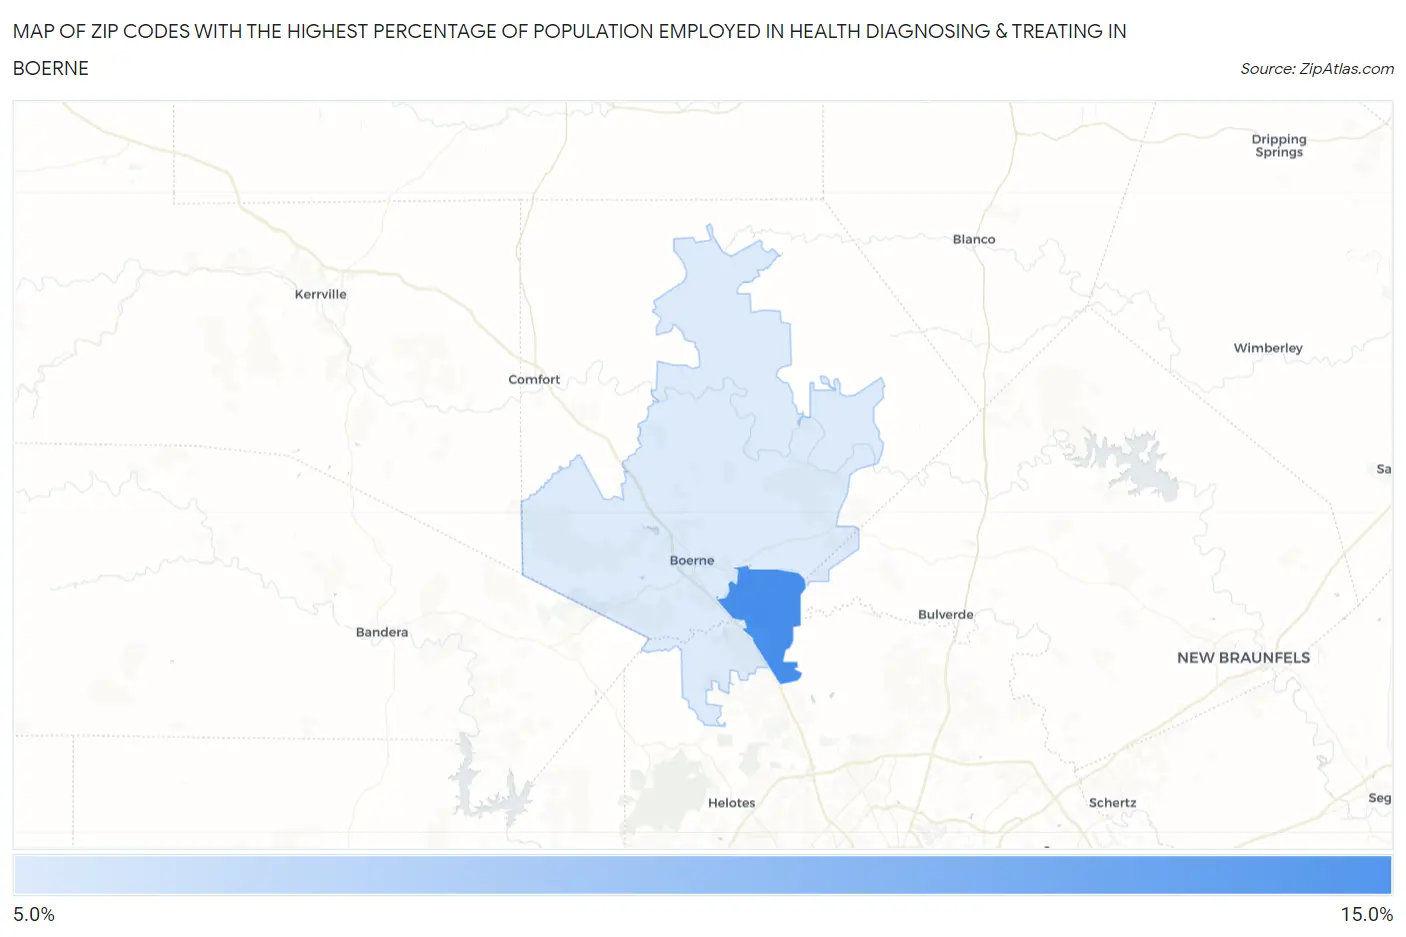
Map of Zip Codes with the Highest Percentage of Population Employed in Health Diagnosing & Treating in Boerne
0.0%
15.0%
Zip Codes with the Highest Percentage of Population Employed in Health Diagnosing & Treating in Boerne, TX
| Zip Code | % Employed | vs State | vs National | |
| 1. | 78015 | 11.4% | 5.5%(+5.89)#108 | 6.2%(+5.16)#2,587 |
| 2. | 78006 | 8.2% | 5.5%(+2.64)#294 | 6.2%(+1.92)#7,106 |
1
Common Questions
What are the Top Zip Codes with the Highest Percentage of Population Employed in Health Diagnosing & Treating in Boerne, TX?
Top Zip Codes with the Highest Percentage of Population Employed in Health Diagnosing & Treating in Boerne, TX are:
What zip code has the Highest Percentage of Population Employed in Health Diagnosing & Treating in Boerne, TX?
78015 has the Highest Percentage of Population Employed in Health Diagnosing & Treating in Boerne, TX with 11.4%.
What is the Percentage of Population Employed in Health Diagnosing & Treating in Boerne, TX?
Percentage of Population Employed in Health Diagnosing & Treating in Boerne is 6.2%.
What is the Percentage of Population Employed in Health Diagnosing & Treating in Texas?
Percentage of Population Employed in Health Diagnosing & Treating in Texas is 5.5%.
What is the Percentage of Population Employed in Health Diagnosing & Treating in the United States?
Percentage of Population Employed in Health Diagnosing & Treating in the United States is 6.2%.