Zip Codes with the Highest Percentage of Population Employed in Administrative & Support Services in Fort Worth, TX
RELATED REPORTS & OPTIONS
Administrative & Support Services
Fort Worth
Compare Zip Codes
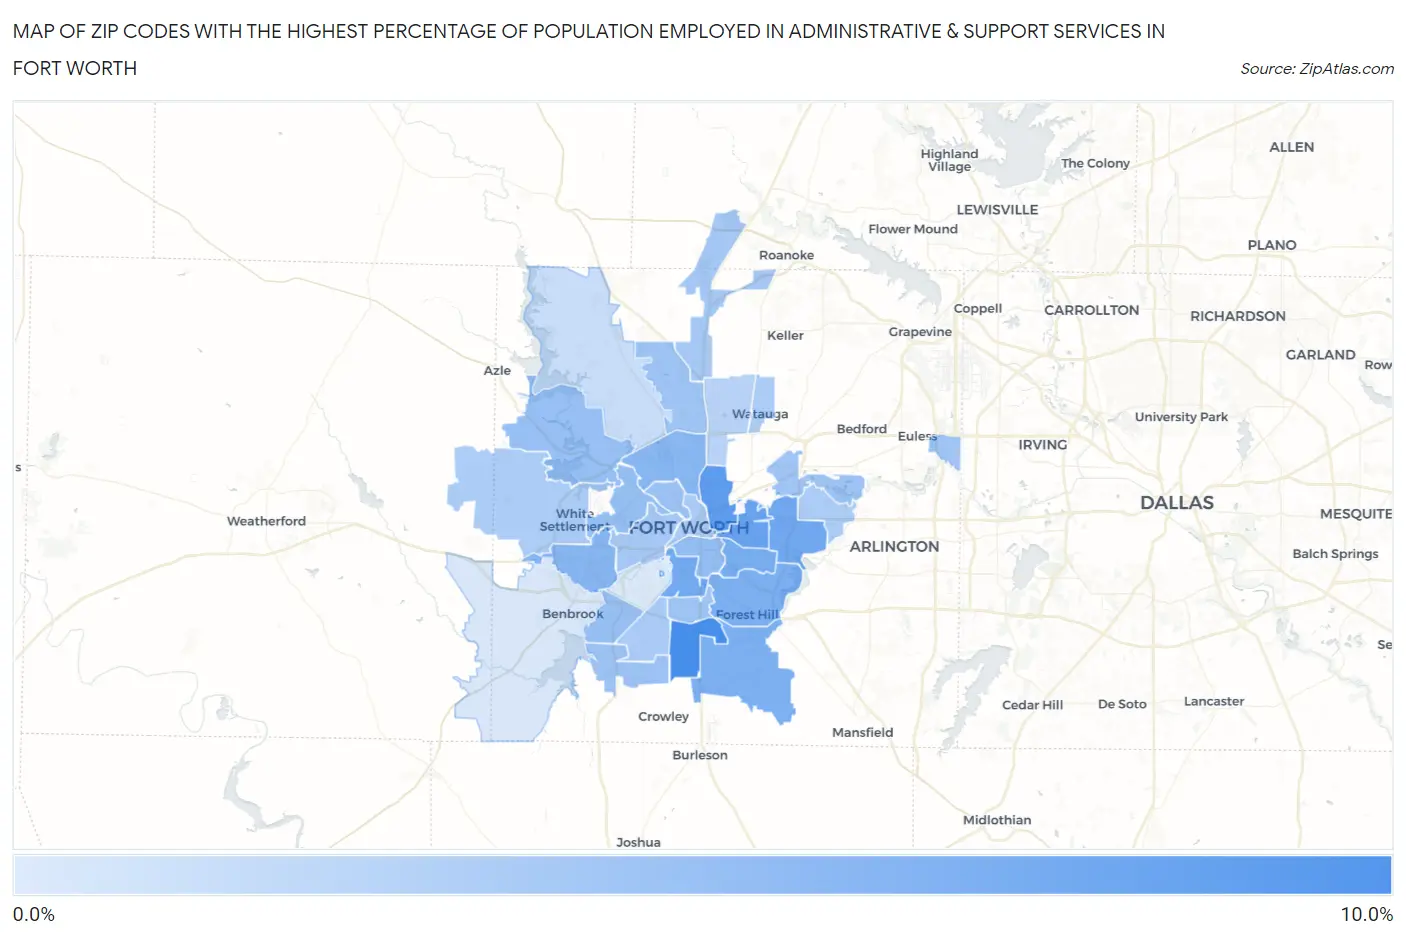
Map of Zip Codes with the Highest Percentage of Population Employed in Administrative & Support Services in Fort Worth
0.0%
10.0%
Zip Codes with the Highest Percentage of Population Employed in Administrative & Support Services in Fort Worth, TX
| Zip Code | % Employed | vs State | vs National | |
| 1. | 76134 | 8.8% | 4.4%(+4.42)#116 | 4.1%(+4.69)#1,773 |
| 2. | 76111 | 7.7% | 4.4%(+3.29)#176 | 4.1%(+3.56)#2,507 |
| 3. | 76103 | 7.3% | 4.4%(+2.92)#201 | 4.1%(+3.19)#2,853 |
| 4. | 76112 | 6.8% | 4.4%(+2.42)#250 | 4.1%(+2.69)#3,429 |
| 5. | 76110 | 6.8% | 4.4%(+2.37)#255 | 4.1%(+2.63)#3,497 |
| 6. | 76105 | 6.5% | 4.4%(+2.08)#288 | 4.1%(+2.35)#3,907 |
| 7. | 76119 | 6.3% | 4.4%(+1.85)#316 | 4.1%(+2.11)#4,301 |
| 8. | 76140 | 6.3% | 4.4%(+1.84)#317 | 4.1%(+2.11)#4,306 |
| 9. | 76116 | 5.8% | 4.4%(+1.34)#396 | 4.1%(+1.60)#5,255 |
| 10. | 76106 | 5.7% | 4.4%(+1.32)#397 | 4.1%(+1.59)#5,286 |
| 11. | 76104 | 5.2% | 4.4%(+0.772)#488 | 4.1%(+1.04)#6,619 |
| 12. | 76114 | 5.1% | 4.4%(+0.711)#499 | 4.1%(+0.977)#6,775 |
| 13. | 76135 | 5.0% | 4.4%(+0.608)#514 | 4.1%(+0.874)#7,037 |
| 14. | 76132 | 5.0% | 4.4%(+0.565)#524 | 4.1%(+0.832)#7,164 |
| 15. | 76164 | 4.8% | 4.4%(+0.406)#562 | 4.1%(+0.672)#7,658 |
| 16. | 76123 | 4.8% | 4.4%(+0.393)#565 | 4.1%(+0.659)#7,700 |
| 17. | 76115 | 4.7% | 4.4%(+0.299)#587 | 4.1%(+0.565)#7,982 |
| 18. | 76155 | 4.7% | 4.4%(+0.275)#591 | 4.1%(+0.541)#8,065 |
| 19. | 76131 | 4.7% | 4.4%(+0.241)#598 | 4.1%(+0.507)#8,165 |
| 20. | 76118 | 4.6% | 4.4%(+0.180)#606 | 4.1%(+0.446)#8,394 |
| 21. | 76107 | 4.4% | 4.4%(-0.052)#651 | 4.1%(+0.214)#9,223 |
| 22. | 76177 | 4.4% | 4.4%(-0.060)#654 | 4.1%(+0.206)#9,262 |
| 23. | 76133 | 4.1% | 4.4%(-0.290)#712 | 4.1%(-0.024)#10,133 |
| 24. | 76102 | 4.1% | 4.4%(-0.308)#716 | 4.1%(-0.042)#10,209 |
| 25. | 76108 | 4.1% | 4.4%(-0.334)#727 | 4.1%(-0.068)#10,316 |
| 26. | 76120 | 4.1% | 4.4%(-0.338)#728 | 4.1%(-0.072)#10,346 |
| 27. | 76148 | 4.0% | 4.4%(-0.422)#746 | 4.1%(-0.156)#10,724 |
| 28. | 76137 | 3.5% | 4.4%(-0.918)#878 | 4.1%(-0.652)#12,981 |
| 29. | 76179 | 2.8% | 4.4%(-1.60)#1,080 | 4.1%(-1.33)#16,439 |
| 30. | 76126 | 2.1% | 4.4%(-2.33)#1,258 | 4.1%(-2.07)#20,223 |
| 31. | 76109 | 1.8% | 4.4%(-2.59)#1,317 | 4.1%(-2.33)#21,419 |
1
Common Questions
What are the Top 10 Zip Codes with the Highest Percentage of Population Employed in Administrative & Support Services in Fort Worth, TX?
Top 10 Zip Codes with the Highest Percentage of Population Employed in Administrative & Support Services in Fort Worth, TX are:
What zip code has the Highest Percentage of Population Employed in Administrative & Support Services in Fort Worth, TX?
76134 has the Highest Percentage of Population Employed in Administrative & Support Services in Fort Worth, TX with 8.8%.
What is the Percentage of Population Employed in Administrative & Support Services in Fort Worth, TX?
Percentage of Population Employed in Administrative & Support Services in Fort Worth is 4.8%.
What is the Percentage of Population Employed in Administrative & Support Services in Texas?
Percentage of Population Employed in Administrative & Support Services in Texas is 4.4%.
What is the Percentage of Population Employed in Administrative & Support Services in the United States?
Percentage of Population Employed in Administrative & Support Services in the United States is 4.1%.