Zip Codes with the Highest Percentage of Population Employed in Mining, Quarrying, & Extraction in Fort Worth, TX
RELATED REPORTS & OPTIONS
Mining, Quarrying, & Extraction
Fort Worth
Compare Zip Codes
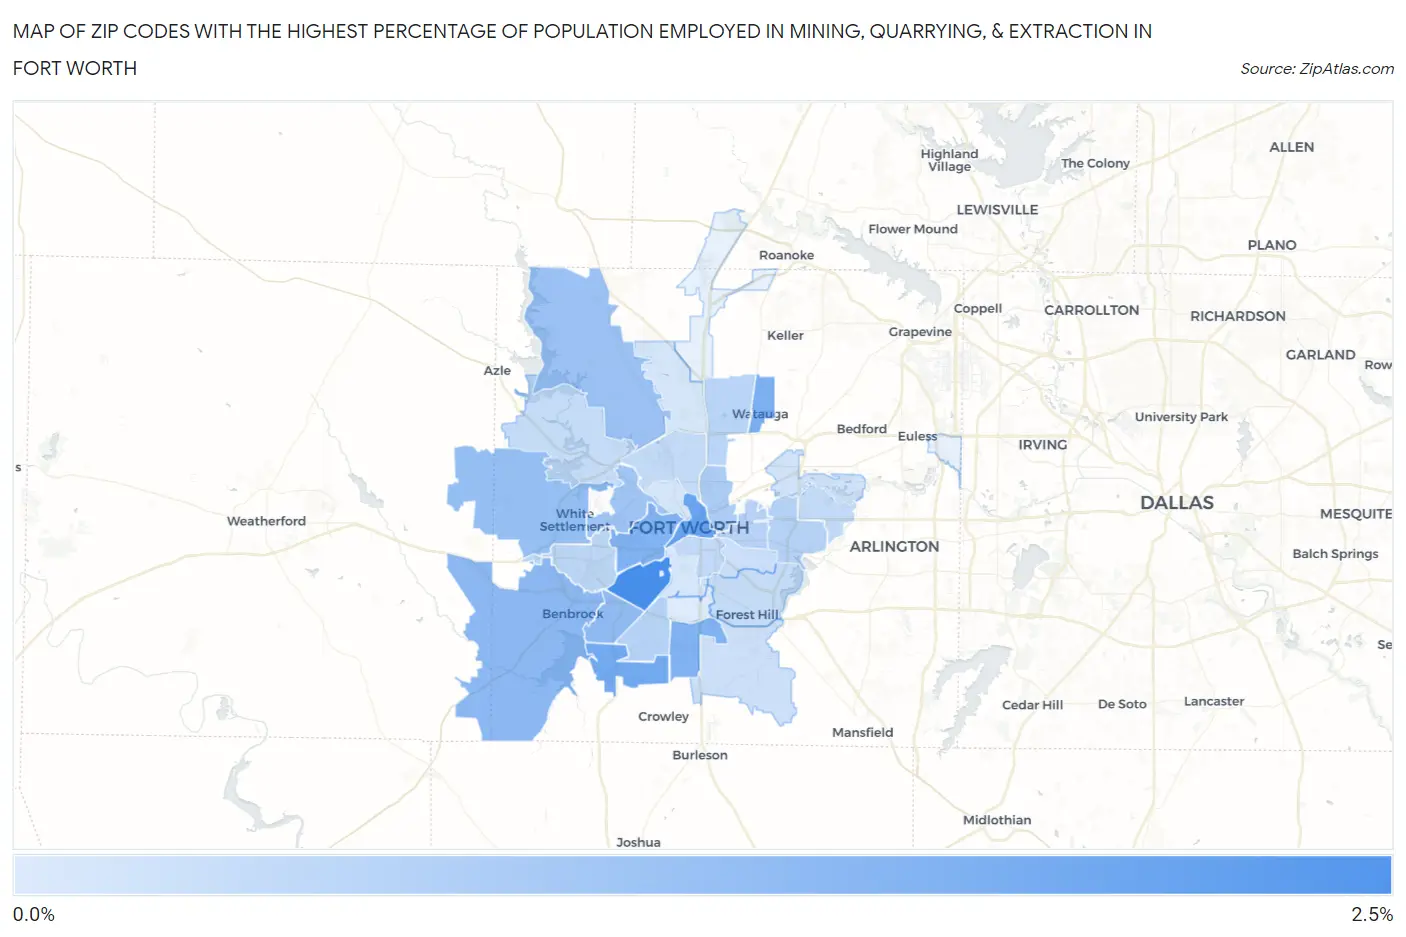
Map of Zip Codes with the Highest Percentage of Population Employed in Mining, Quarrying, & Extraction in Fort Worth
0.0%
2.5%
Zip Codes with the Highest Percentage of Population Employed in Mining, Quarrying, & Extraction in Fort Worth, TX
| Zip Code | % Employed | vs State | vs National | |
| 1. | 76109 | 2.4% | 1.9%(+0.554)#579 | 0.44%(+1.97)#3,224 |
| 2. | 76102 | 1.9% | 1.9%(+0.015)#689 | 0.44%(+1.43)#3,812 |
| 3. | 76123 | 1.7% | 1.9%(-0.135)#718 | 0.44%(+1.28)#3,999 |
| 4. | 76148 | 1.6% | 1.9%(-0.297)#766 | 0.44%(+1.12)#4,266 |
| 5. | 76134 | 1.5% | 1.9%(-0.349)#786 | 0.44%(+1.06)#4,352 |
| 6. | 76107 | 1.5% | 1.9%(-0.358)#789 | 0.44%(+1.06)#4,366 |
| 7. | 76126 | 1.3% | 1.9%(-0.528)#827 | 0.44%(+0.886)#4,665 |
| 8. | 76132 | 1.2% | 1.9%(-0.609)#850 | 0.44%(+0.805)#4,813 |
| 9. | 76108 | 1.2% | 1.9%(-0.689)#868 | 0.44%(+0.725)#4,975 |
| 10. | 76179 | 1.0% | 1.9%(-0.805)#911 | 0.44%(+0.608)#5,259 |
| 11. | 76114 | 0.99% | 1.9%(-0.860)#939 | 0.44%(+0.553)#5,400 |
| 12. | 76111 | 0.79% | 1.9%(-1.06)#1,037 | 0.44%(+0.349)#6,016 |
| 13. | 76112 | 0.66% | 1.9%(-1.20)#1,117 | 0.44%(+0.216)#6,527 |
| 14. | 76133 | 0.65% | 1.9%(-1.21)#1,125 | 0.44%(+0.206)#6,563 |
| 15. | 76103 | 0.61% | 1.9%(-1.24)#1,147 | 0.44%(+0.171)#6,719 |
| 16. | 76137 | 0.58% | 1.9%(-1.28)#1,162 | 0.44%(+0.137)#6,850 |
| 17. | 76116 | 0.55% | 1.9%(-1.31)#1,181 | 0.44%(+0.109)#6,972 |
| 18. | 76104 | 0.49% | 1.9%(-1.36)#1,216 | 0.44%(+0.051)#7,231 |
| 19. | 76120 | 0.44% | 1.9%(-1.41)#1,244 | 0.44%(+0.003)#7,516 |
| 20. | 76106 | 0.44% | 1.9%(-1.41)#1,245 | 0.44%(+0.002)#7,520 |
| 21. | 76119 | 0.40% | 1.9%(-1.45)#1,269 | 0.44%(-0.037)#7,758 |
| 22. | 76135 | 0.40% | 1.9%(-1.46)#1,275 | 0.44%(-0.045)#7,815 |
| 23. | 76105 | 0.32% | 1.9%(-1.53)#1,326 | 0.44%(-0.118)#8,337 |
| 24. | 76140 | 0.31% | 1.9%(-1.54)#1,334 | 0.44%(-0.126)#8,403 |
| 25. | 76118 | 0.22% | 1.9%(-1.64)#1,398 | 0.44%(-0.224)#9,342 |
| 26. | 76164 | 0.17% | 1.9%(-1.68)#1,426 | 0.44%(-0.268)#9,827 |
| 27. | 76131 | 0.17% | 1.9%(-1.68)#1,427 | 0.44%(-0.269)#9,842 |
| 28. | 76110 | 0.17% | 1.9%(-1.69)#1,428 | 0.44%(-0.274)#9,897 |
| 29. | 76115 | 0.047% | 1.9%(-1.81)#1,470 | 0.44%(-0.393)#11,696 |
1
Common Questions
What are the Top 10 Zip Codes with the Highest Percentage of Population Employed in Mining, Quarrying, & Extraction in Fort Worth, TX?
Top 10 Zip Codes with the Highest Percentage of Population Employed in Mining, Quarrying, & Extraction in Fort Worth, TX are:
What zip code has the Highest Percentage of Population Employed in Mining, Quarrying, & Extraction in Fort Worth, TX?
76109 has the Highest Percentage of Population Employed in Mining, Quarrying, & Extraction in Fort Worth, TX with 2.4%.
What is the Percentage of Population Employed in Mining, Quarrying, & Extraction in Fort Worth, TX?
Percentage of Population Employed in Mining, Quarrying, & Extraction in Fort Worth is 0.77%.
What is the Percentage of Population Employed in Mining, Quarrying, & Extraction in Texas?
Percentage of Population Employed in Mining, Quarrying, & Extraction in Texas is 1.9%.
What is the Percentage of Population Employed in Mining, Quarrying, & Extraction in the United States?
Percentage of Population Employed in Mining, Quarrying, & Extraction in the United States is 0.44%.