Zip Codes with the Highest Percentage of Population Employed in Health Diagnosing & Treating in Edinburg, TX
RELATED REPORTS & OPTIONS
Health Diagnosing & Treating
Edinburg
Compare Zip Codes
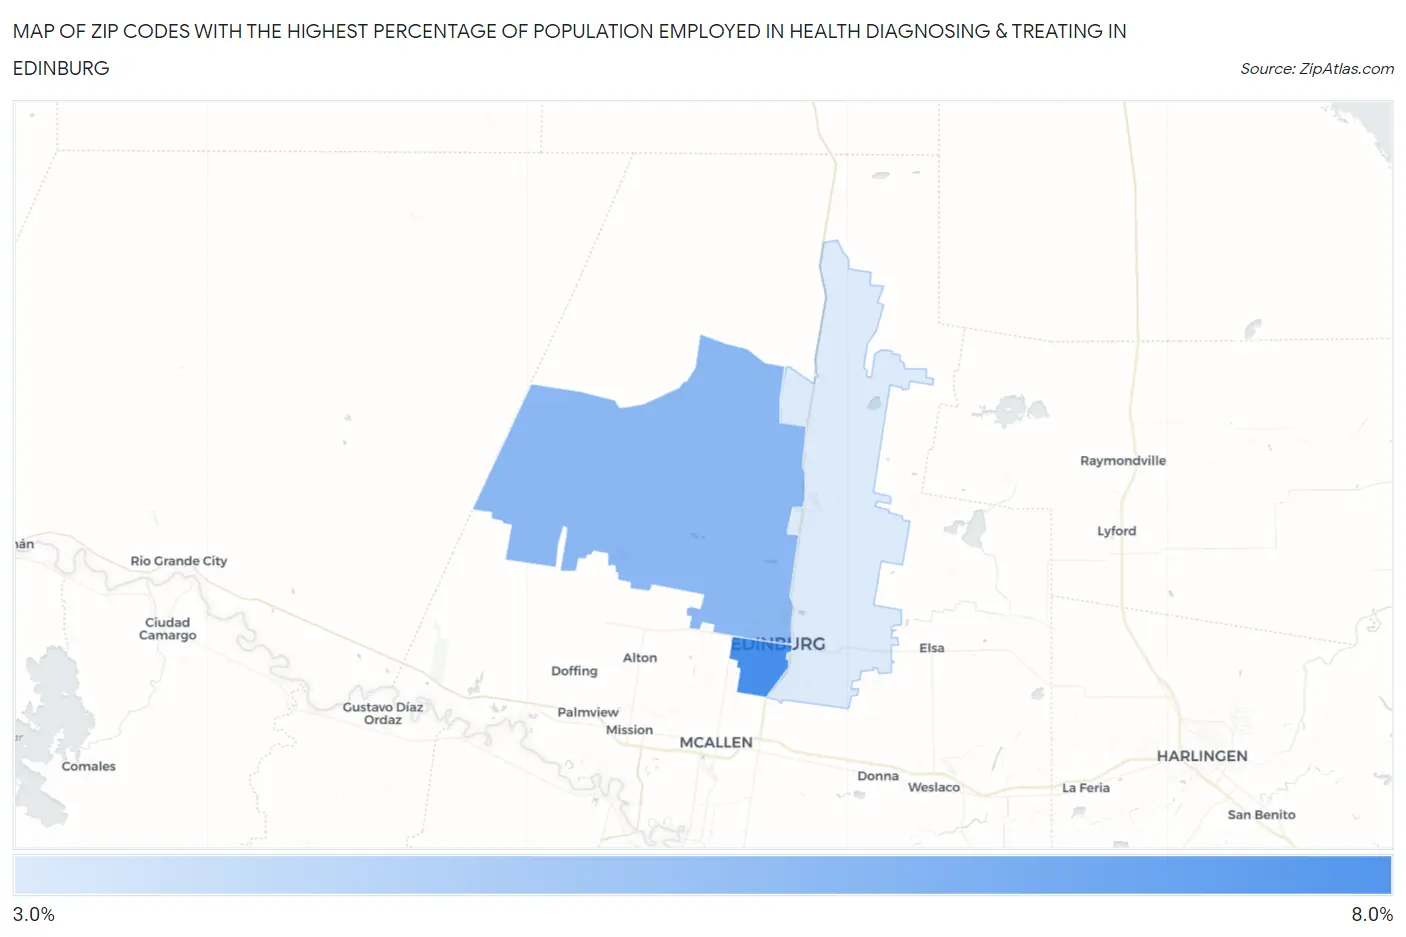
Map of Zip Codes with the Highest Percentage of Population Employed in Health Diagnosing & Treating in Edinburg
0.0%
8.0%
Zip Codes with the Highest Percentage of Population Employed in Health Diagnosing & Treating in Edinburg, TX
| Zip Code | % Employed | vs State | vs National | |
| 1. | 78539 | 7.8% | 5.5%(+2.26)#344 | 6.2%(+1.54)#8,051 |
| 2. | 78541 | 5.8% | 5.5%(+0.293)#633 | 6.2%(-0.433)#14,568 |
| 3. | 78542 | 3.5% | 5.5%(-2.05)#1,181 | 6.2%(-2.77)#22,989 |
1
Common Questions
What are the Top Zip Codes with the Highest Percentage of Population Employed in Health Diagnosing & Treating in Edinburg, TX?
Top Zip Codes with the Highest Percentage of Population Employed in Health Diagnosing & Treating in Edinburg, TX are:
What zip code has the Highest Percentage of Population Employed in Health Diagnosing & Treating in Edinburg, TX?
78539 has the Highest Percentage of Population Employed in Health Diagnosing & Treating in Edinburg, TX with 7.8%.
What is the Percentage of Population Employed in Health Diagnosing & Treating in Edinburg, TX?
Percentage of Population Employed in Health Diagnosing & Treating in Edinburg is 6.8%.
What is the Percentage of Population Employed in Health Diagnosing & Treating in Texas?
Percentage of Population Employed in Health Diagnosing & Treating in Texas is 5.5%.
What is the Percentage of Population Employed in Health Diagnosing & Treating in the United States?
Percentage of Population Employed in Health Diagnosing & Treating in the United States is 6.2%.