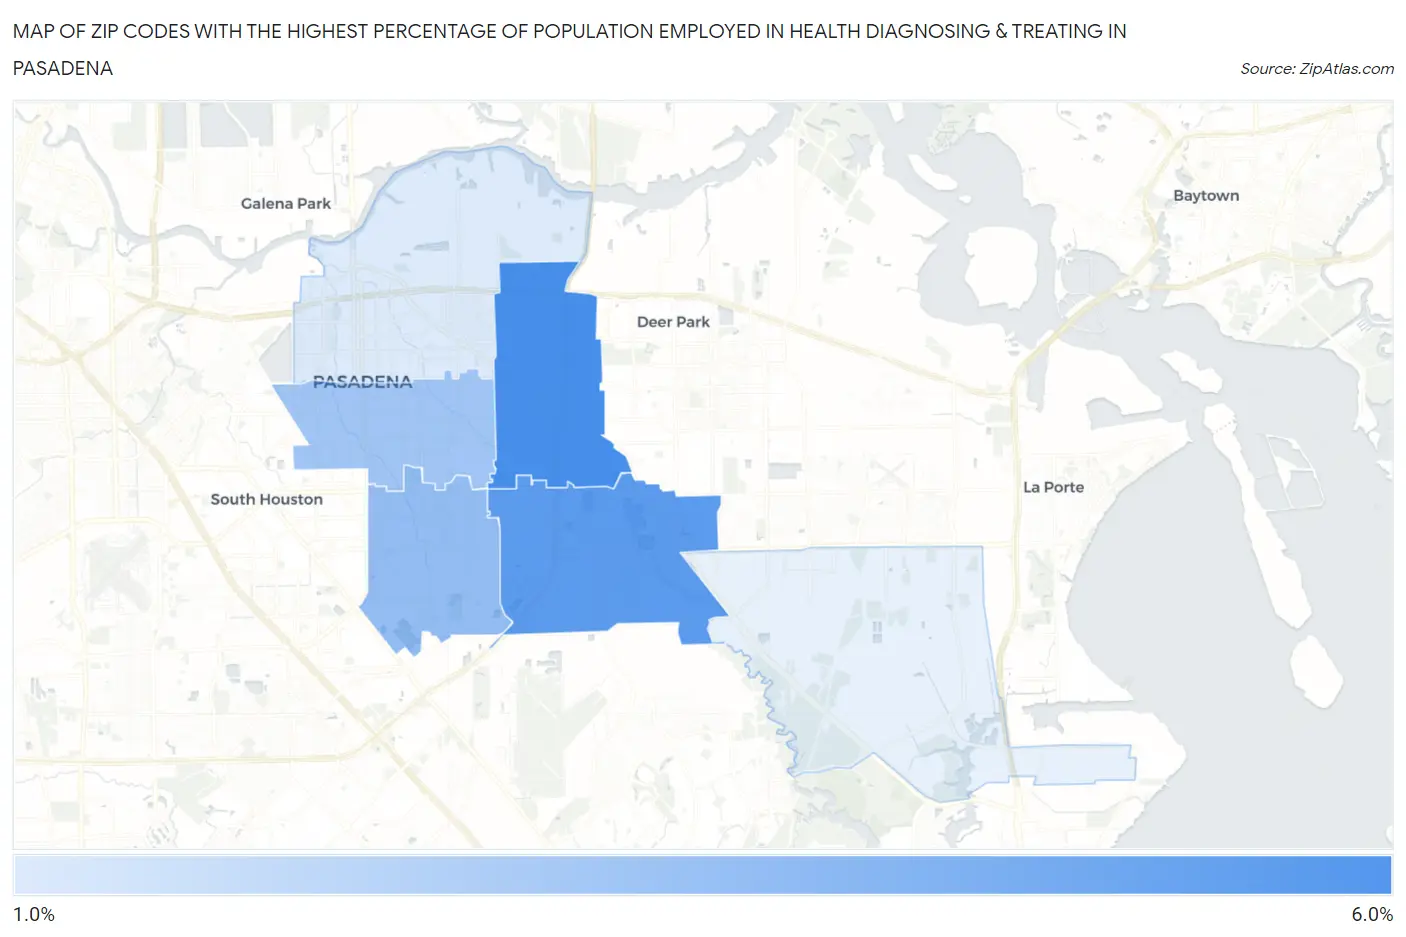
Zip Codes with the Highest Percentage of Population Employed in Health Diagnosing & Treating in Pasadena, TX
RELATED REPORTS & OPTIONS
Health Diagnosing & Treating
Pasadena
Compare Zip Codes
Map of Zip Codes with the Highest Percentage of Population Employed in Health Diagnosing & Treating in Pasadena
0.0%
6.0%
Zip Codes with the Highest Percentage of Population Employed in Health Diagnosing & Treating in Pasadena, TX
| Zip Code | % Employed | vs State | vs National | |
| 1. | 77503 | 5.1% | 5.5%(-0.386)#801 | 6.2%(-1.11)#17,201 |
| 2. | 77505 | 4.7% | 5.5%(-0.841)#905 | 6.2%(-1.57)#18,941 |
| 3. | 77504 | 3.4% | 5.5%(-2.10)#1,195 | 6.2%(-2.82)#23,134 |
| 4. | 77502 | 3.1% | 5.5%(-2.39)#1,269 | 6.2%(-3.12)#23,976 |
| 5. | 77506 | 1.8% | 5.5%(-3.71)#1,508 | 6.2%(-4.44)#26,783 |
1
Common Questions
What are the Top 5 Zip Codes with the Highest Percentage of Population Employed in Health Diagnosing & Treating in Pasadena, TX?
Top 5 Zip Codes with the Highest Percentage of Population Employed in Health Diagnosing & Treating in Pasadena, TX are:
What zip code has the Highest Percentage of Population Employed in Health Diagnosing & Treating in Pasadena, TX?
77503 has the Highest Percentage of Population Employed in Health Diagnosing & Treating in Pasadena, TX with 5.1%.
What is the Percentage of Population Employed in Health Diagnosing & Treating in Pasadena, TX?
Percentage of Population Employed in Health Diagnosing & Treating in Pasadena is 3.9%.
What is the Percentage of Population Employed in Health Diagnosing & Treating in Texas?
Percentage of Population Employed in Health Diagnosing & Treating in Texas is 5.5%.
What is the Percentage of Population Employed in Health Diagnosing & Treating in the United States?
Percentage of Population Employed in Health Diagnosing & Treating in the United States is 6.2%.